Long-Term Monitoring Trend Graphs
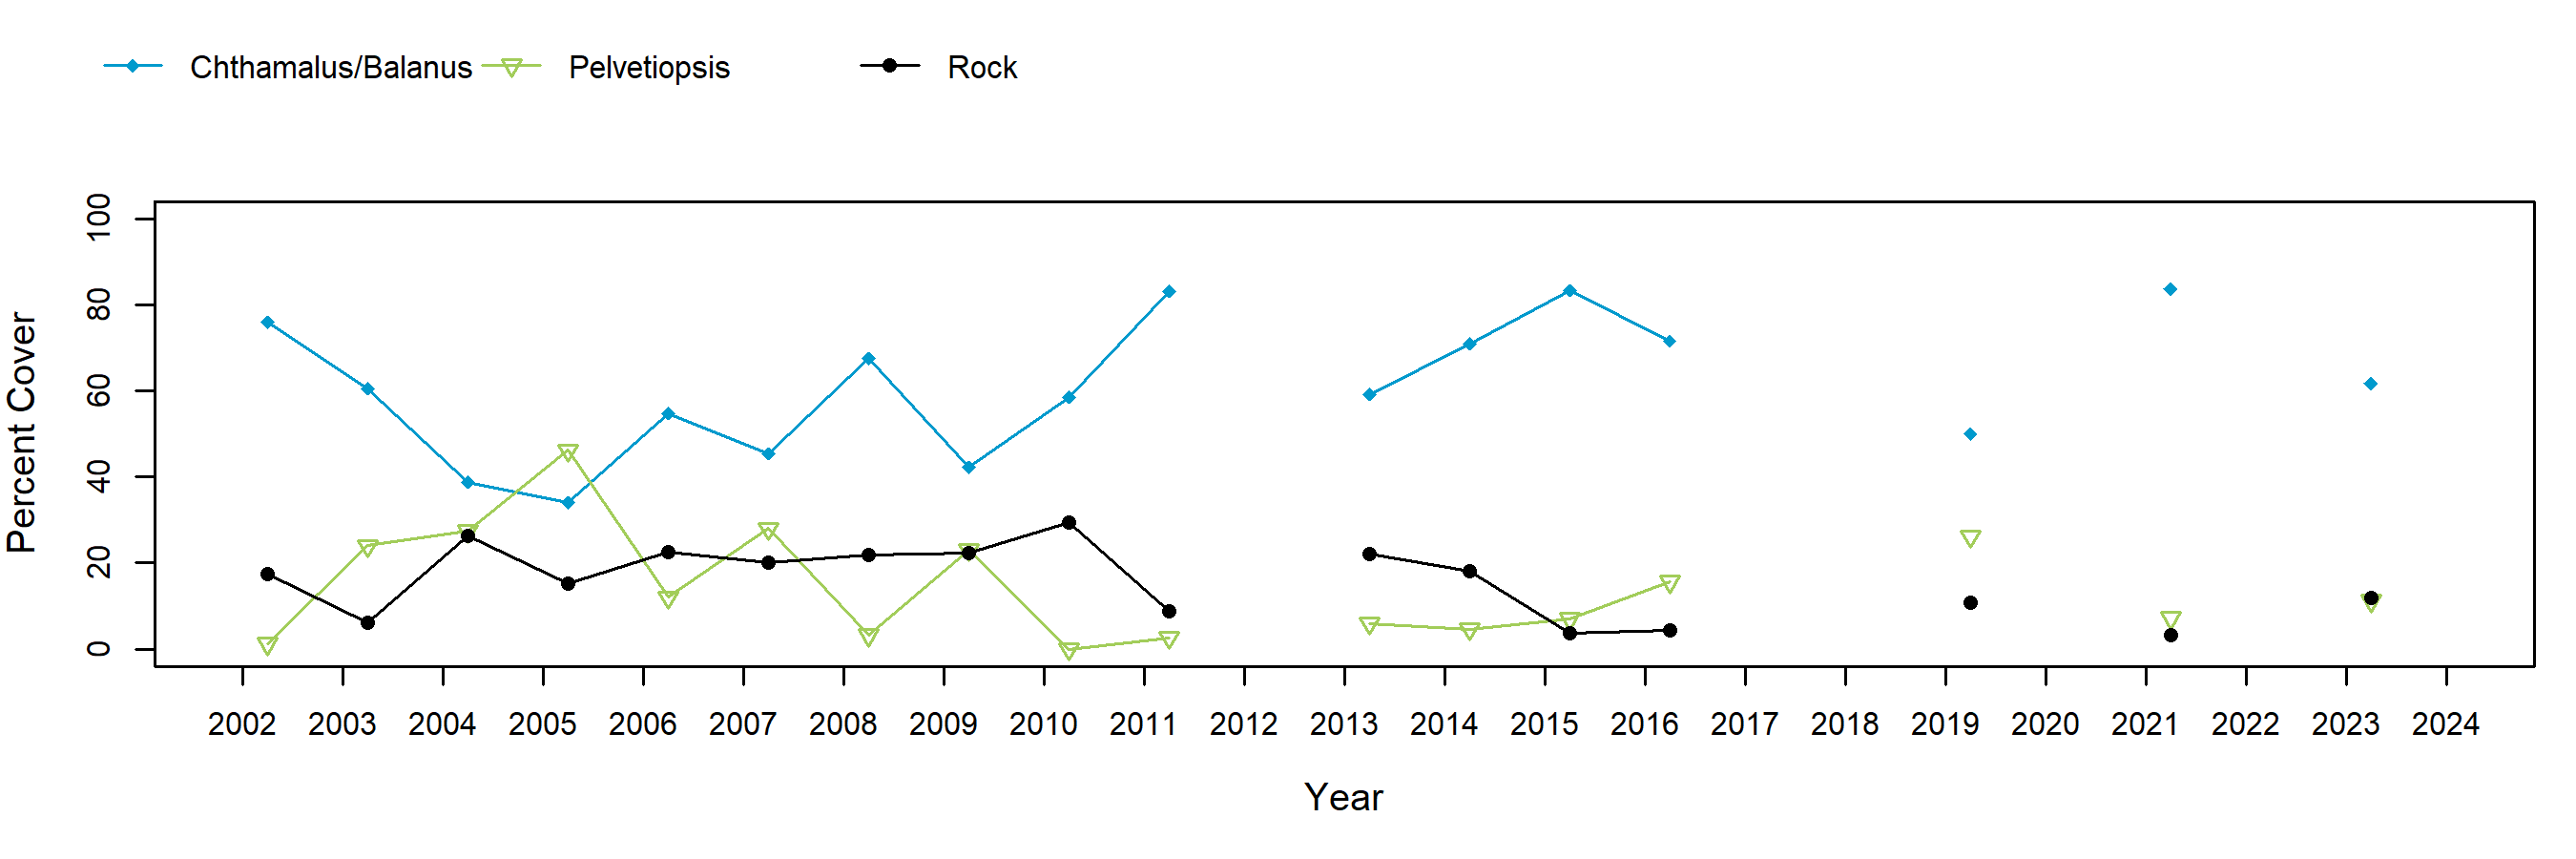
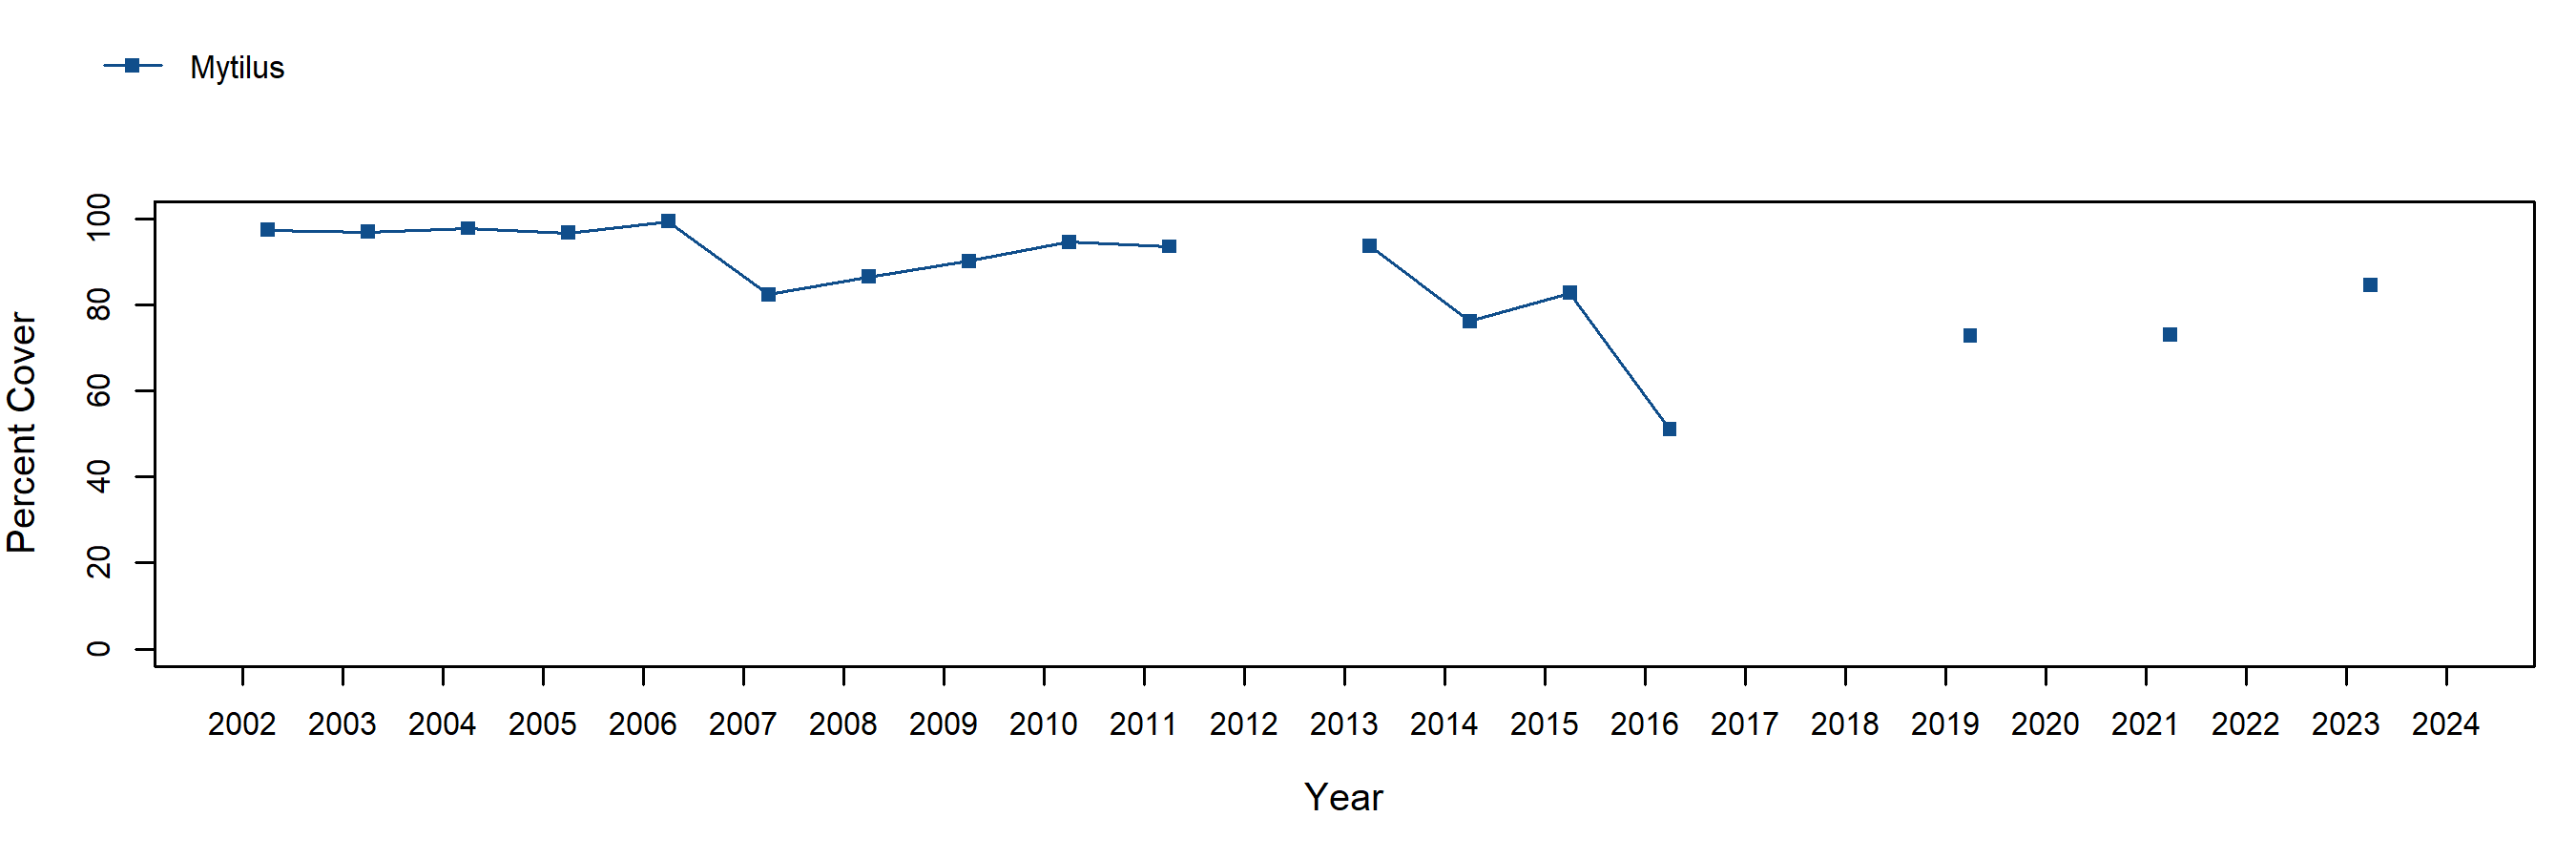
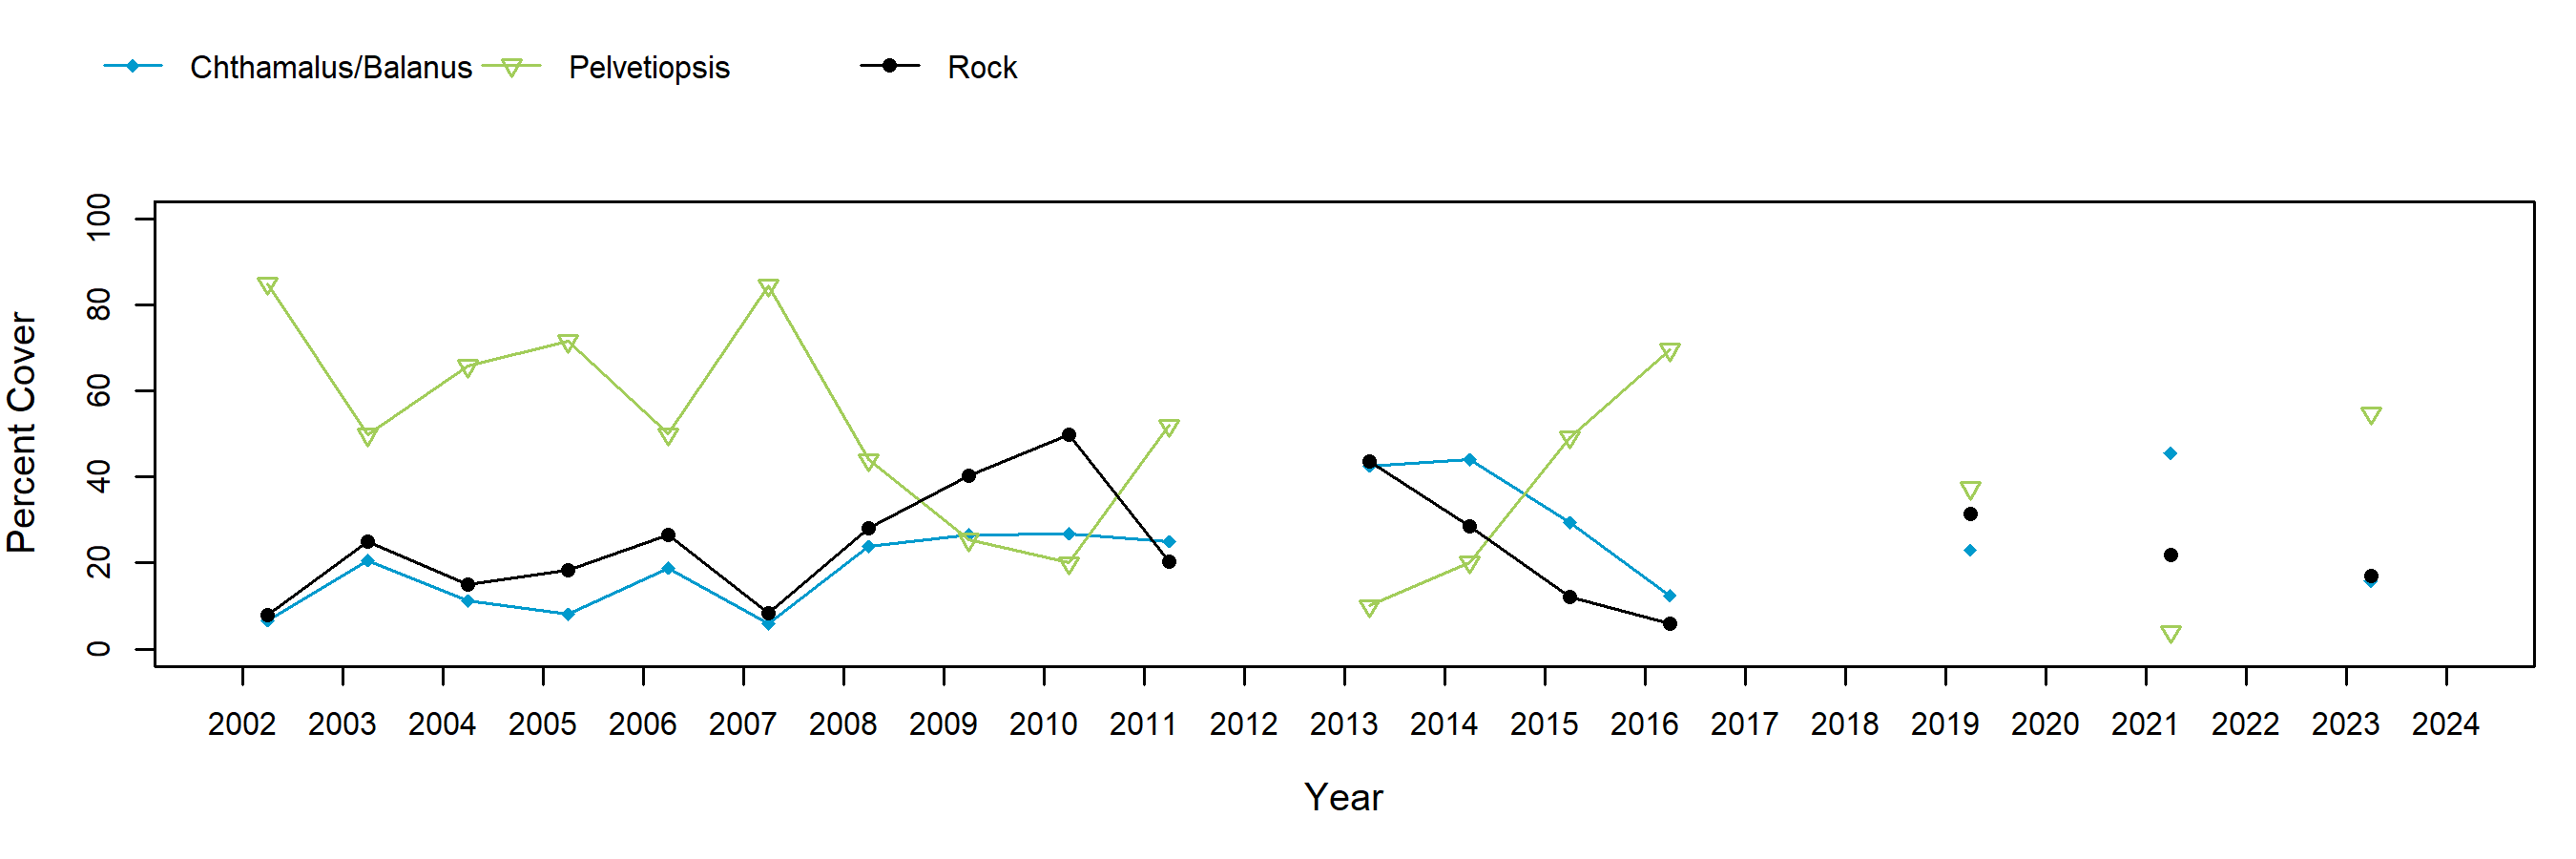
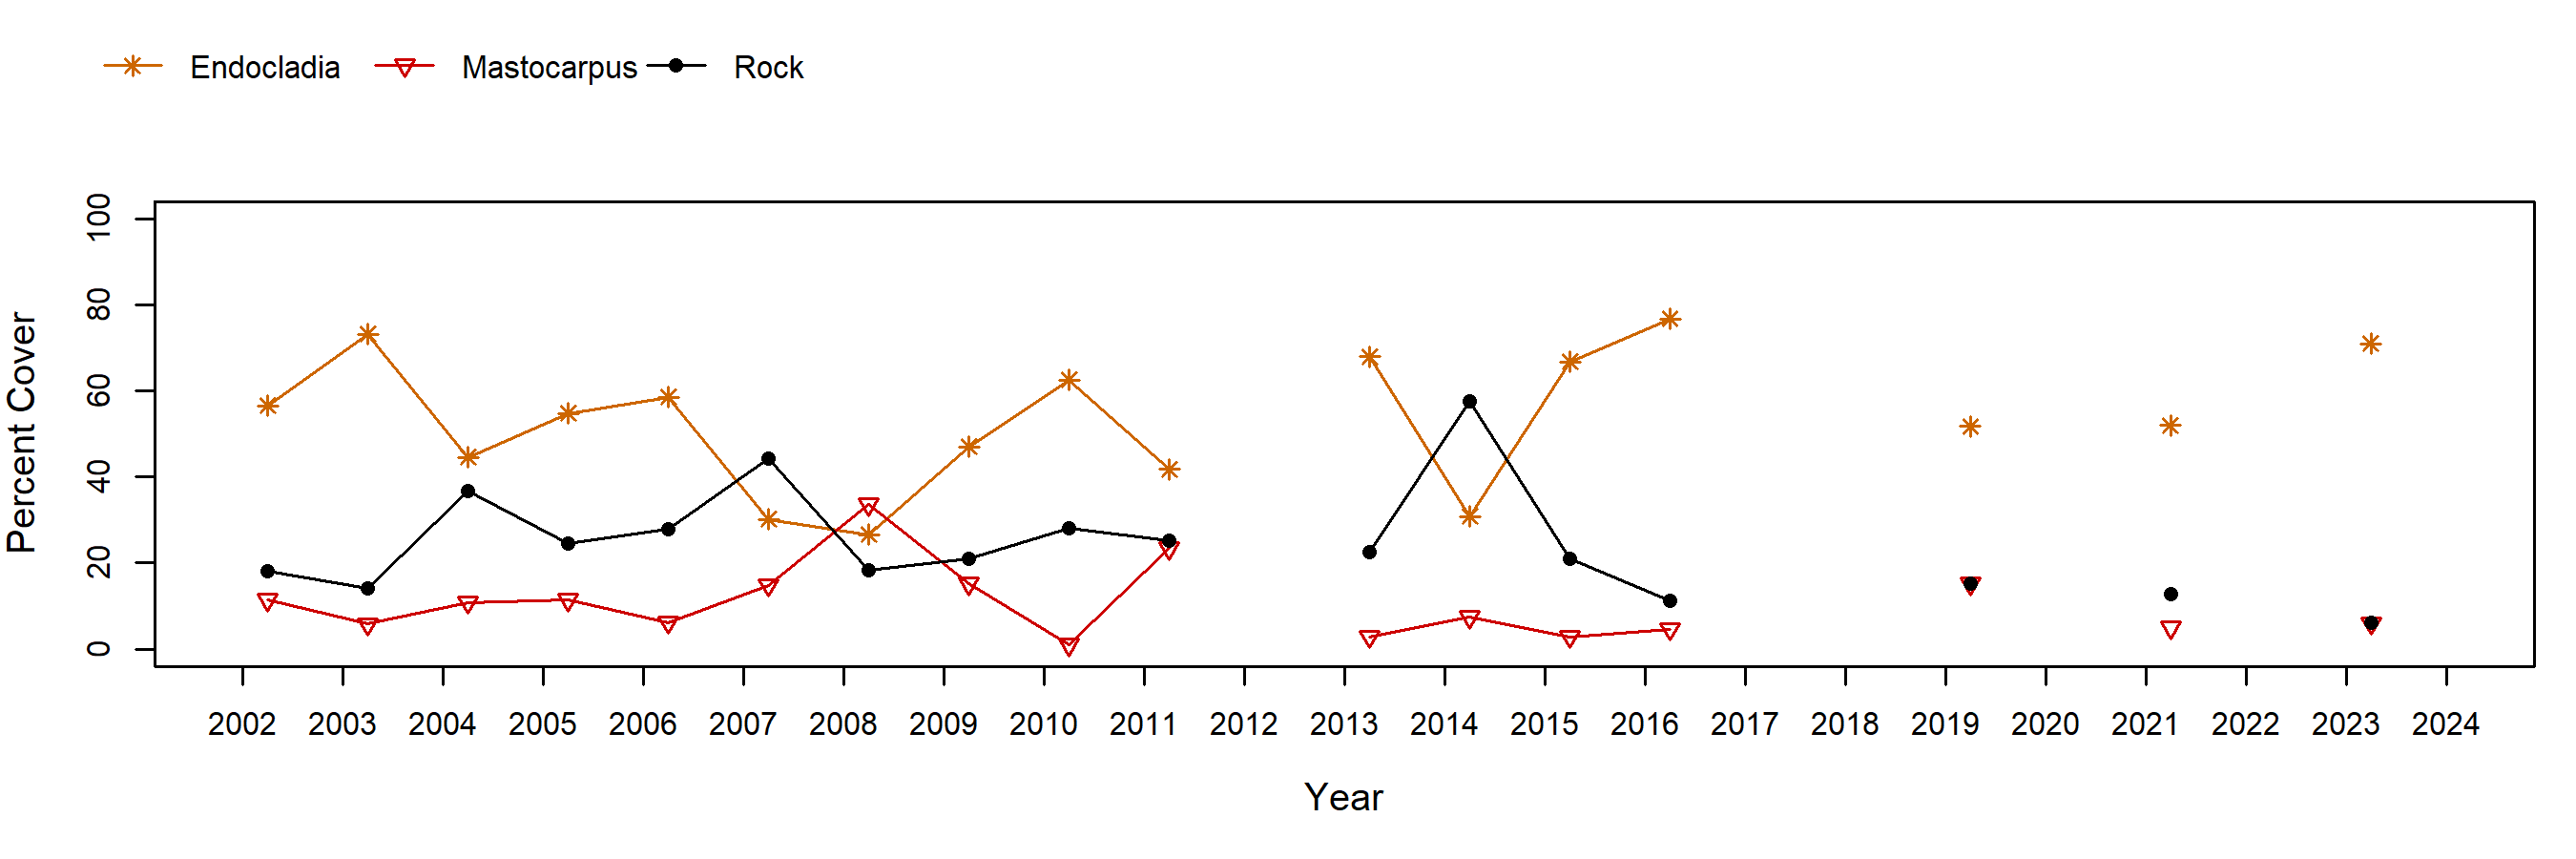
Barnacles in the focal plots for this species group consisted of higher cover of Balanus glandula than Chthamalus fissus/dalli, but a mixture was present in all years. In the years when barnacle cover was lower, cover of the rockweed, Pelvetiopsis, increased. Barnacles, both live and dead, provide an excellent substrate upon which Pelvetiopsis can settle, so it is possible that during the years of “low” barnacle cover, barnacles were simply hidden below the rockweed. Cover of mussels in Mytilus plots was consistently high until 2016, when it dropped to 51%. A near-complete recovery had occurred by 2024. Cover of both Pelvetiopsis and Endocladia in their respective target plots has varied substantially over time, but declines have typically been followed by rapid recovery.
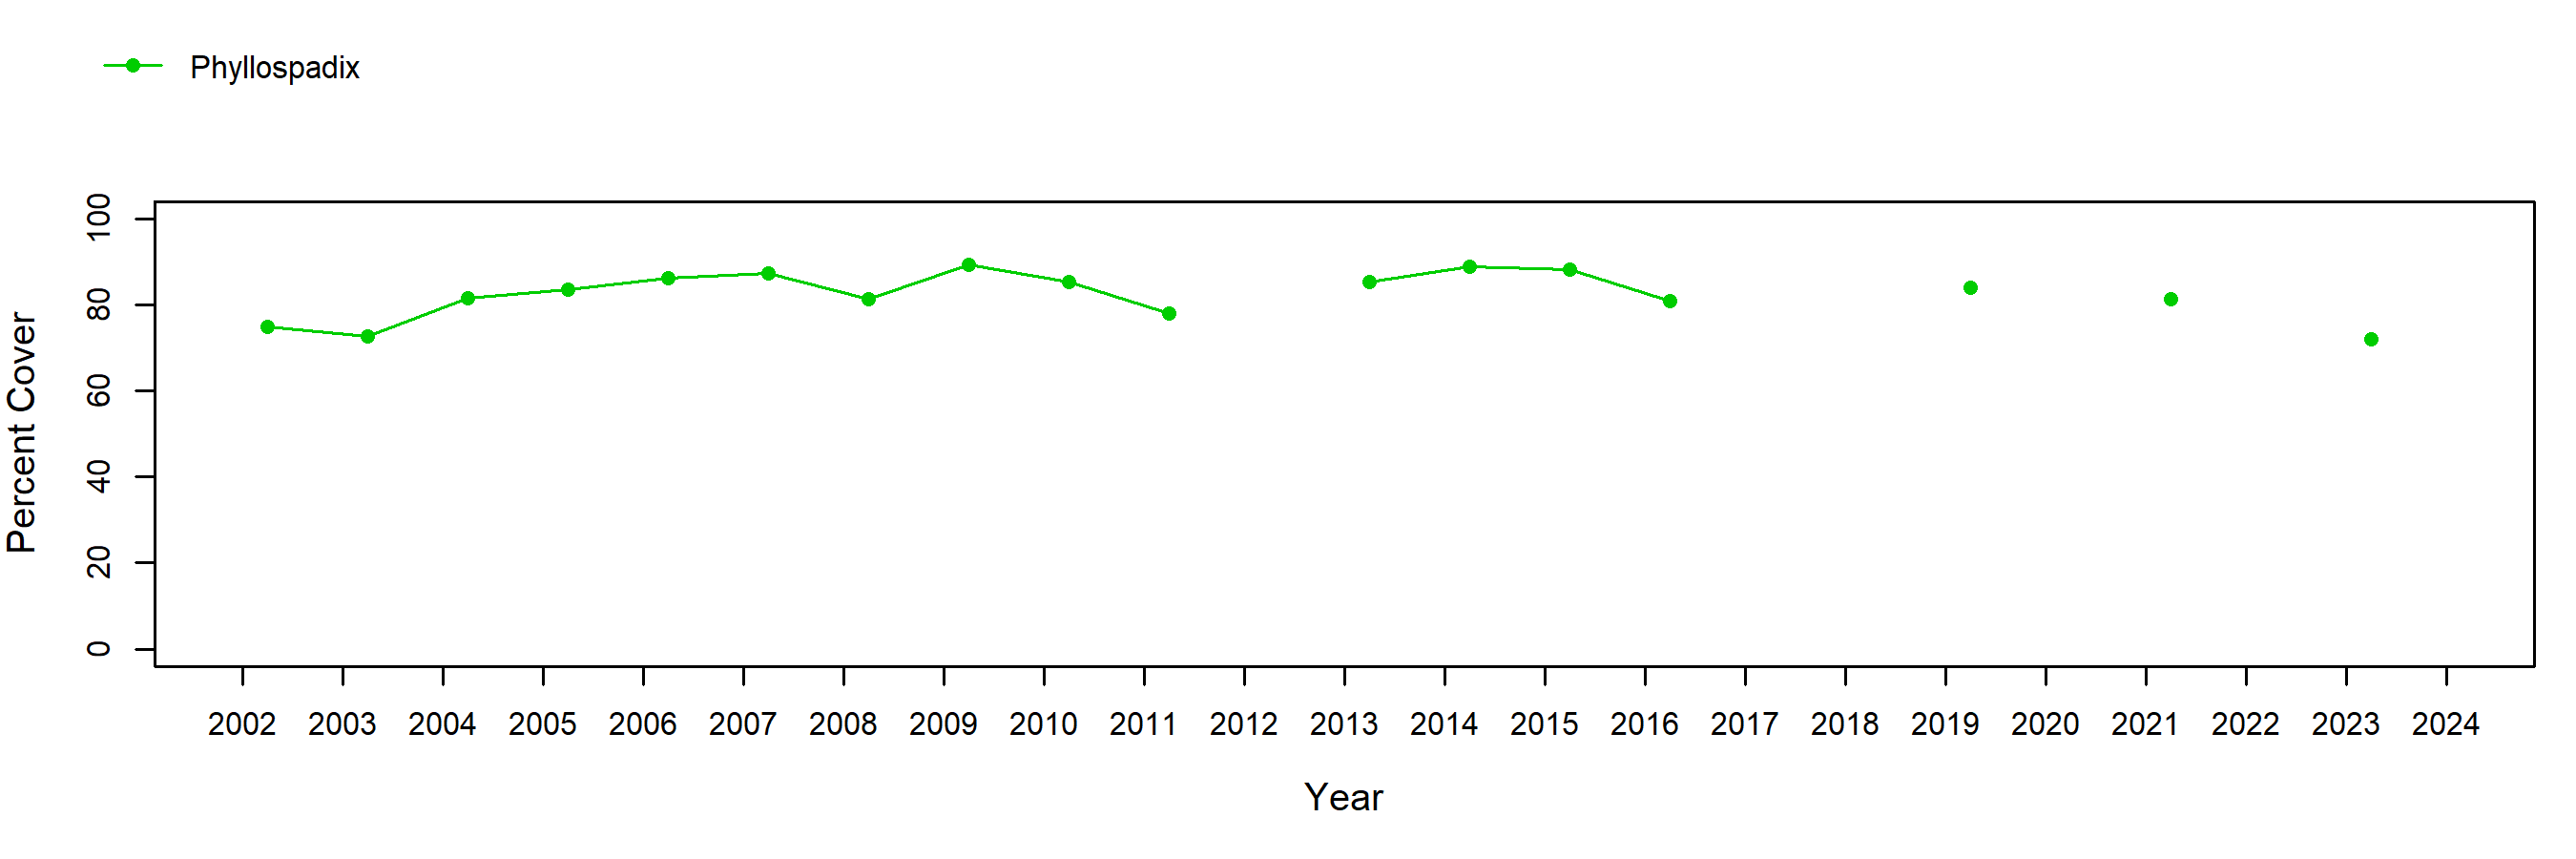
Phyllospadix transects are located within pools at Burnt Hill, which typically means that cover does not fluctuate as much as in areas where the surfgrass is exposed to air at low tide, and can become dry and bleached out during warm, mid-day low tide periods. Surfgrass cover was relatively stable, with the exception of 2024, when a sharp decline was observed.
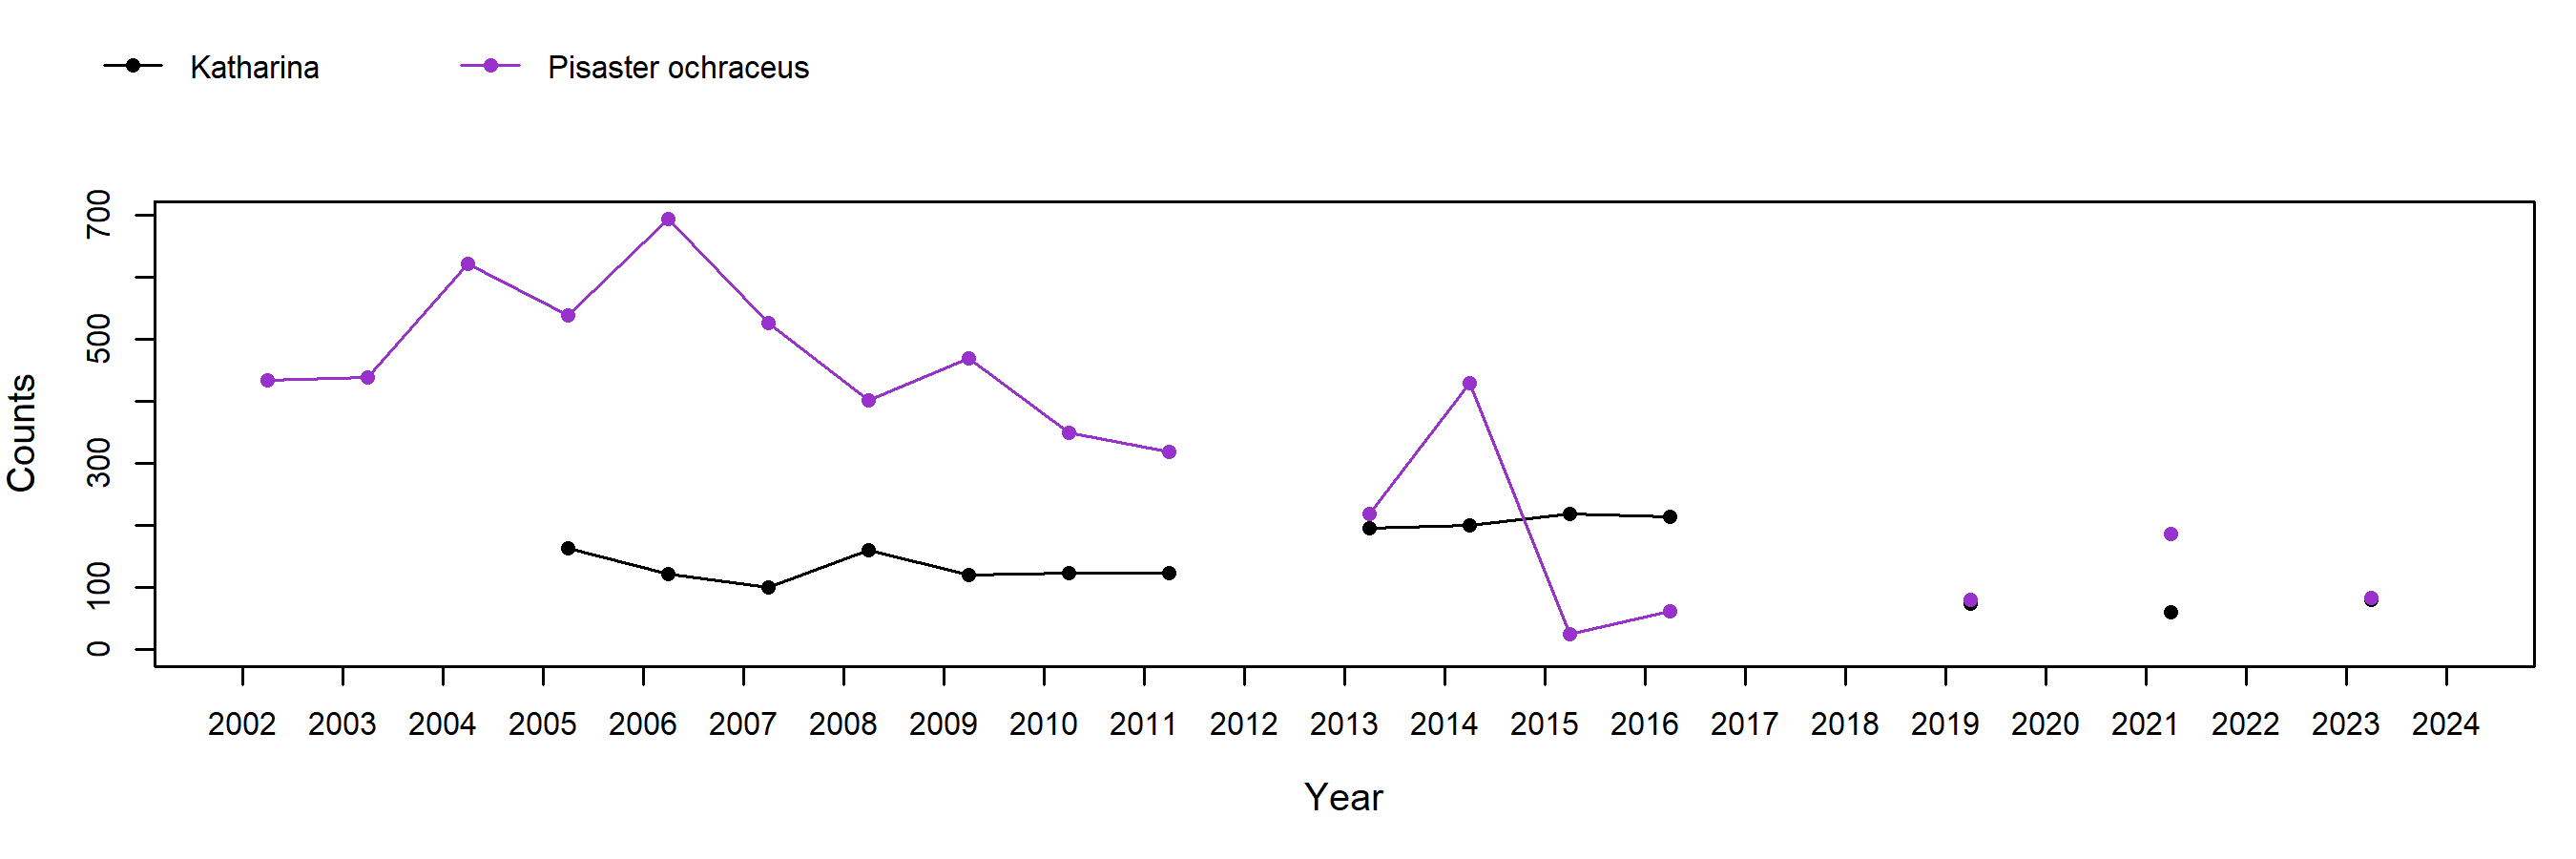
As with many sites, abundance of the sea star, Pisaster ochraceus, fluctuated substantially over time for this highly mobile animal. Surprisingly, ochre star numbers remained high in summer 2014, well after declines had occurred along much of the west coast due to Sea Star Wasting Syndrome, but a significant decline was documented in 2015. As of 2024, no significant recruitment pulse (as evidenced by low numbers of stars < 50 mm radius) had been observed, suggesting that recovery of ochre stars at Burnt Hill could be slow.
In order to standardize species resolution across all MARINe groups and over time, some species (typically rare) were lumped for graphical presentation of Long-Term monitoring data. See lumped categories for definitions (some variation occurs between methods and over time).
If you experience any barriers accessing the trend graphs below, please contact (pacificr@ucsc.edu) for help.
Photo Plots

Below are the trends observed for each Photo Plot target species at this site. Long-Term percent cover trend graphs also include any species that reached a minimum of 25% cover during any single point in time within a given target species assemblage. Breaks in trend lines represent missed sampling events. For additional species observed that did not meet this 25% threshold, please use the Graphing Tool.
Chthamalus/Balanus (Acorn Barnacles) – percent cover
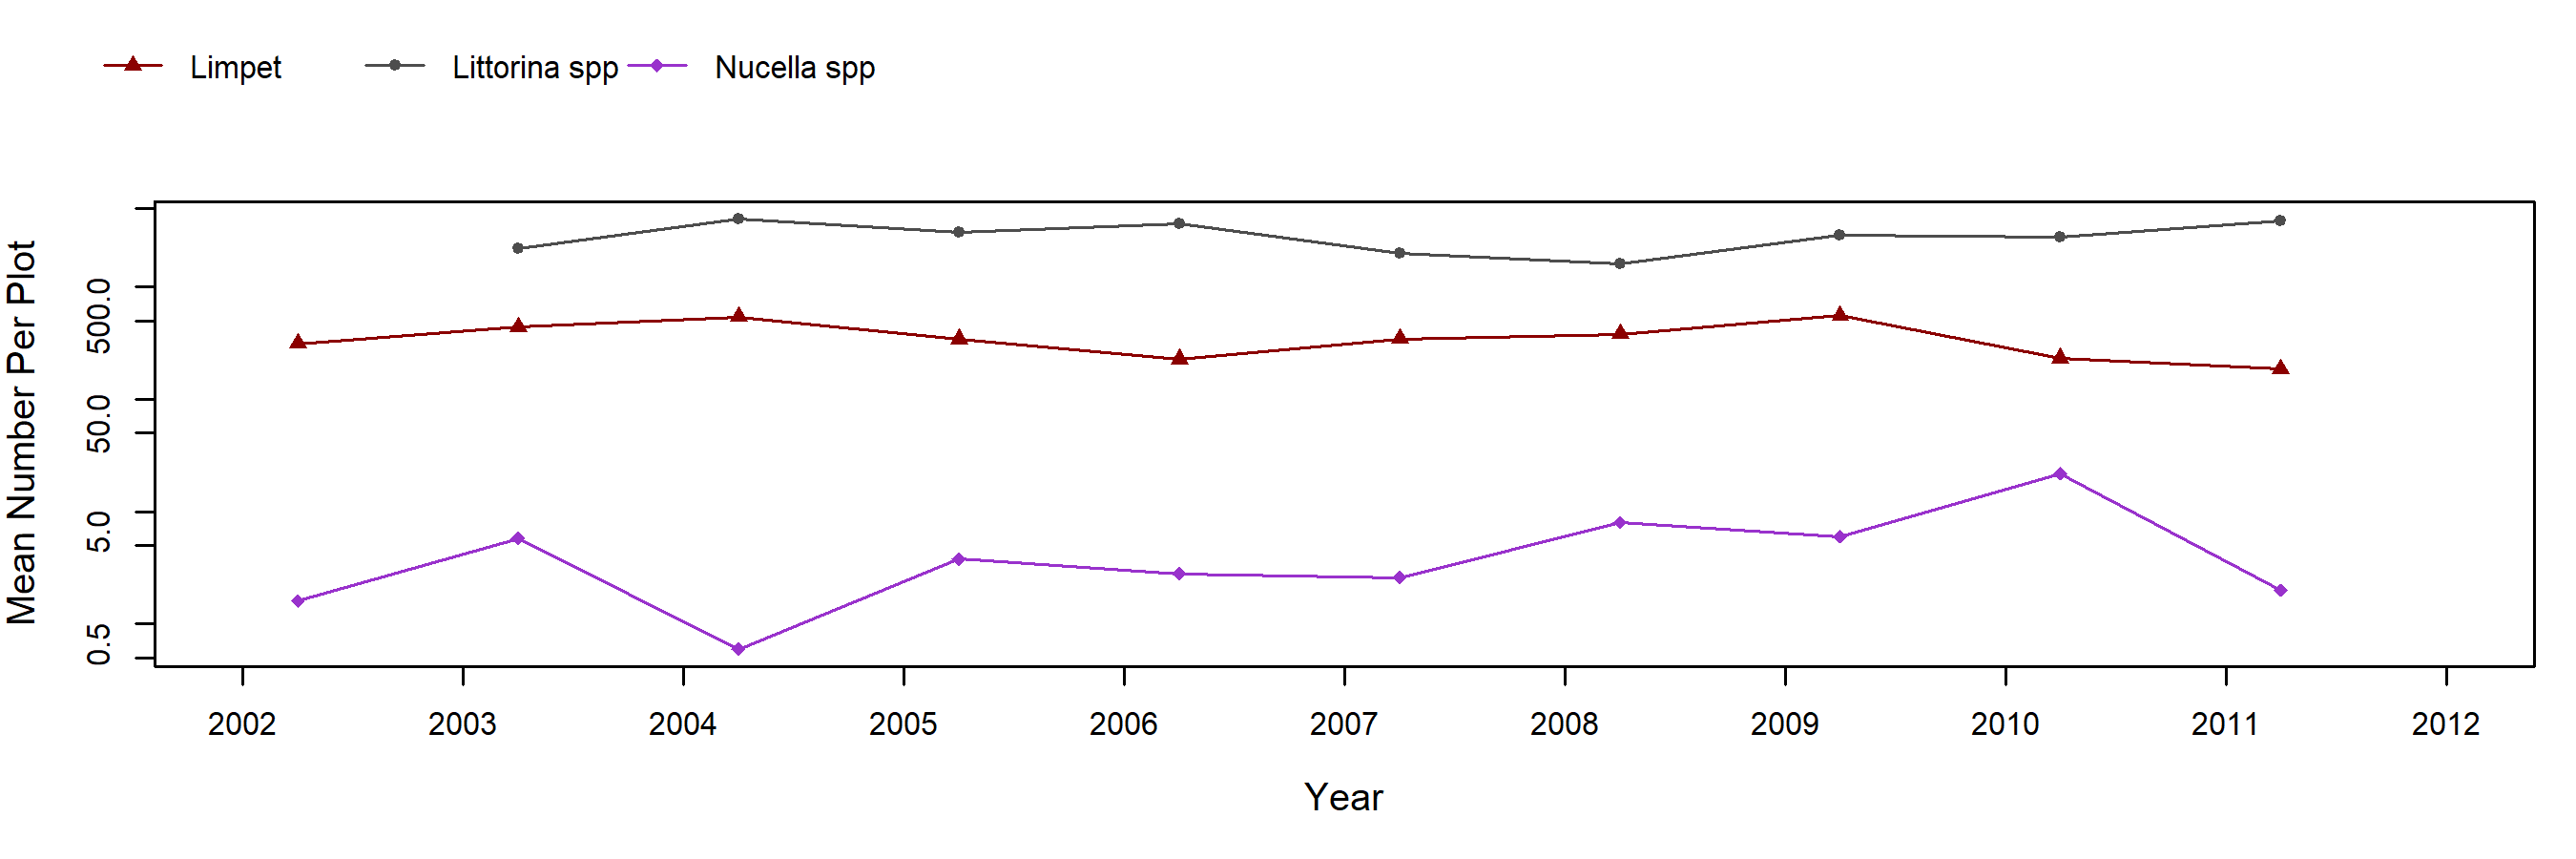
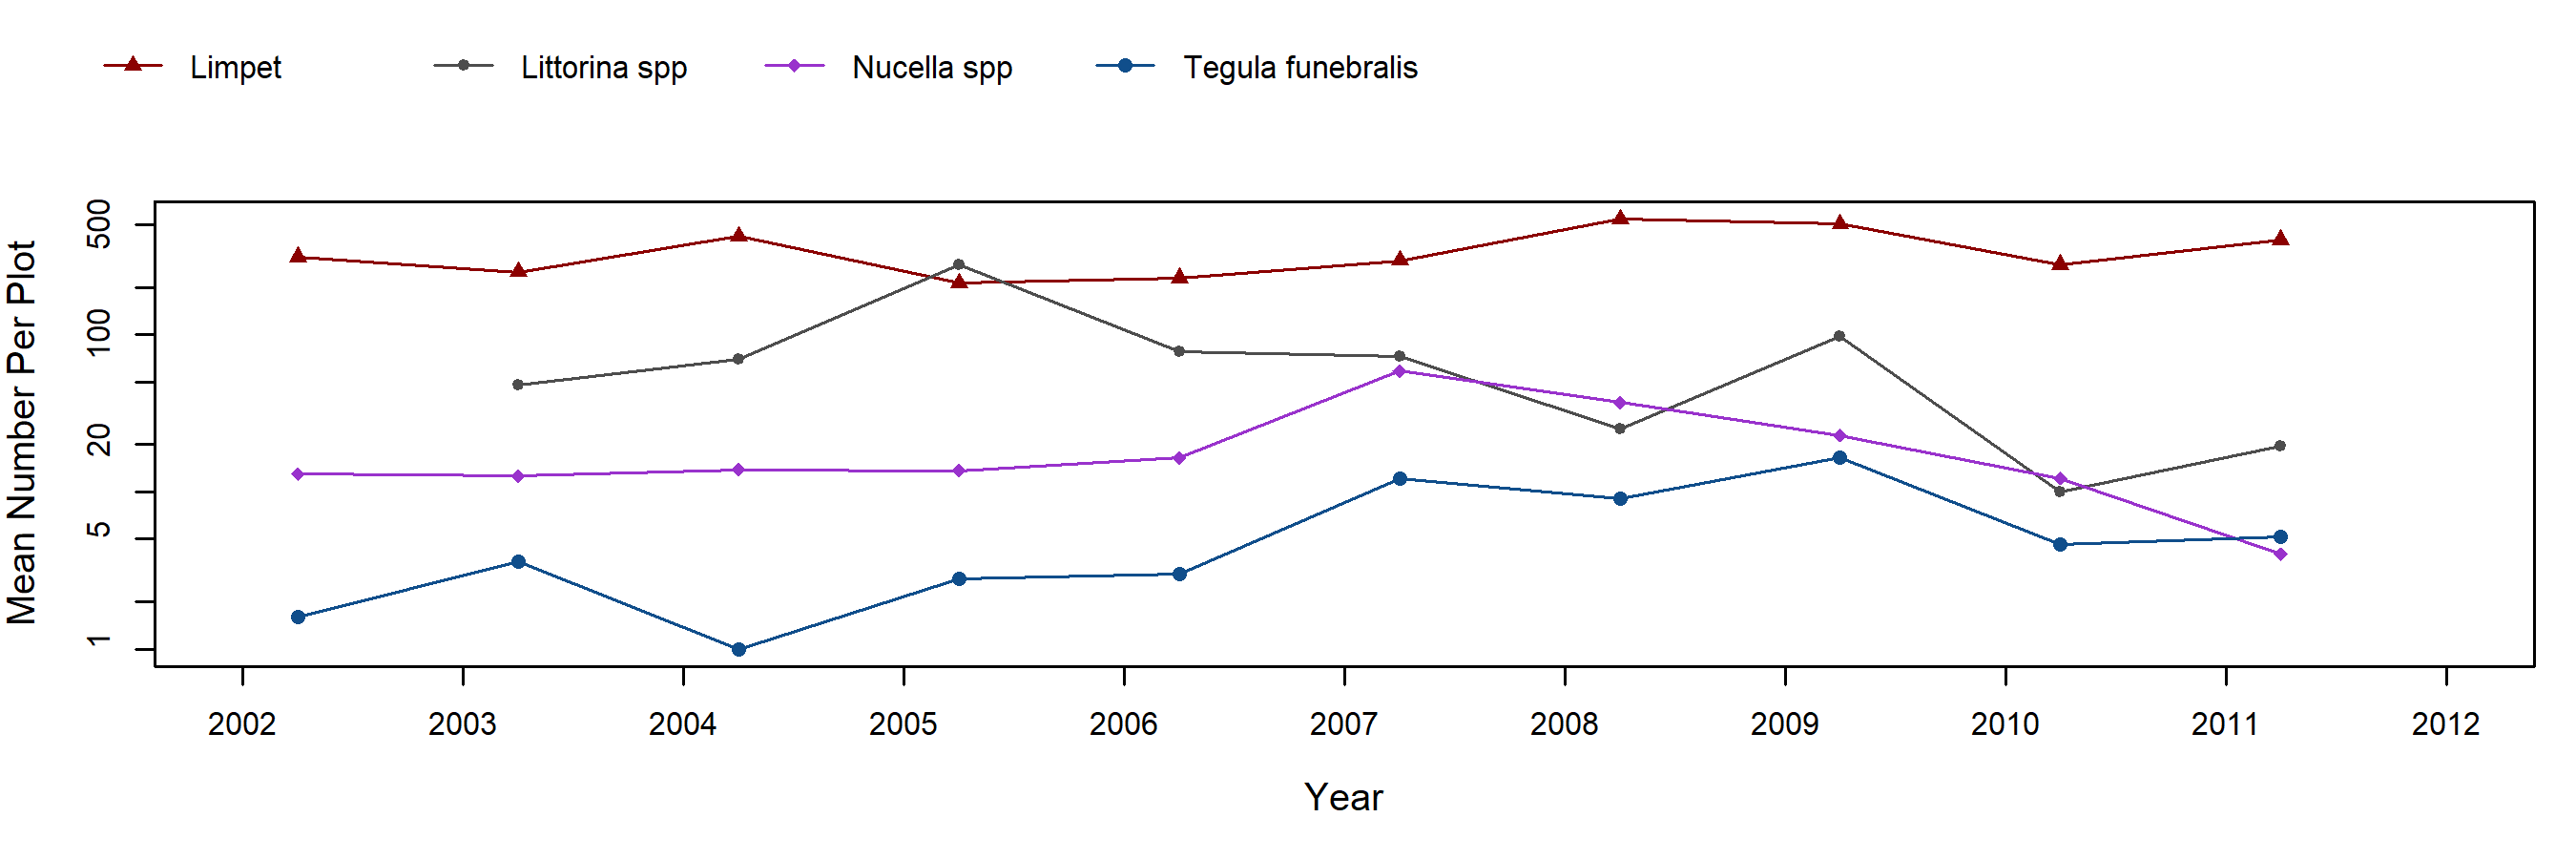
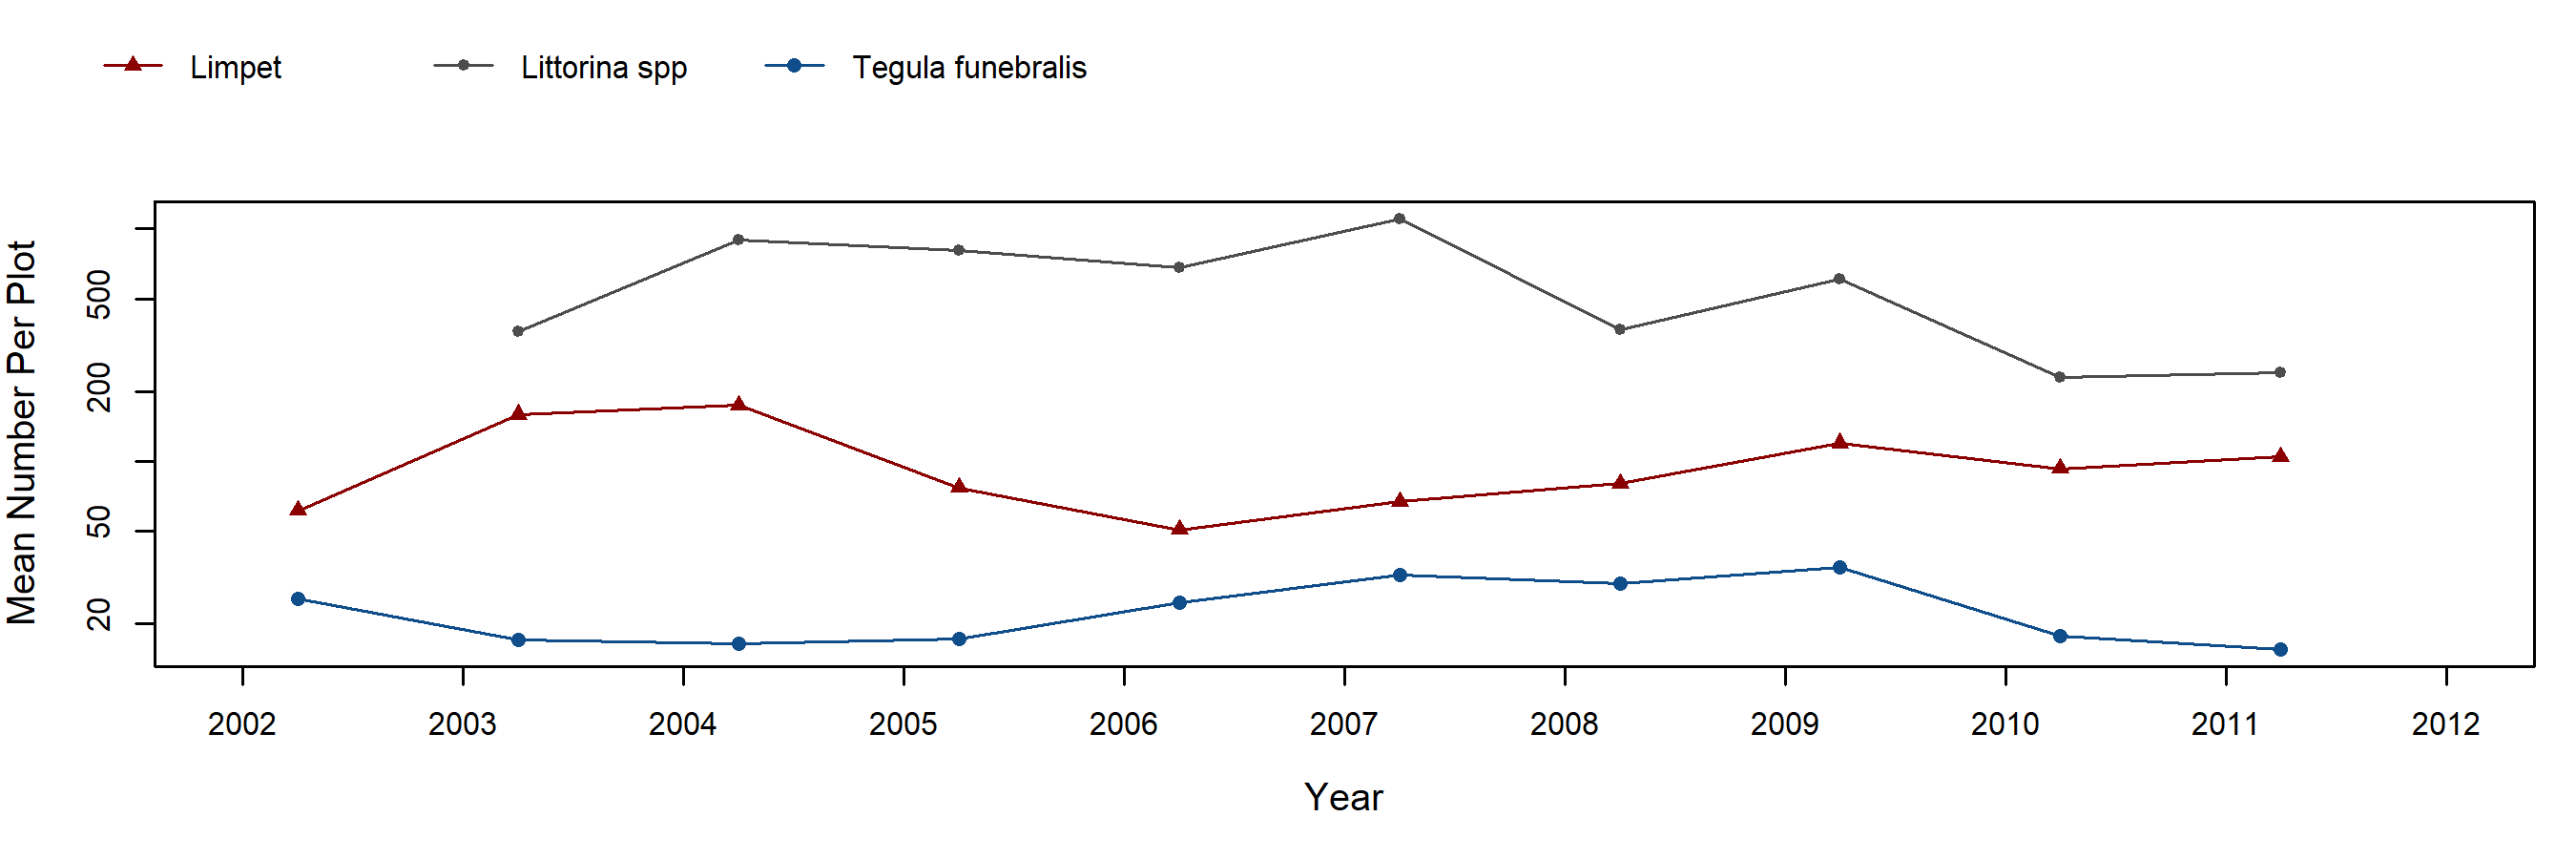
Chthamalus/Balanus (Acorn Barnacles) – motile invertebrate counts
Mytilus (California Mussel) – percent cover
Mytilus (California Mussel) – motile invertebrate counts
Pelvetiopsis (Dwarf Rockweed) – percent cover
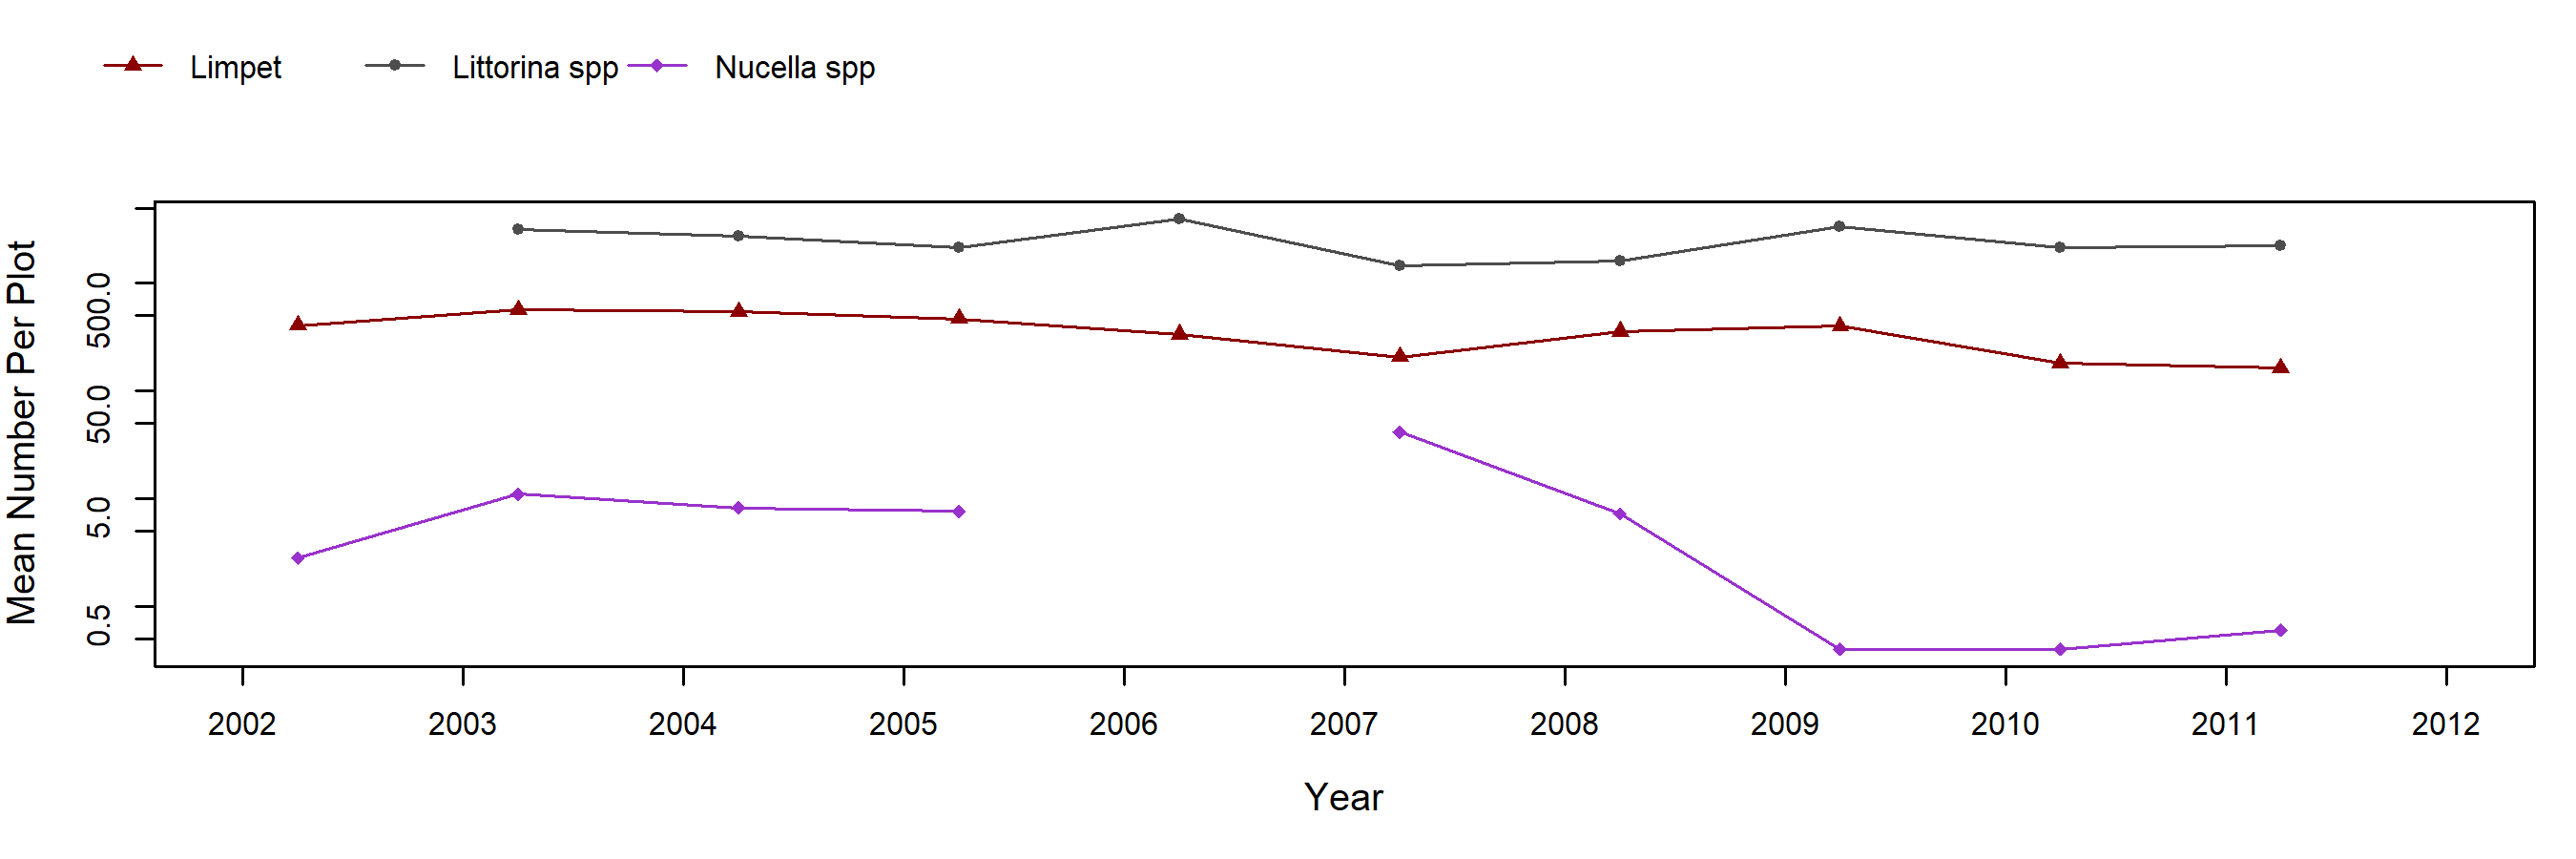
Pelvetiopsis (Dwarf Rockweed) – motile invertebrate counts
Endocladia (Turfweed) – percent cover
Endocladia (Turfweed) – motile invertebrate counts
Transects

Below are the trends observed for each Transect target species at this site. Long-Term trend graphs also include any species that reached a minimum of 25% cover during any single point in time within a given target species assemblage. Breaks in trend lines represent missed sampling events.
Phyllospadix (Surfgrass)
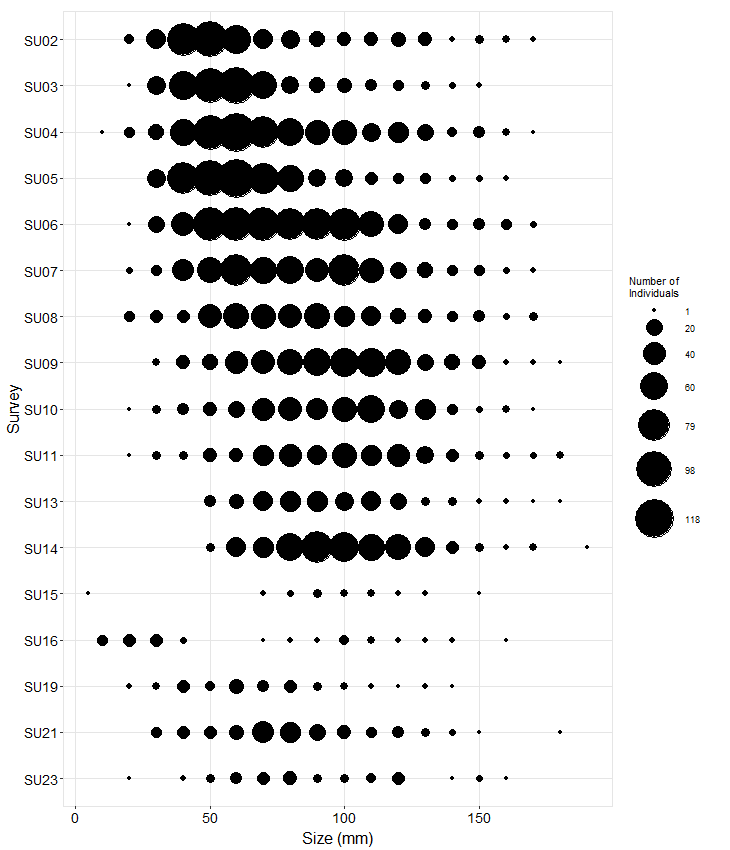
Species Counts and Sizes

Species Counts and Sizes (where recorded) for Pisaster are shown below for this site. At some sites, other sea star species and Katharina are counted in addition to Pisaster. The sum of all individuals across all plots is displayed. Note that data gaps are represented by breaks in long-term count trend lines, but are not shown in size plots.
Pisaster ochraceus (Ochre Star) – counts
Pisaster ochraceus (Ochre Star) – sizes