Long-Term Monitoring Trend Graphs
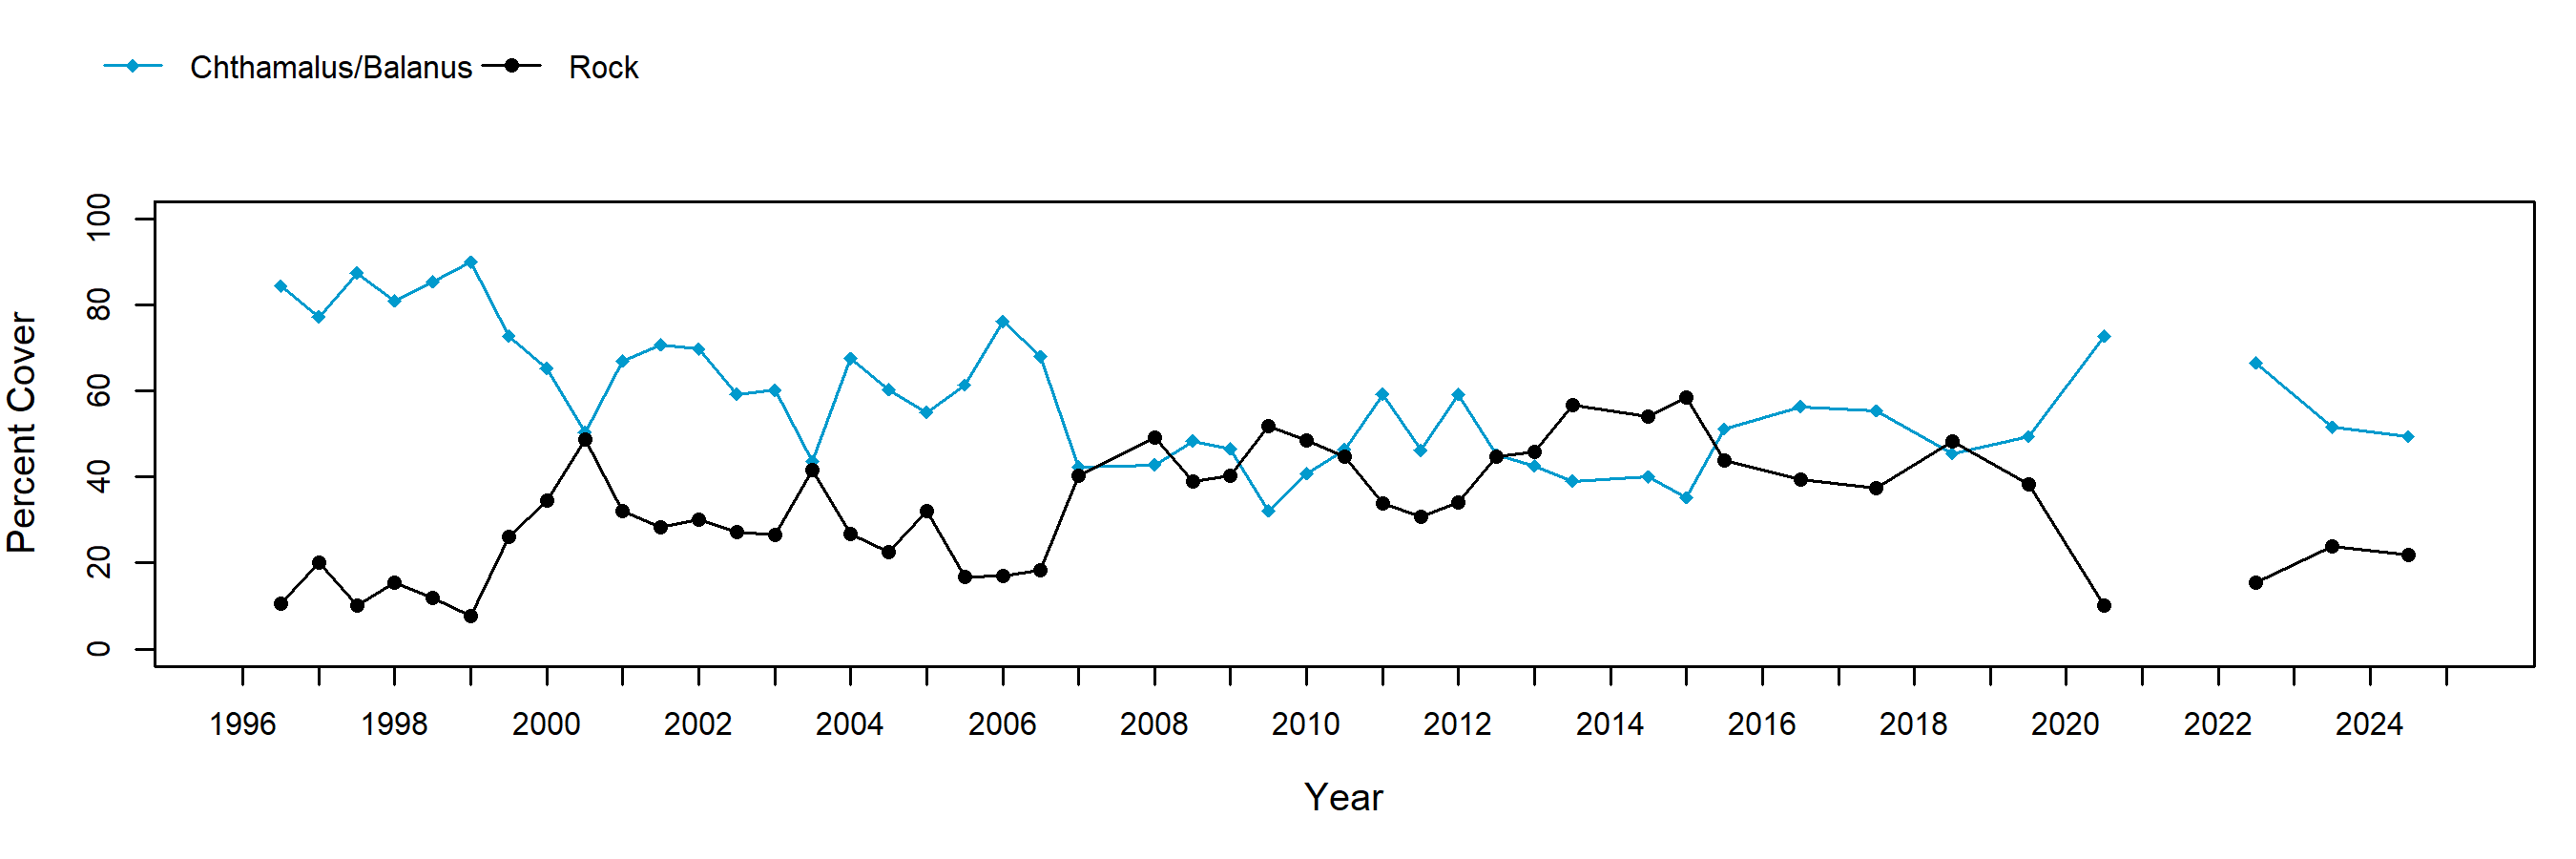
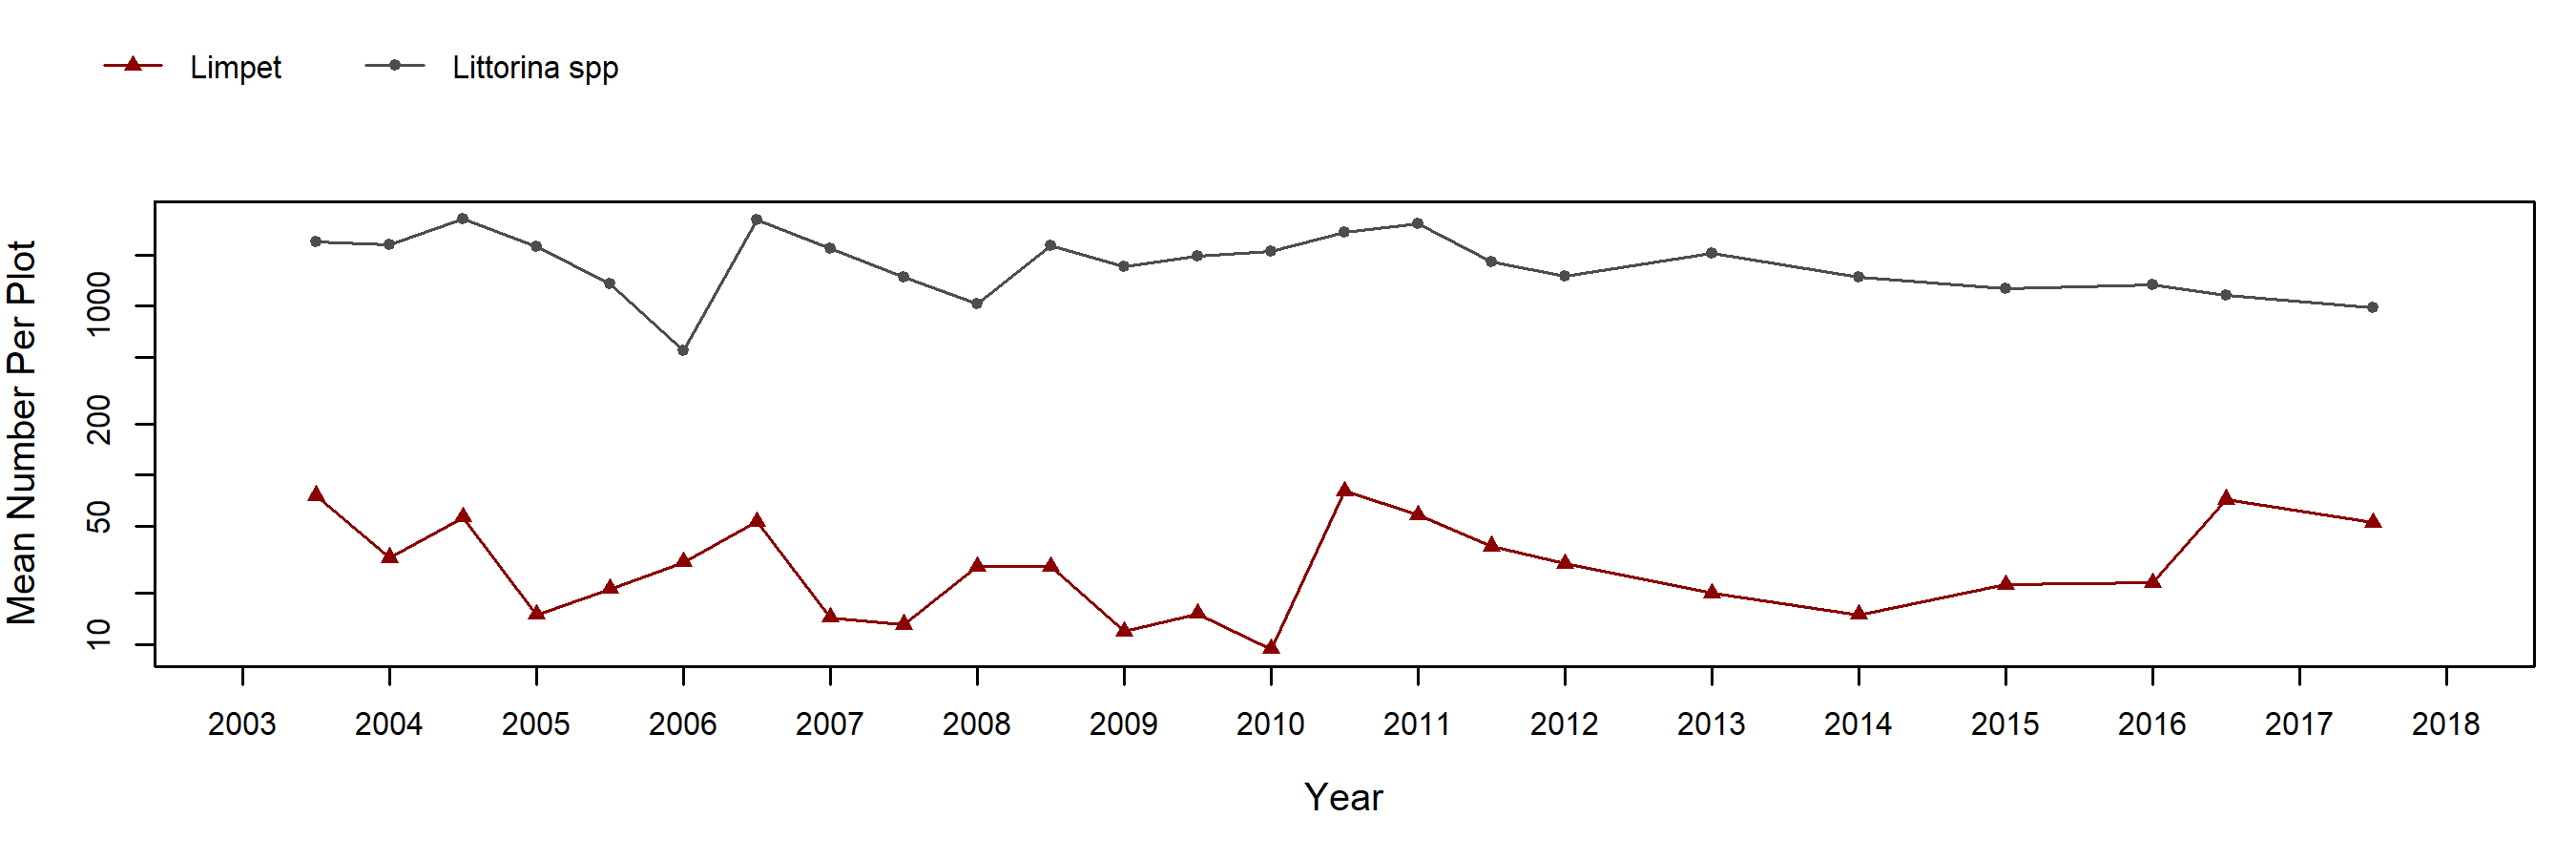
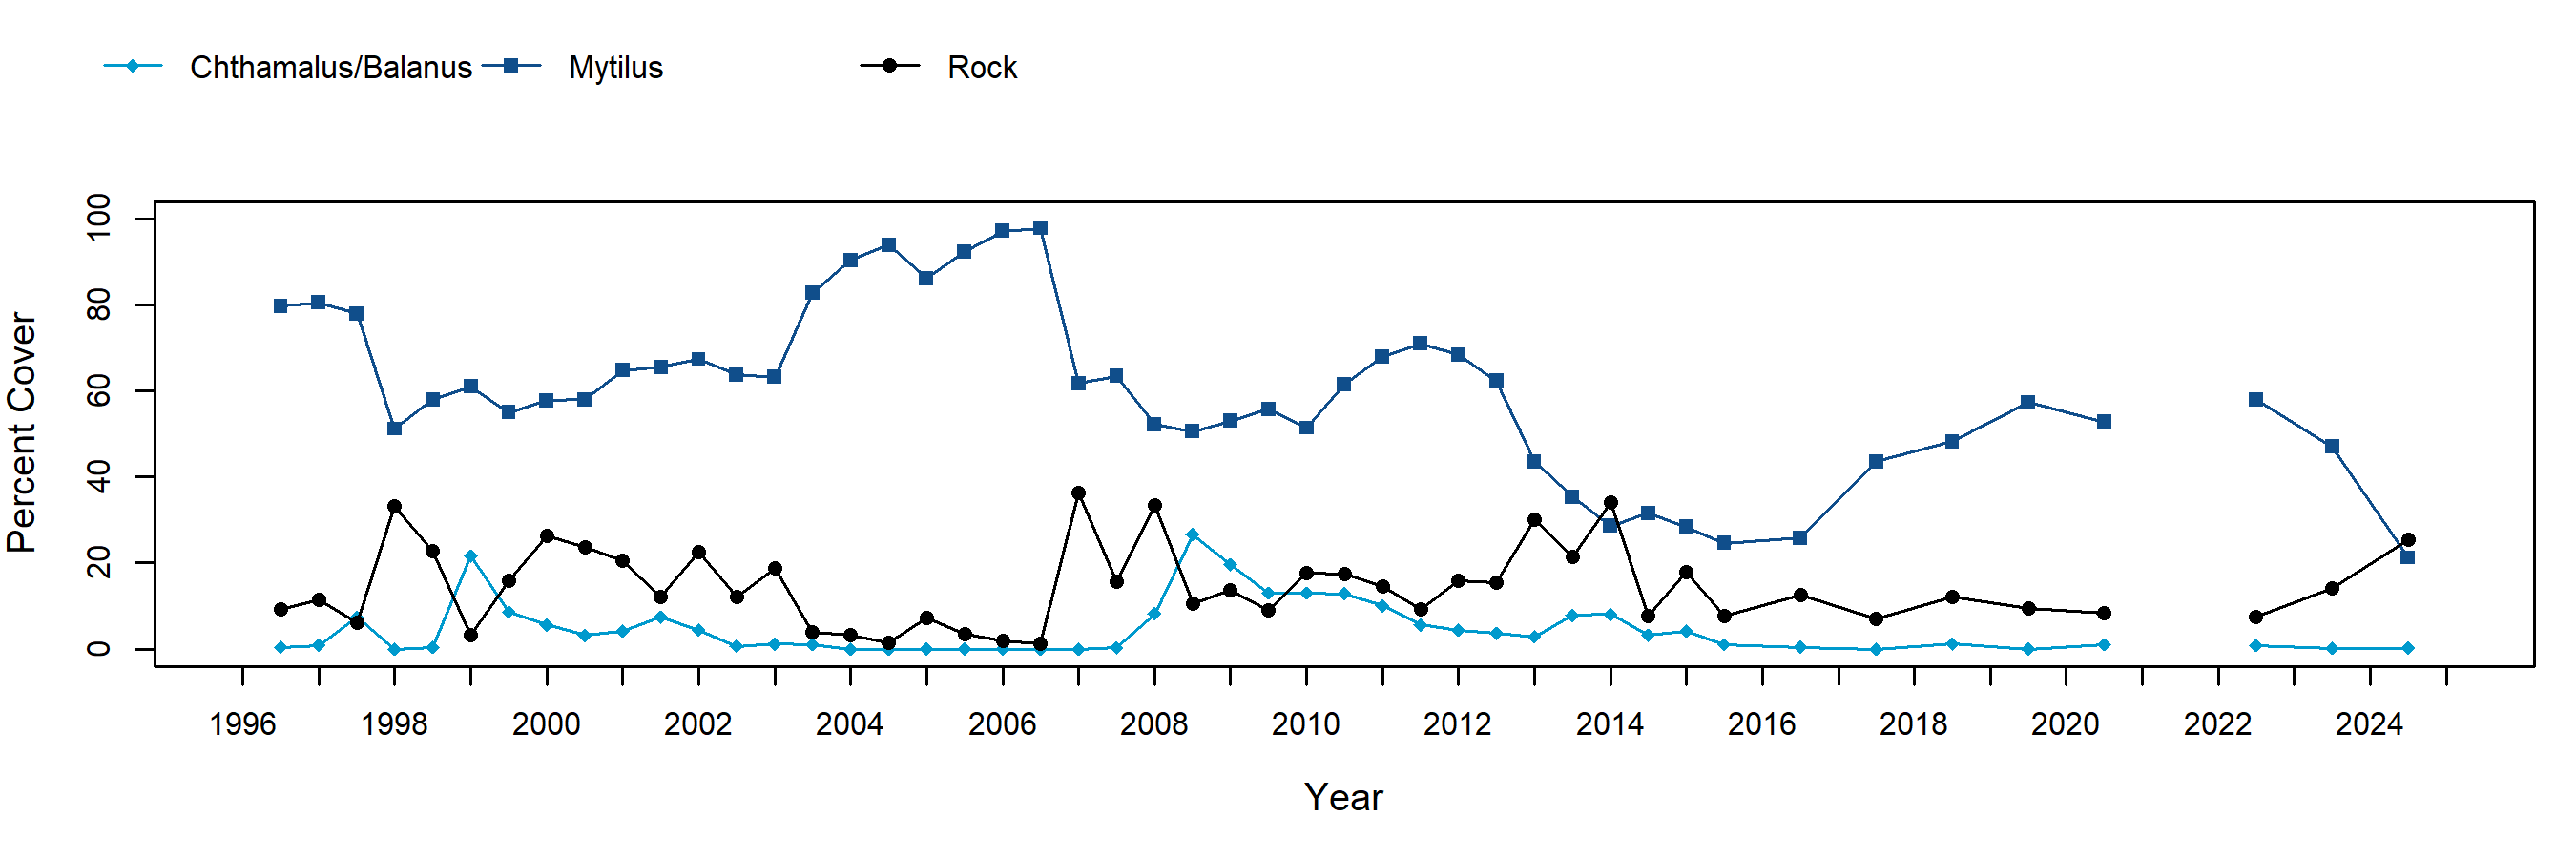
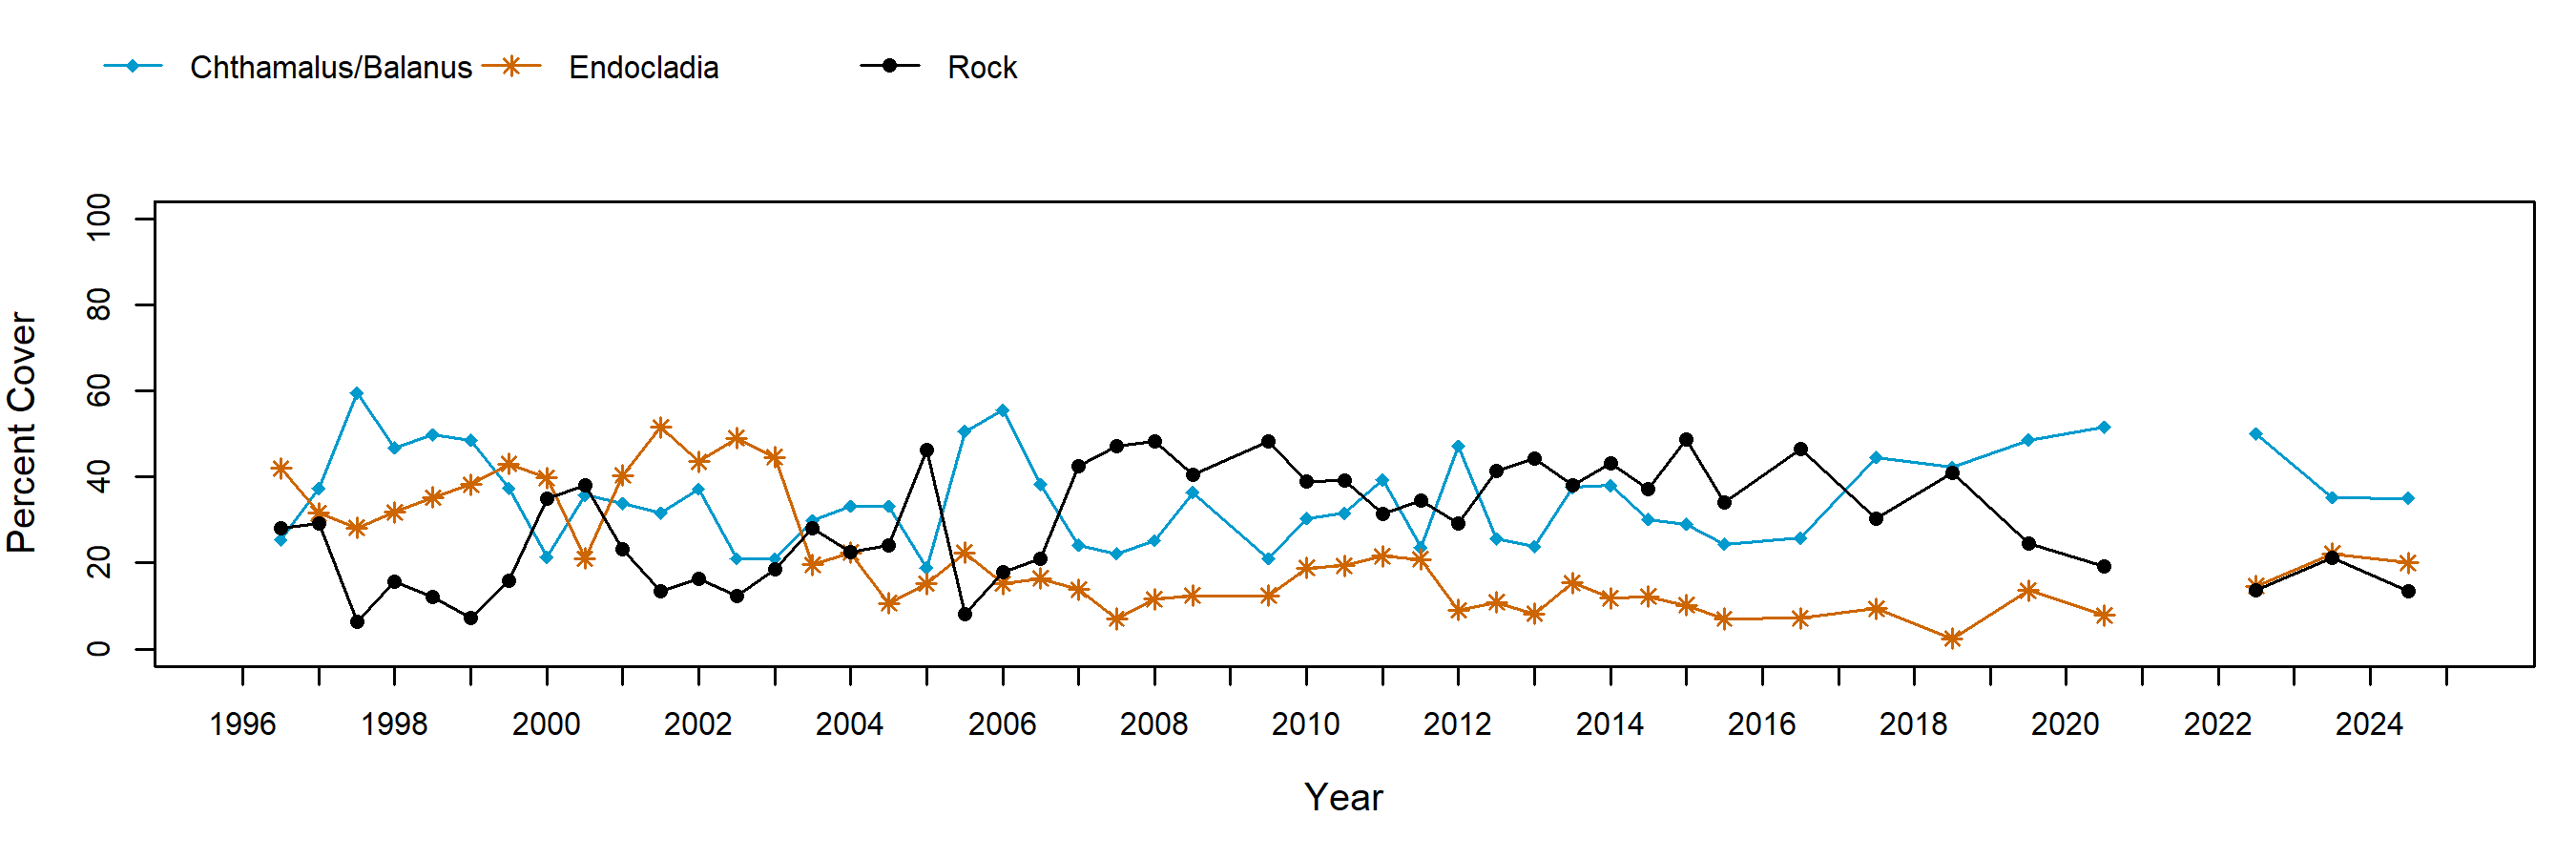
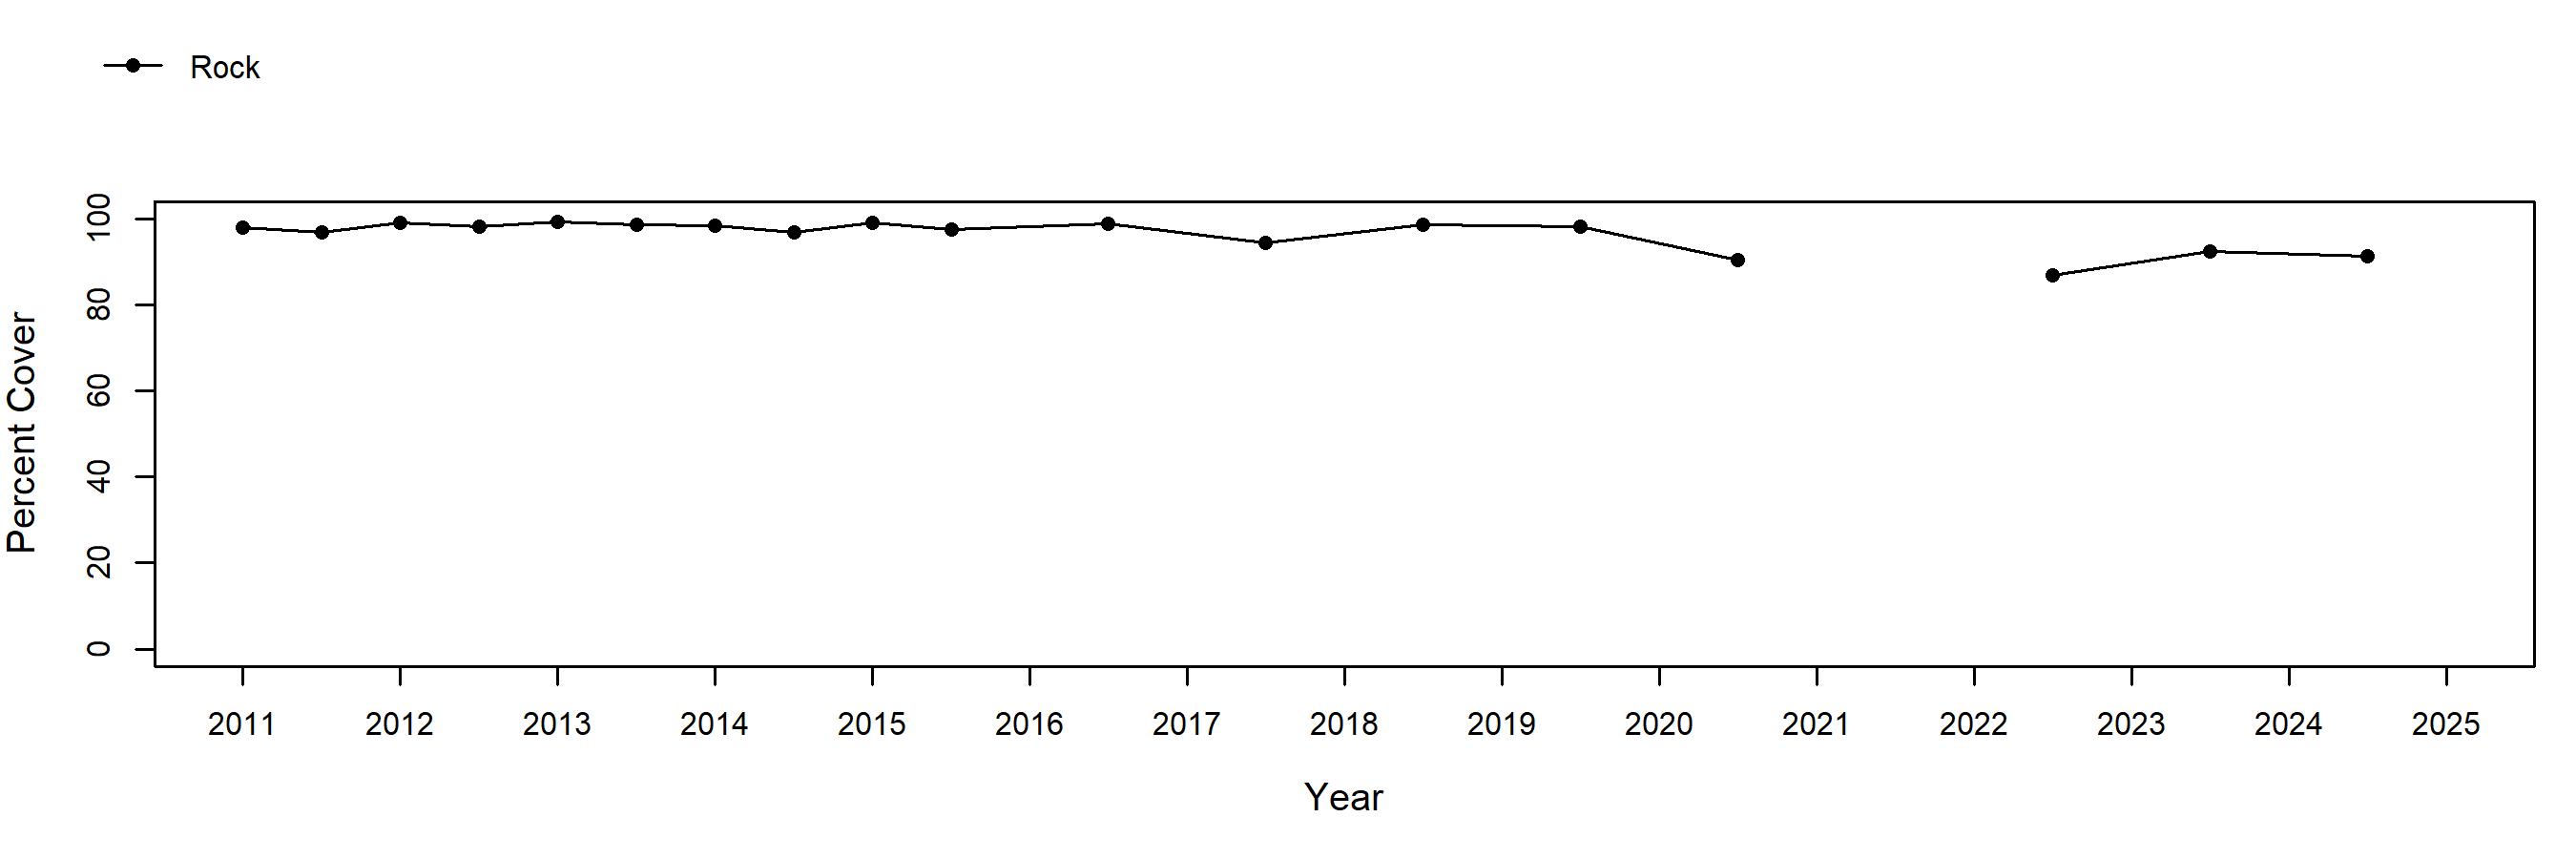
Barnacle cover in plots at Shaws Cove has exhibited a general decline since initiation of monitoring in 1996. Mussel cover was high from the establishment of permanent Mytilus plots in 1996 through fall 1997, and has since fluctuated over time. Declines have apparently often been driven by storm and El Niño events. In motile invertebrate surveys in mussel plots, the abundance of limpets demonstrated a clear seasonal pattern, with higher numbers present in plots in fall surveys than in spring surveys (note that spring surveys were discontinued after 2011). Rockweeds in plots at Shaws Cove exhibited variations in cover within and across years with a pattern of generally higher cover in the fall than in the spring sampling periods (note that spring sampling ended in 2016). Abundance of the red alga Endocladia (turfweed) has varied greatly in plots at Shaws Cove since initiation of monitoring in 1996. Cover of Endocladia dropped dramatically in 2003, potentially due to a bleaching event, and has remained relatively low ever since. Rock plots were established at this site in fall 2011 in areas above the barnacle zone. In general, the cover of these plots has consisted almost entirely of bare rock.
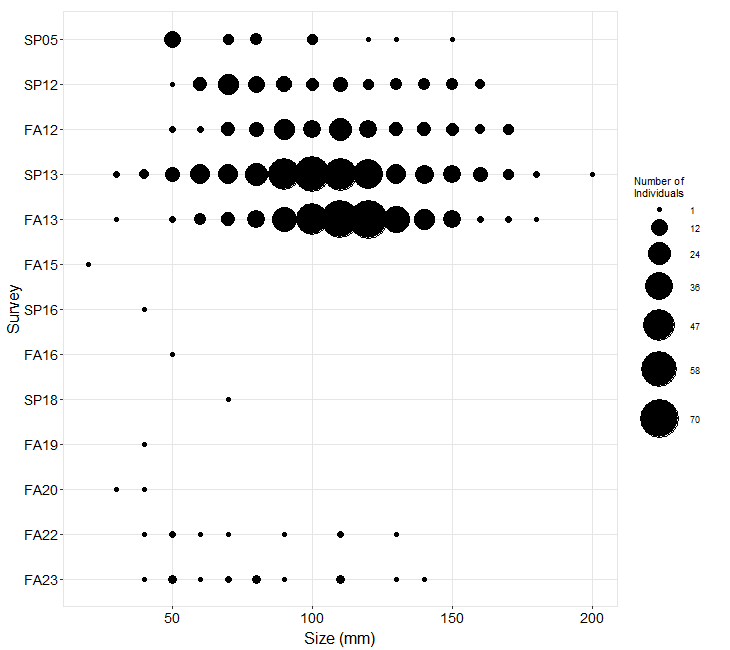
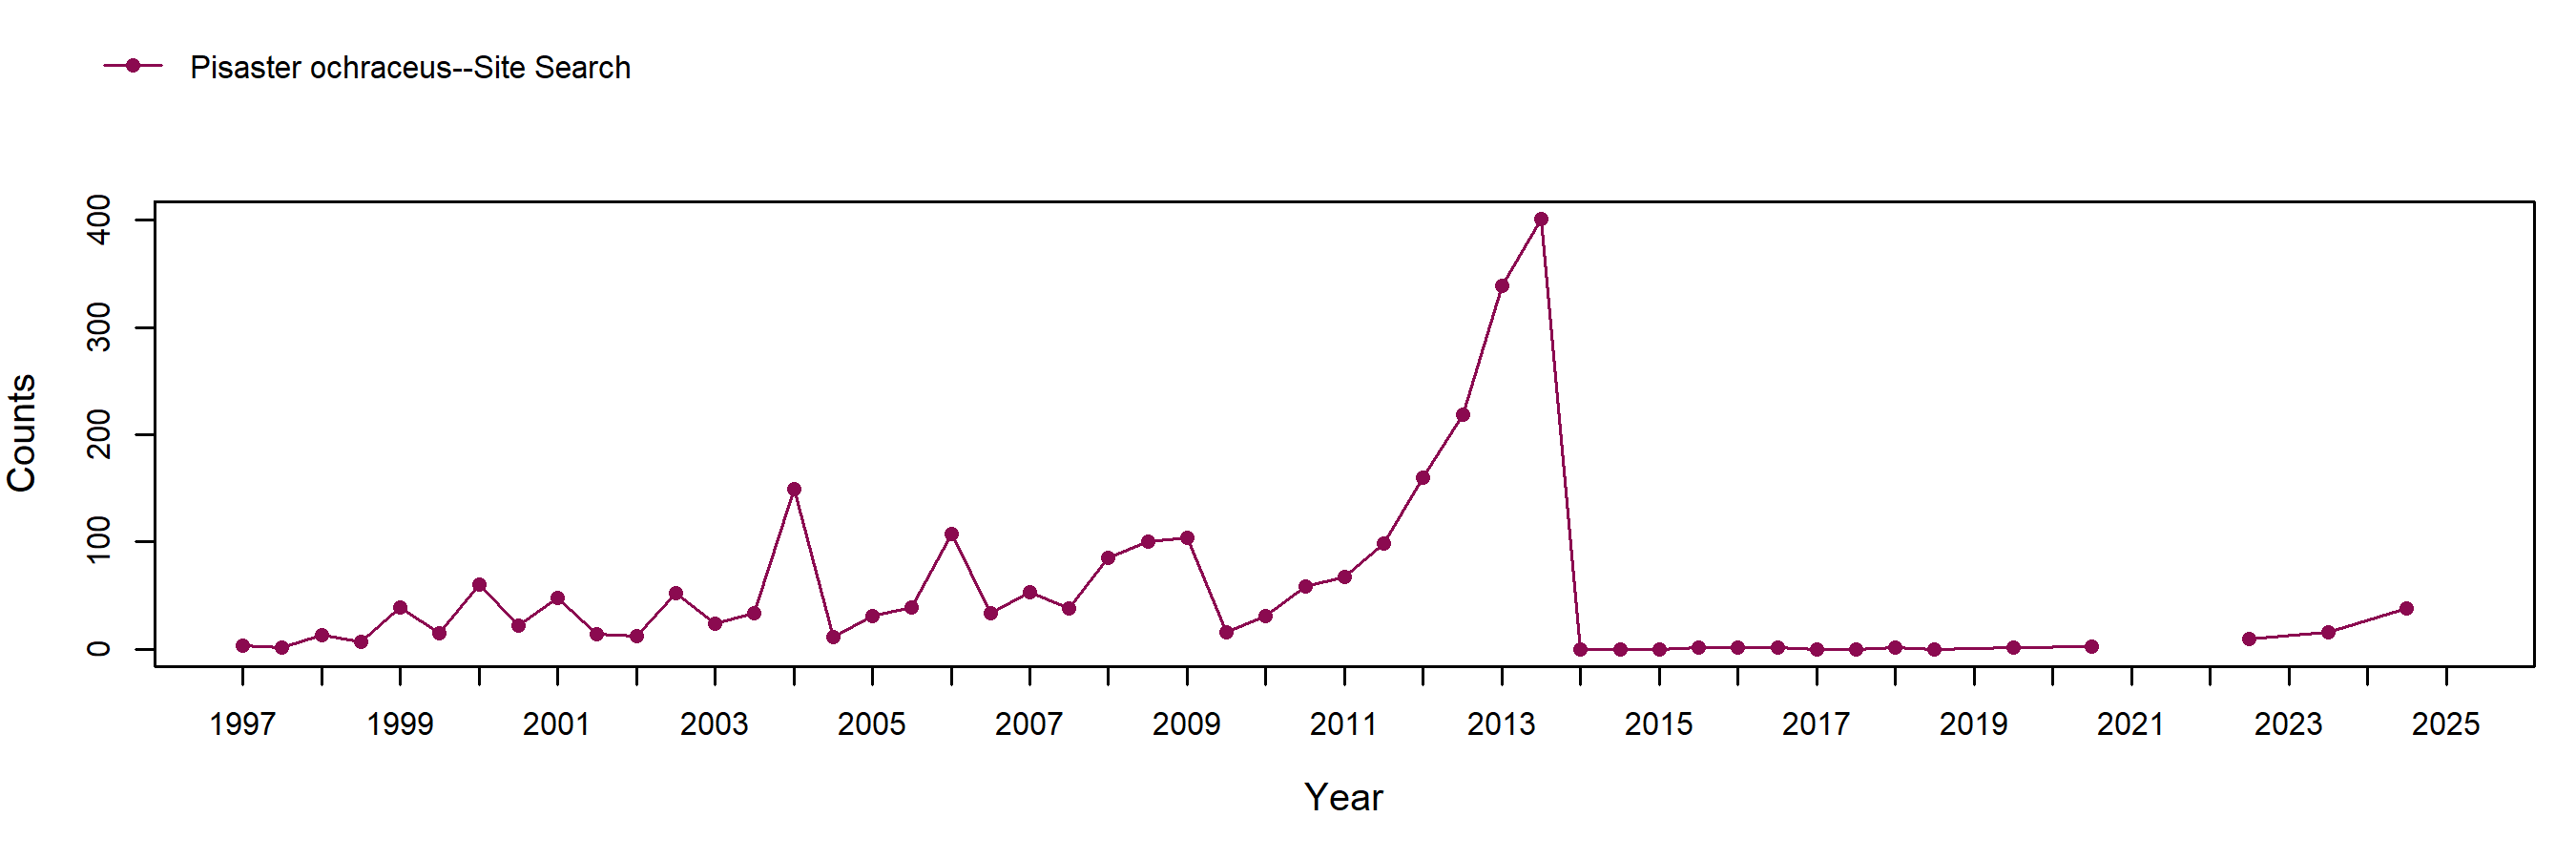
At Shaws Cove, sea stars are counted in site-wide surveys. For most of the sampling period, counts never exceeded 100 individuals per survey. Increasing numbers of sea stars were encountered at the site between 2010 and 2012, with more dramatic increases noted in late 2012 and early 2013. Approximately 400 sea stars were counted at the site in fall 2013, the highest number ever recorded here. No signs of Sea Star Wasting Syndrome were noted during this survey, although symptoms were observed in sea stars at nearby Orange County sites a few days after the Shaws Cove survey had been completed. In spring 2014, no Pisaster were observed at this site, and Sea Star Wasting Syndrome is a likely contributor to this sharp decline. No more than 1 individual was encountered in any single survey up until fall 2020, at which point a slight recovery in numbers began. From 2012 (when size measurements were started) through 2014, the population of Pisaster at Shaws Cove included individuals of a wide range of sizes, with most individuals measuring between 80 to 130 mm. Only small individuals (< 80 mm) were encountered from fall 2015 to fall 2019, but individuals up to 140 mm have been observed in more recent surveys.
In order to standardize species resolution across all MARINe groups and over time, some species (typically rare) were lumped for graphical presentation of Long-Term monitoring data. See lumped categories for definitions (some variation occurs between methods and over time).
If you experience any barriers accessing the trend graphs below, please contact (pacificr@ucsc.edu) for help.
Photo Plots

Below are the trends observed for each Photo Plot target species at this site. Long-Term percent cover trend graphs also include any species that reached a minimum of 25% cover during any single point in time within a given target species assemblage. Breaks in trend lines represent missed sampling events. For additional species observed that did not meet this 25% threshold, please use the Graphing Tool.
Chthamalus/Balanus (Acorn Barnacles) – percent cover
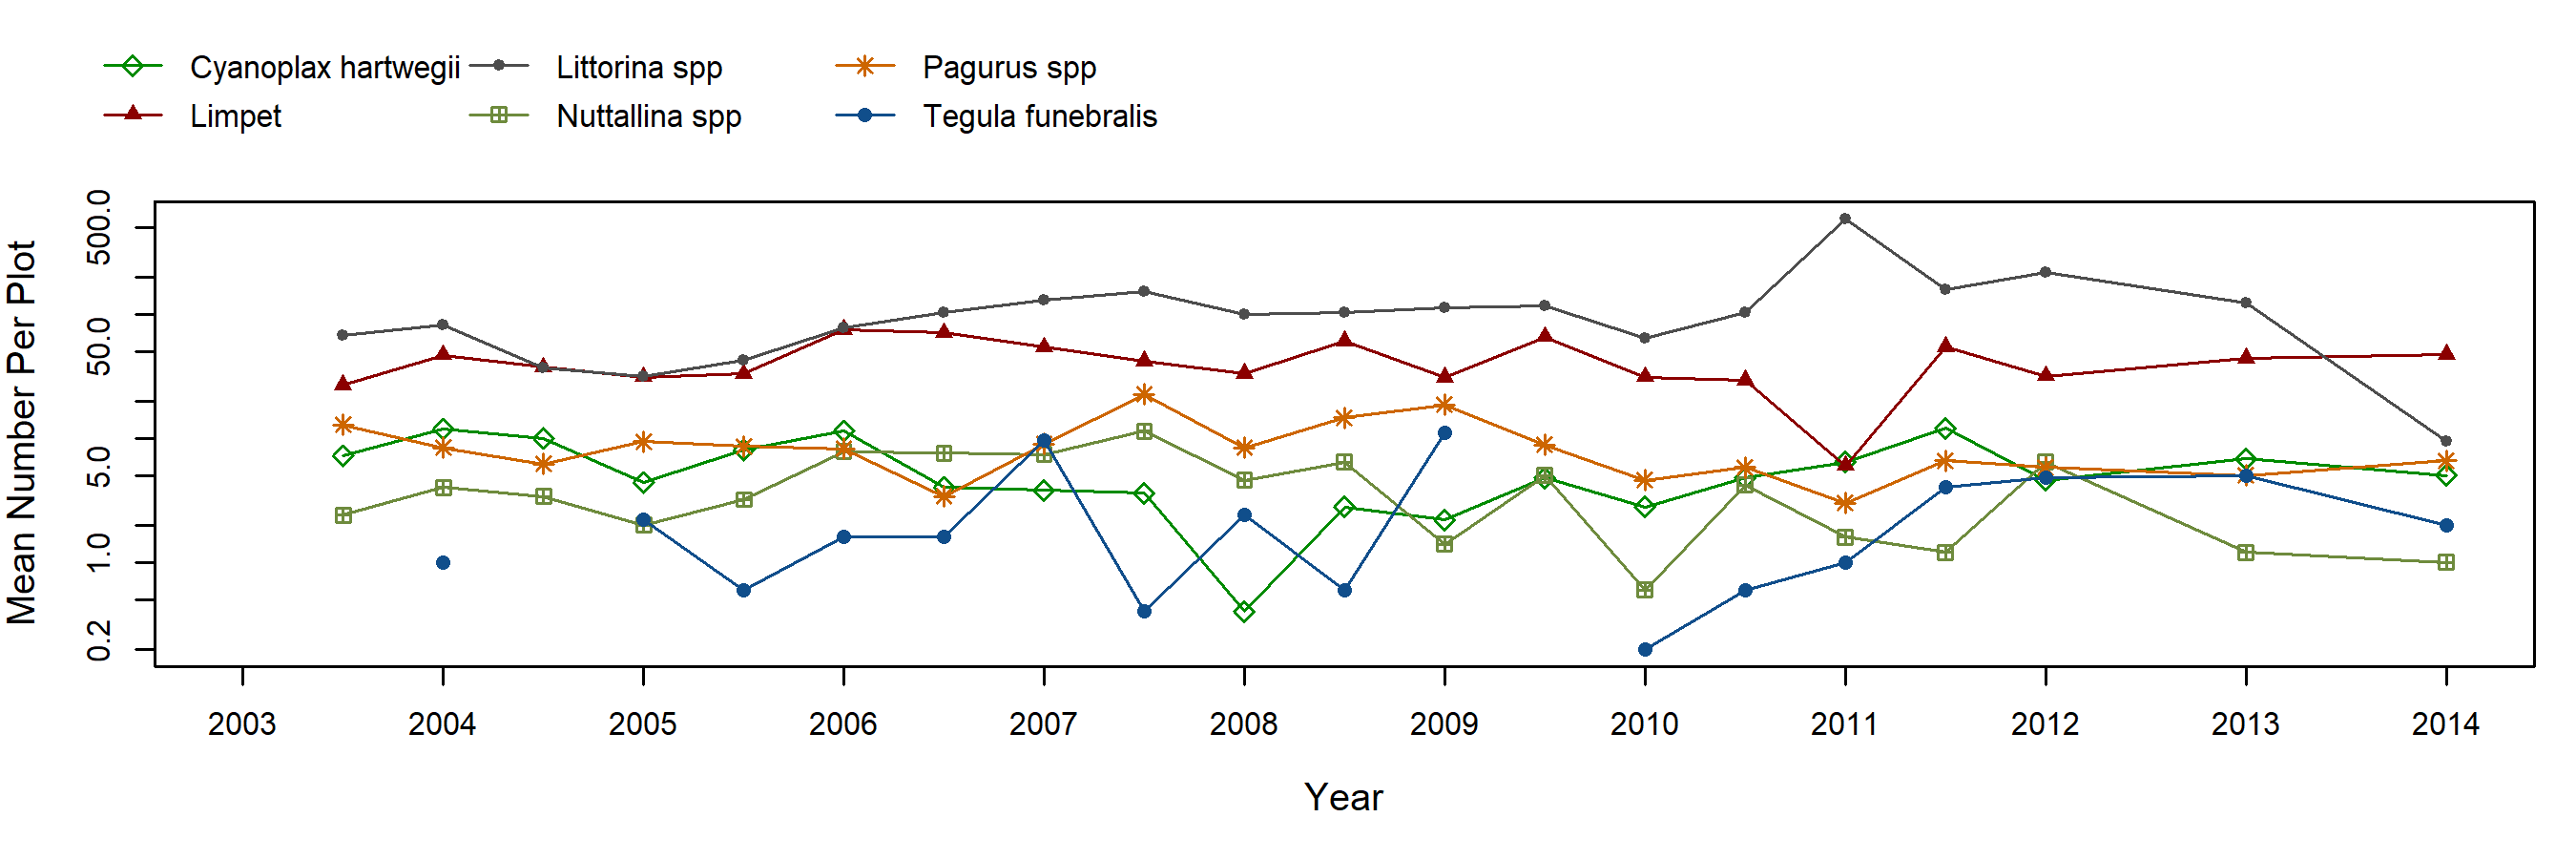
Chthamalus/Balanus (Acorn Barnacles) – motile invertebrate counts
Mytilus (California Mussel) – percent cover
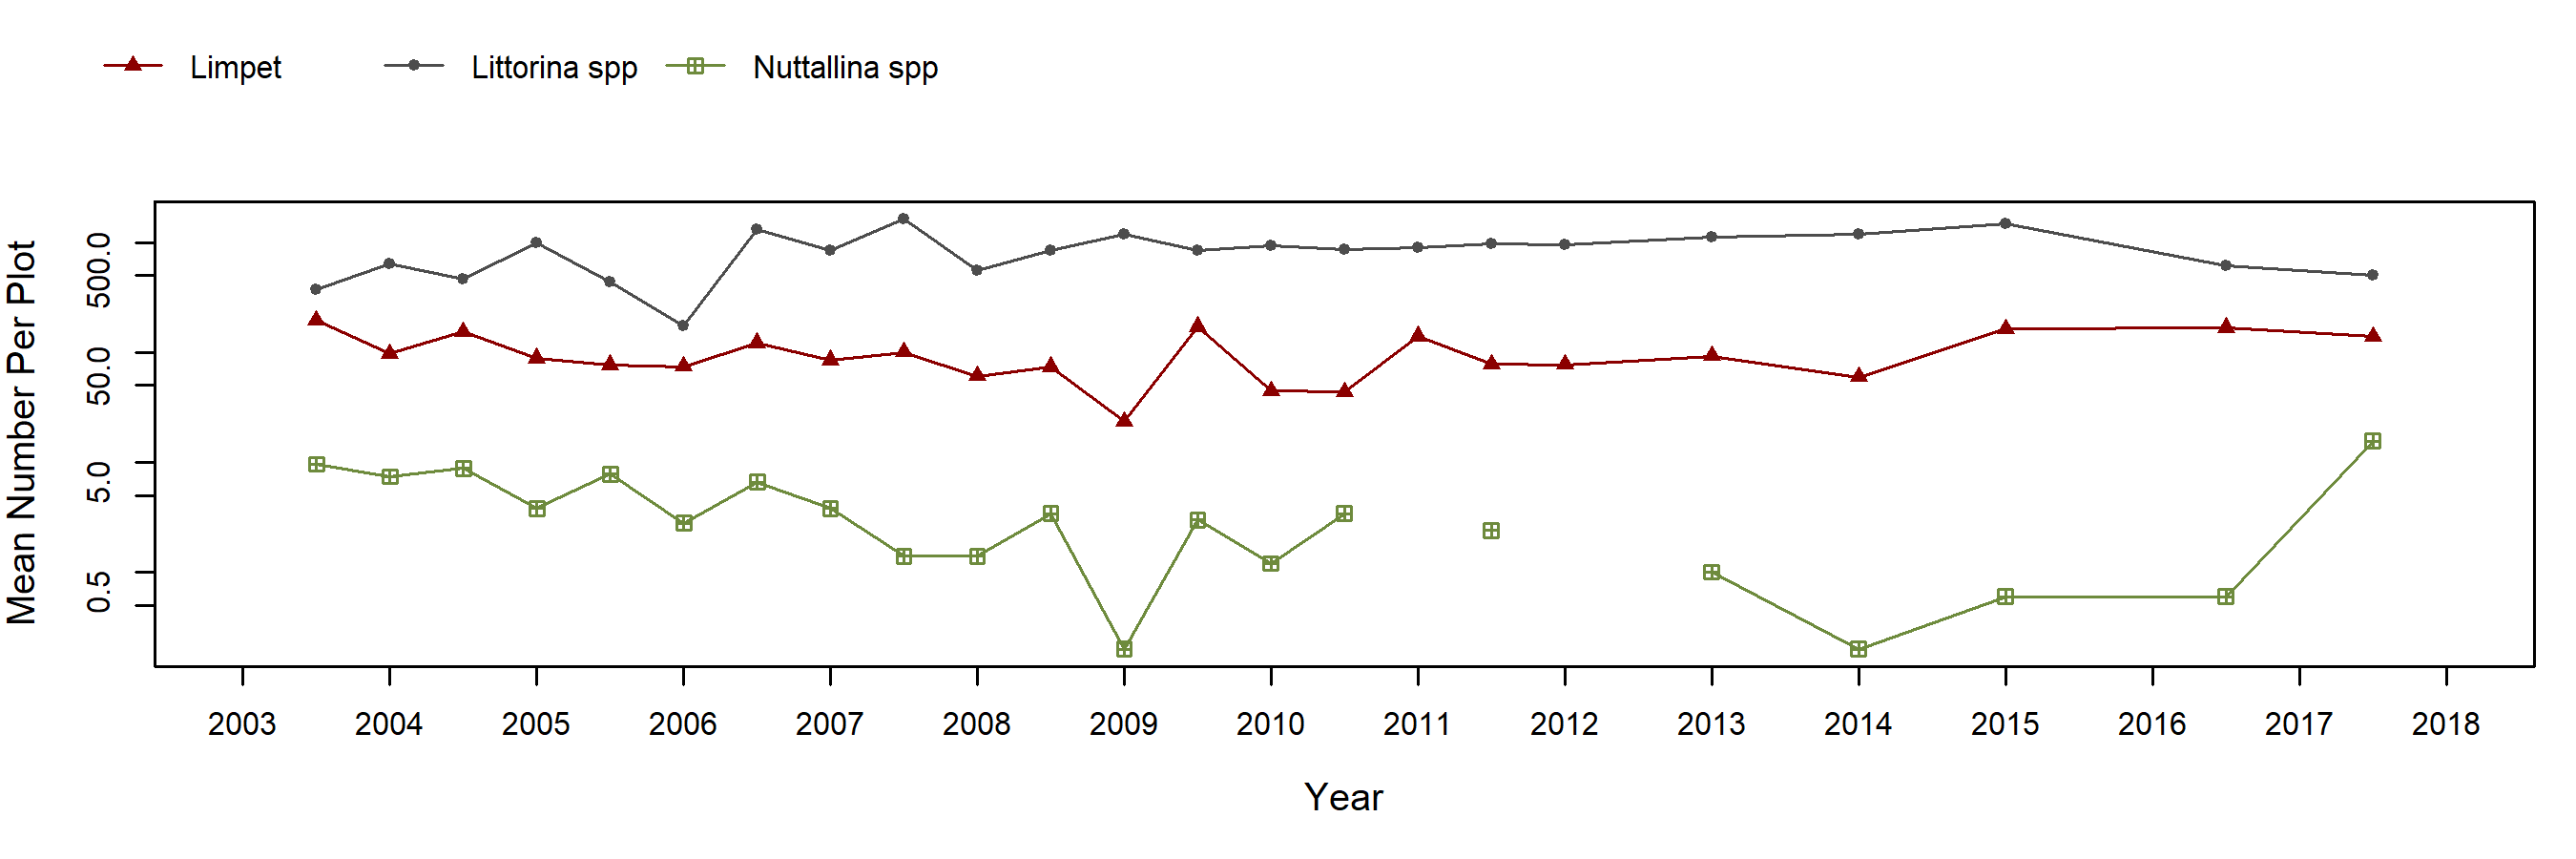
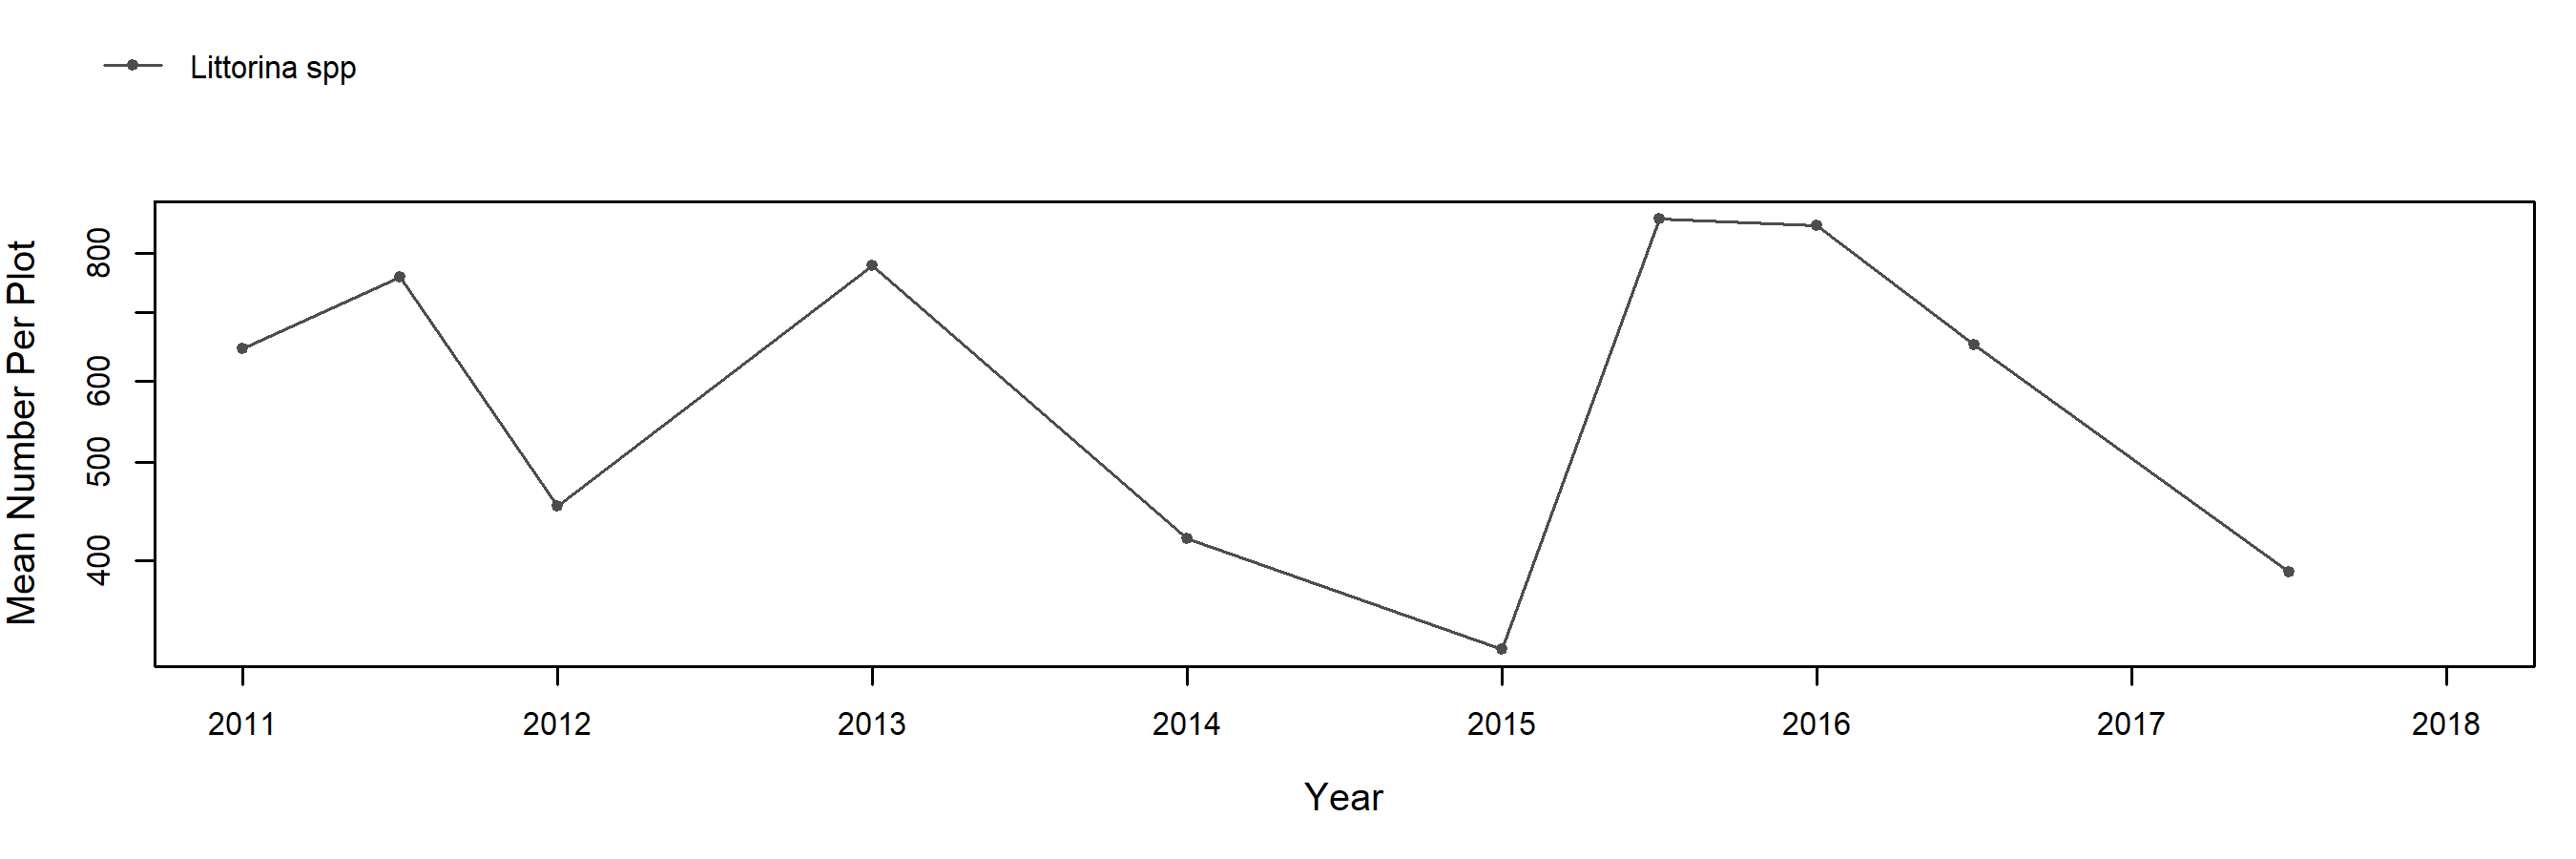
Mytilus (California Mussel) – motile invertebrate counts
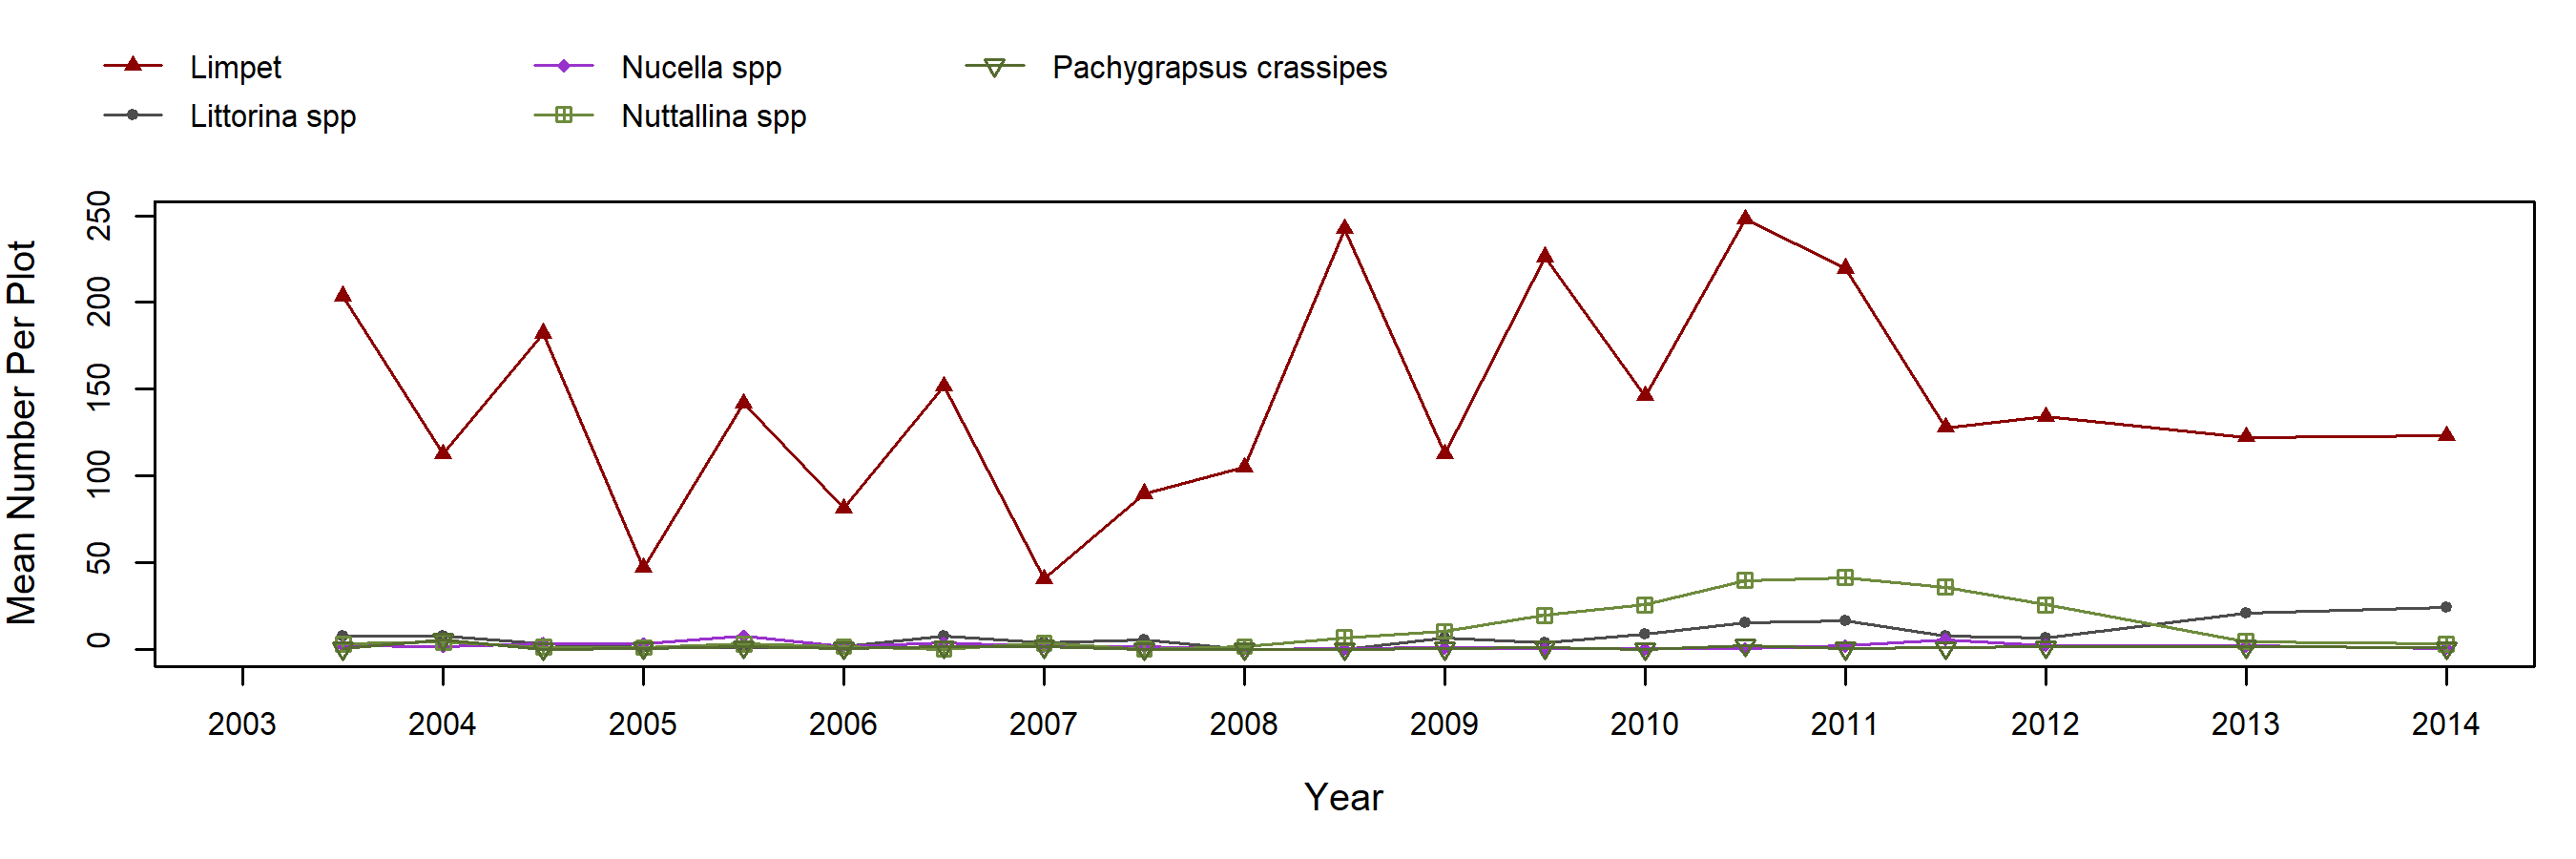
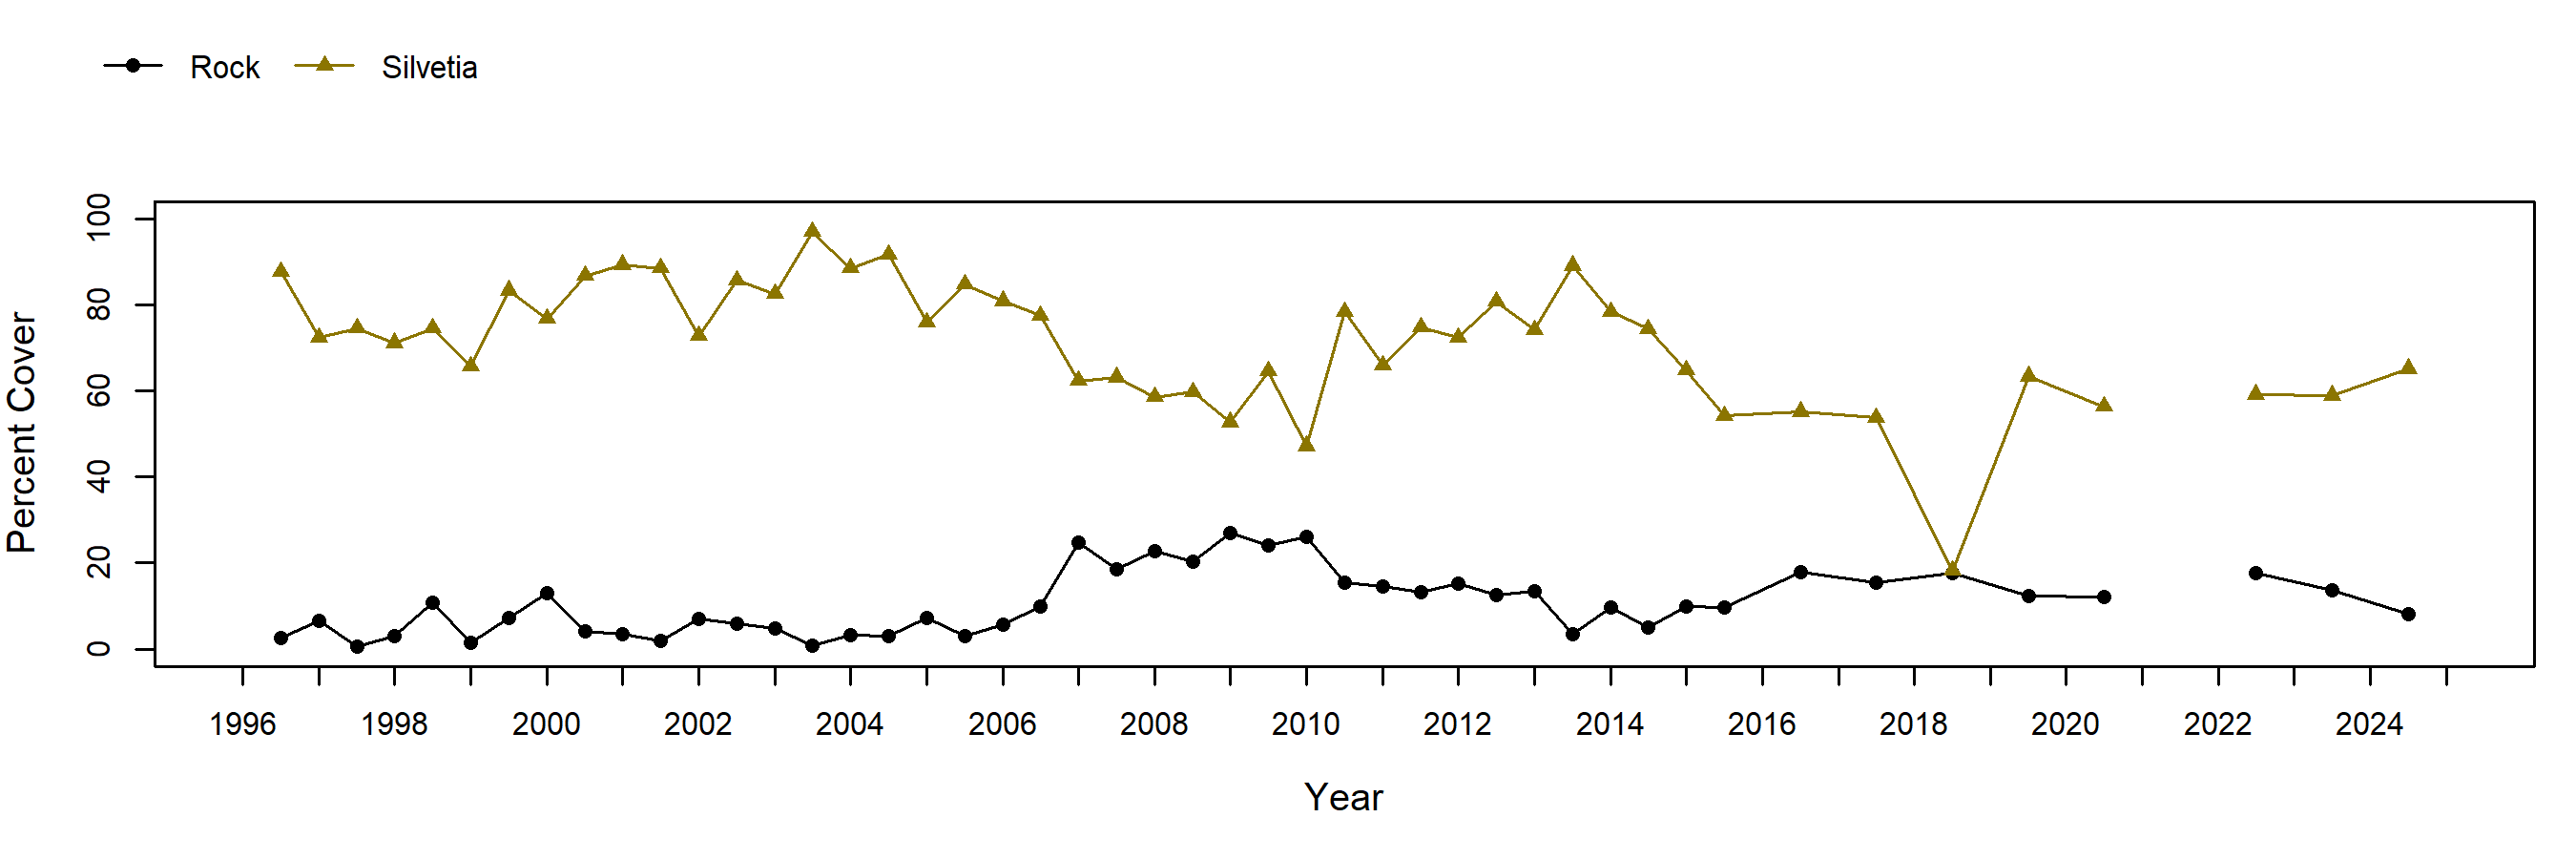
Silvetia (Golden Rockweed) – percent cover
Silvetia (Golden Rockweed) – motile invertebrate counts
Endocladia (Turfweed) – percent cover
Endocladia (Turfweed) – motile invertebrate counts
Rock (Above Barnacles) – percent cover
Rock (Above Barnacles) – motile invertebrate counts
Species Counts and Sizes

Species Counts and Sizes (where recorded) for Pisaster are shown below for this site. At some sites, other sea star species and Katharina are counted in addition to Pisaster. The sum of all individuals across all plots is displayed. Note that data gaps are represented by breaks in long-term count trend lines, but are not shown in size plots.
Pisaster ochraceus (Ochre Star) – counts
Pisaster ochraceus (Ochre Star) – sizes