Arroyo Hondo Long-Term trends | MARINe
Arroyo Hondo Long-Term trends
See below for trend graphs
In order to standardize species resolution across all MARINe groups, and over time, some species (typically rare) were lumped for graphical presentation of Long-Term monitoring data. See lumped categories for definitions (some variation occurs between methods and over time). Due to funding constraints, semi-annual sampling at this site was reduced to annual sampling (Fall only) beginning in 2019.
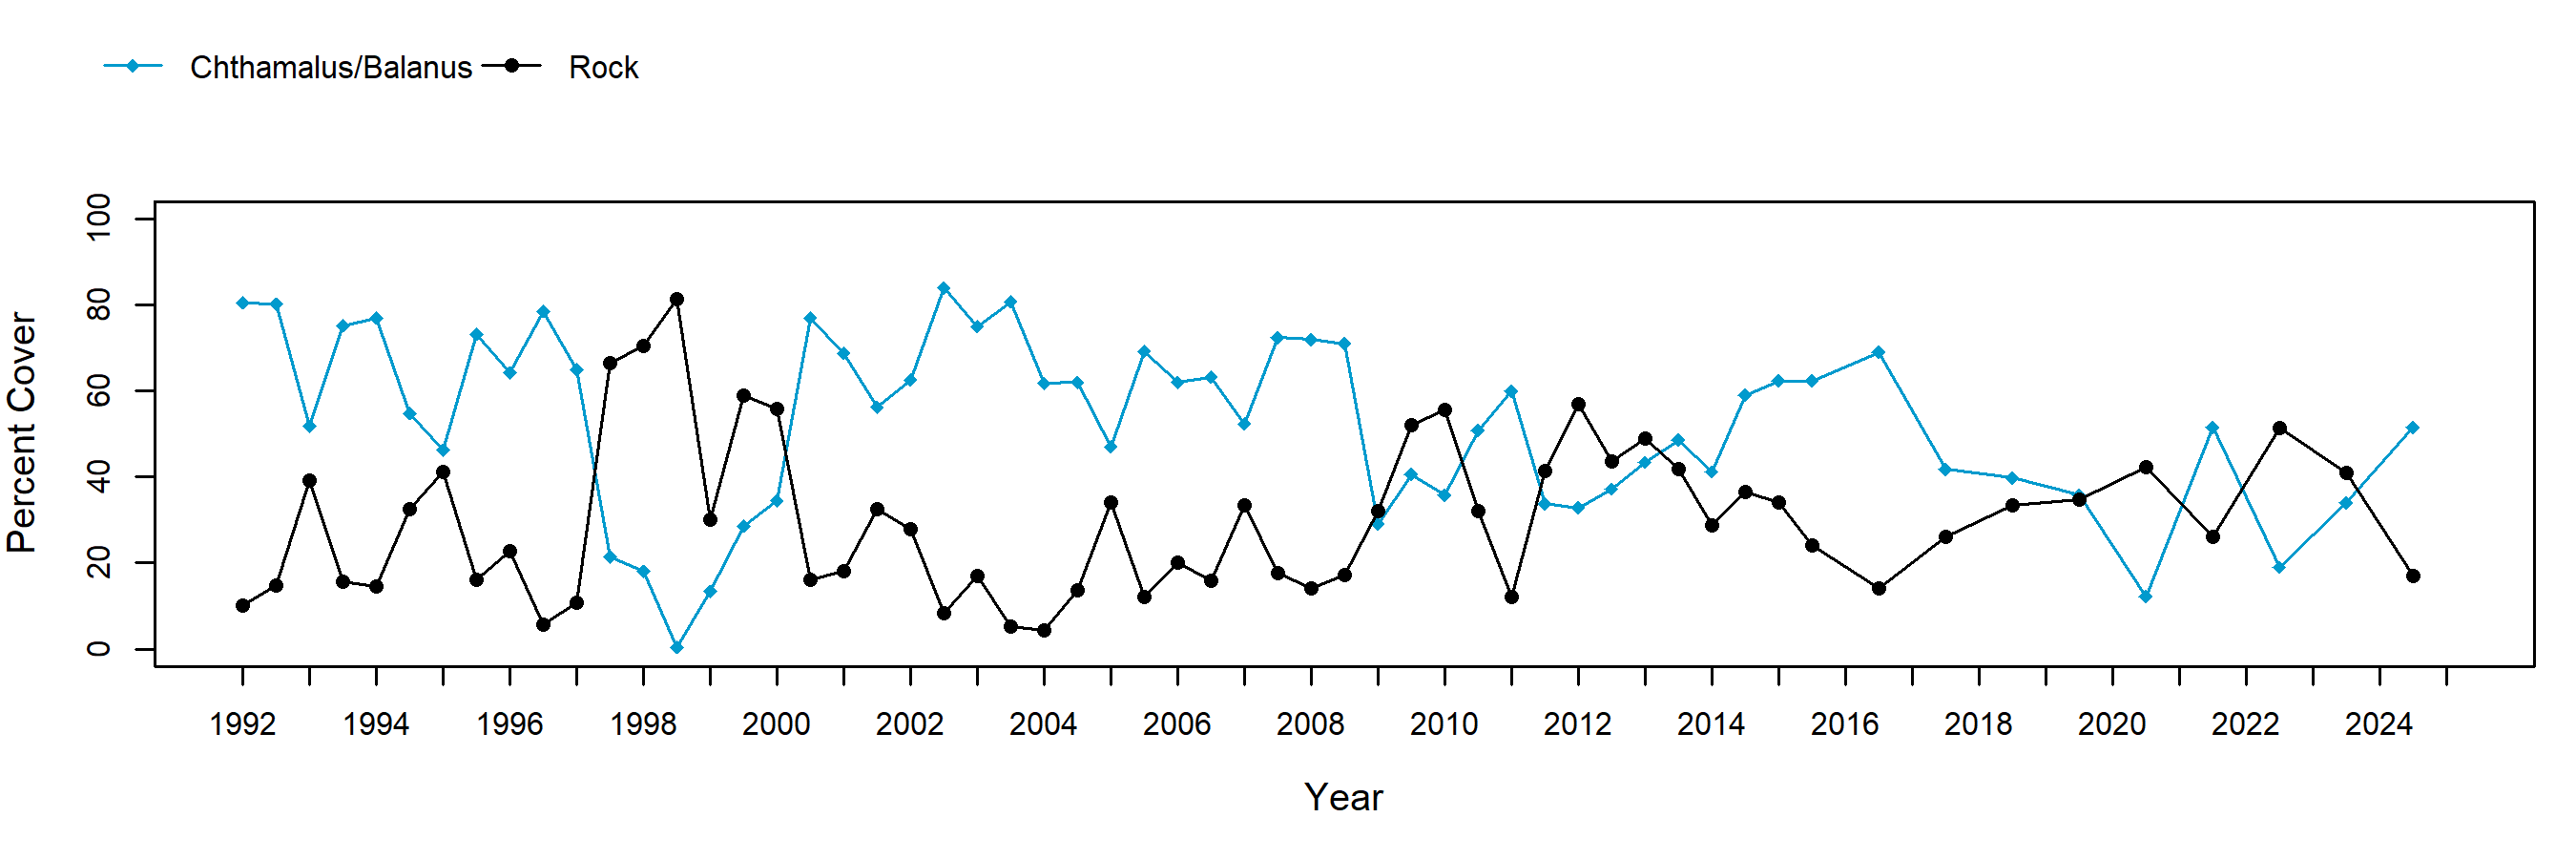
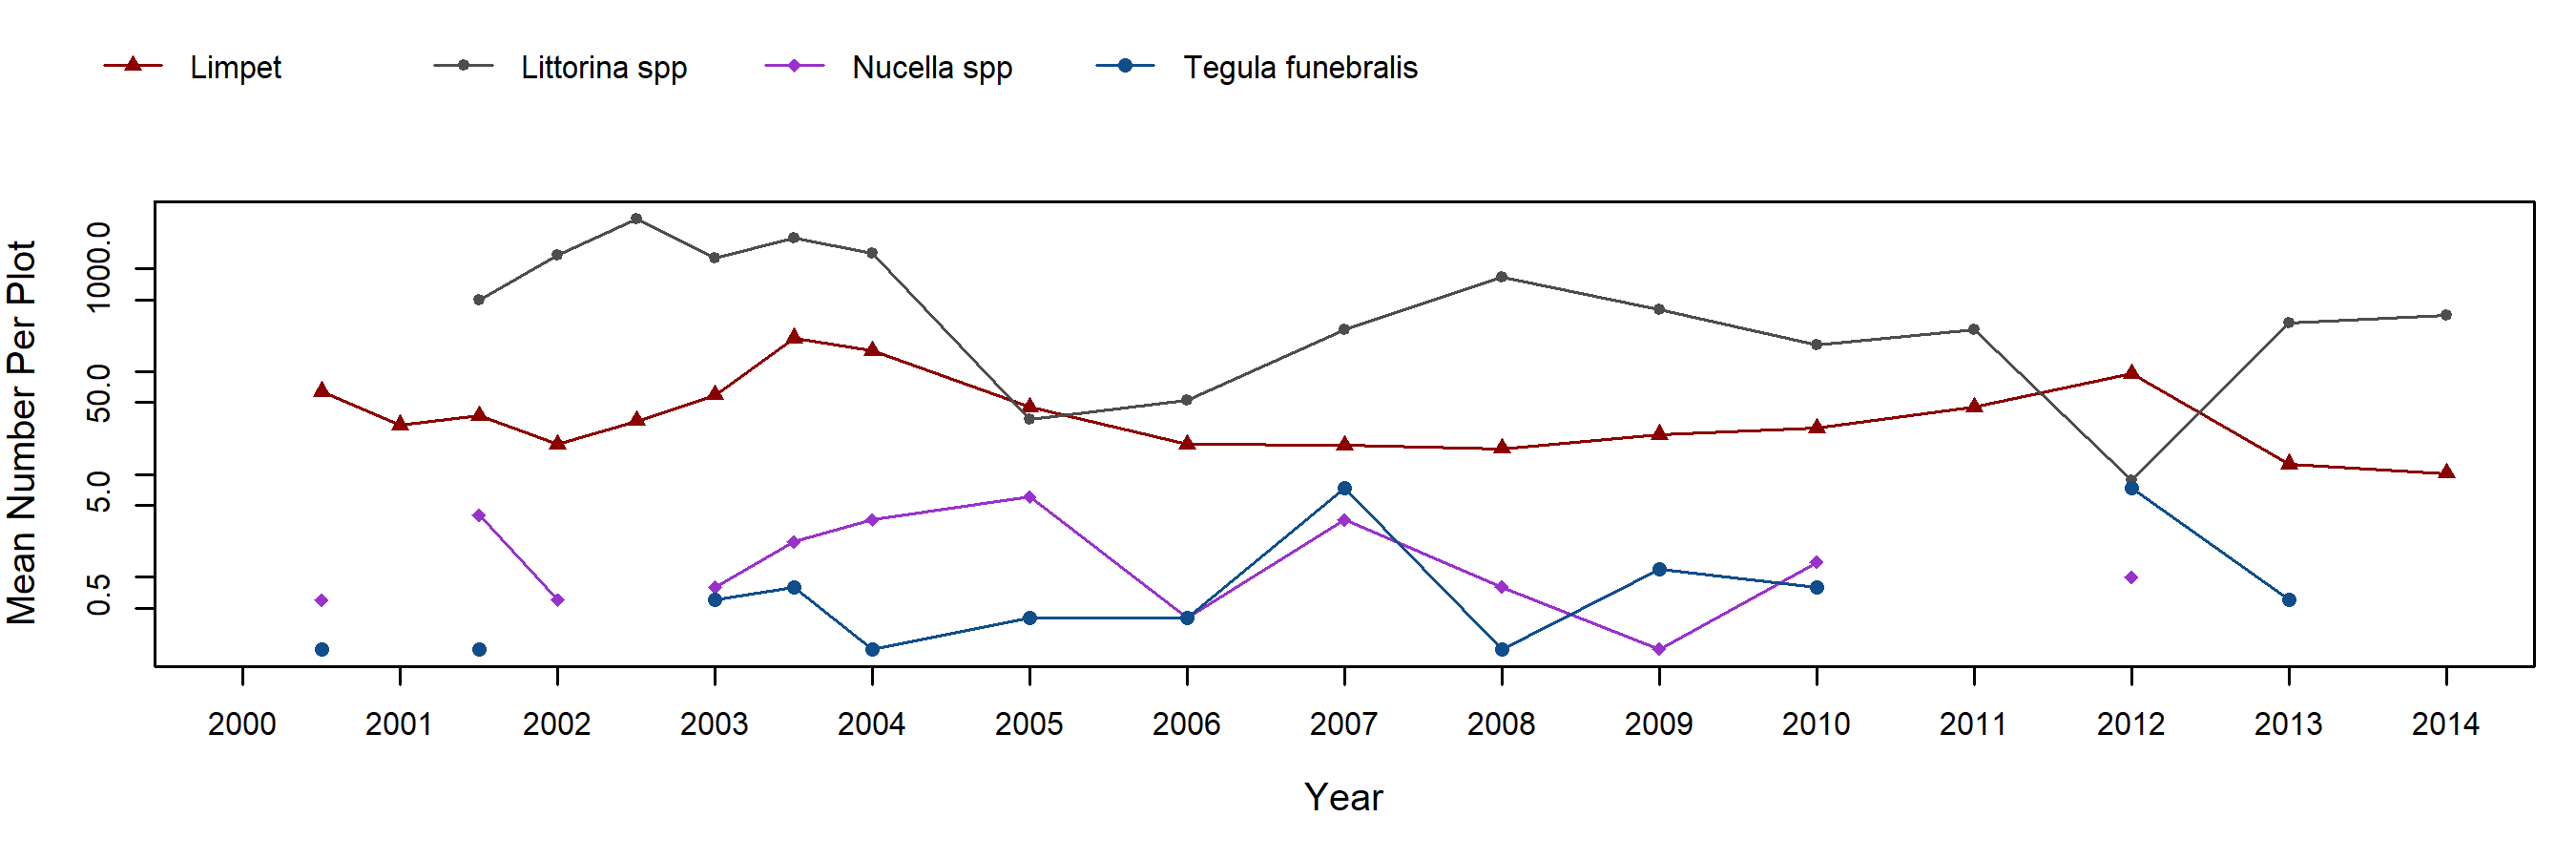
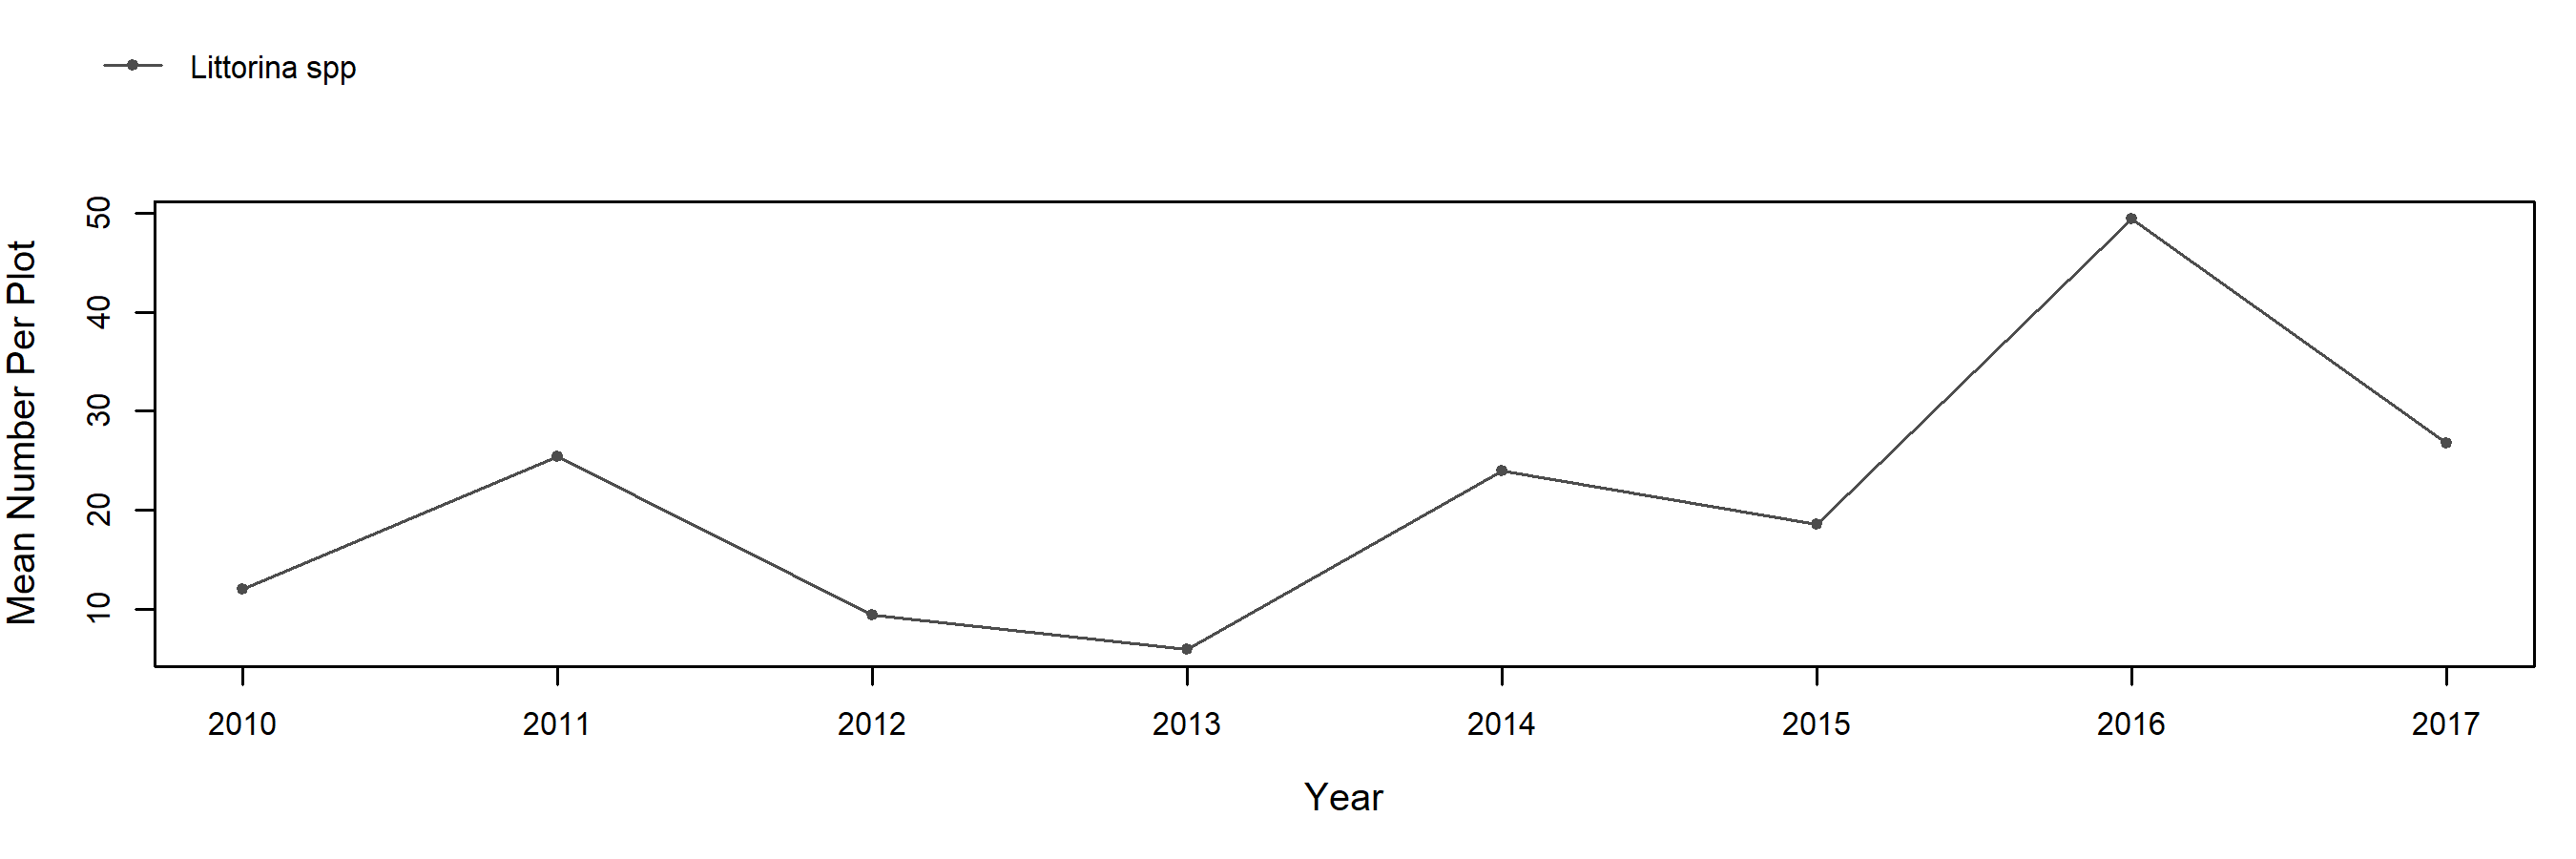
The barnacle plots at Arroyo Hondo consist of a mixture of Chthamalus dalli/fissus (note that species were not distinguished until 2001) and Balanus glandula. Two plots are located on a smooth, nearly vertical sandstone reef outcrop and consist almost completely of Chthamalus spp. barnacles, while the other three plots are on rougher, lower sloped outcrops and have approximately 25% relative cover of Balanus. Barnacle cover varied inversely with rock as periodic scour episodes have occurred. This scour has been especially pronounced in the two plots on smooth sandstone where near 100% barnacle removal has occurred several times. The other three plots are more stable and have been encroached upon to varying degrees by a mixture of Endocladia, mussels and anemones. Although drastic scour events have not been observed in recent years, barnacle cover has fallen consistently since 2016 to approximately 40% cover. Bare rock is present at roughly the same level indicating that competition with other species is not necessarily the limiting factor in recovery at this time. The average cover of these taxa has yet to meet the threshold for inclusion in the graphs. Motile invertebrate counts at this site began seasonally in the fall of 2000 and were changed to annual sampling in 2004. Within the barnacle plots, limpets and littorine numbers have remained high and reasonably steady throughout this time. Snails (Nucella spp. and Tegula funebralis) have been present in low numbers during most sampling events. Motile invertebrate counts in barnacle plots were discontinued in 2015.
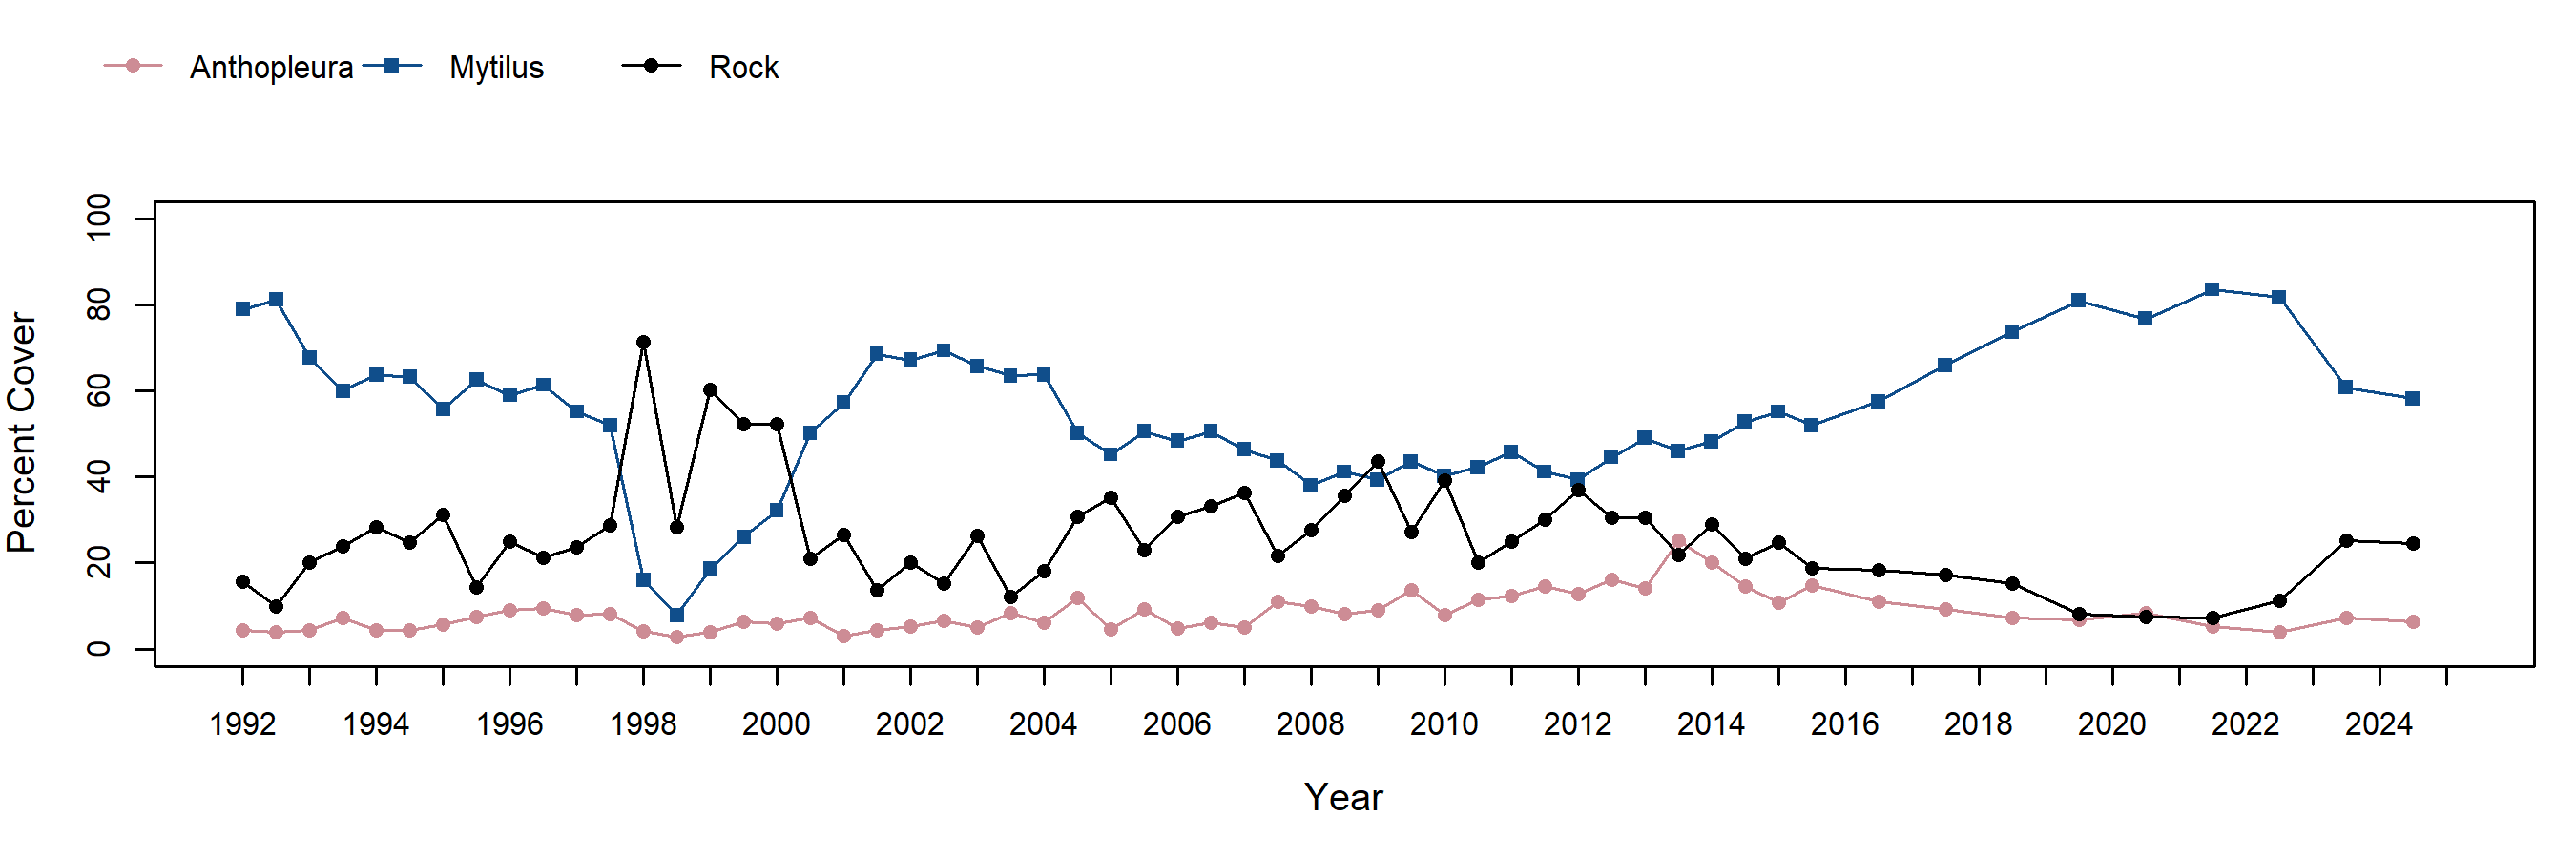
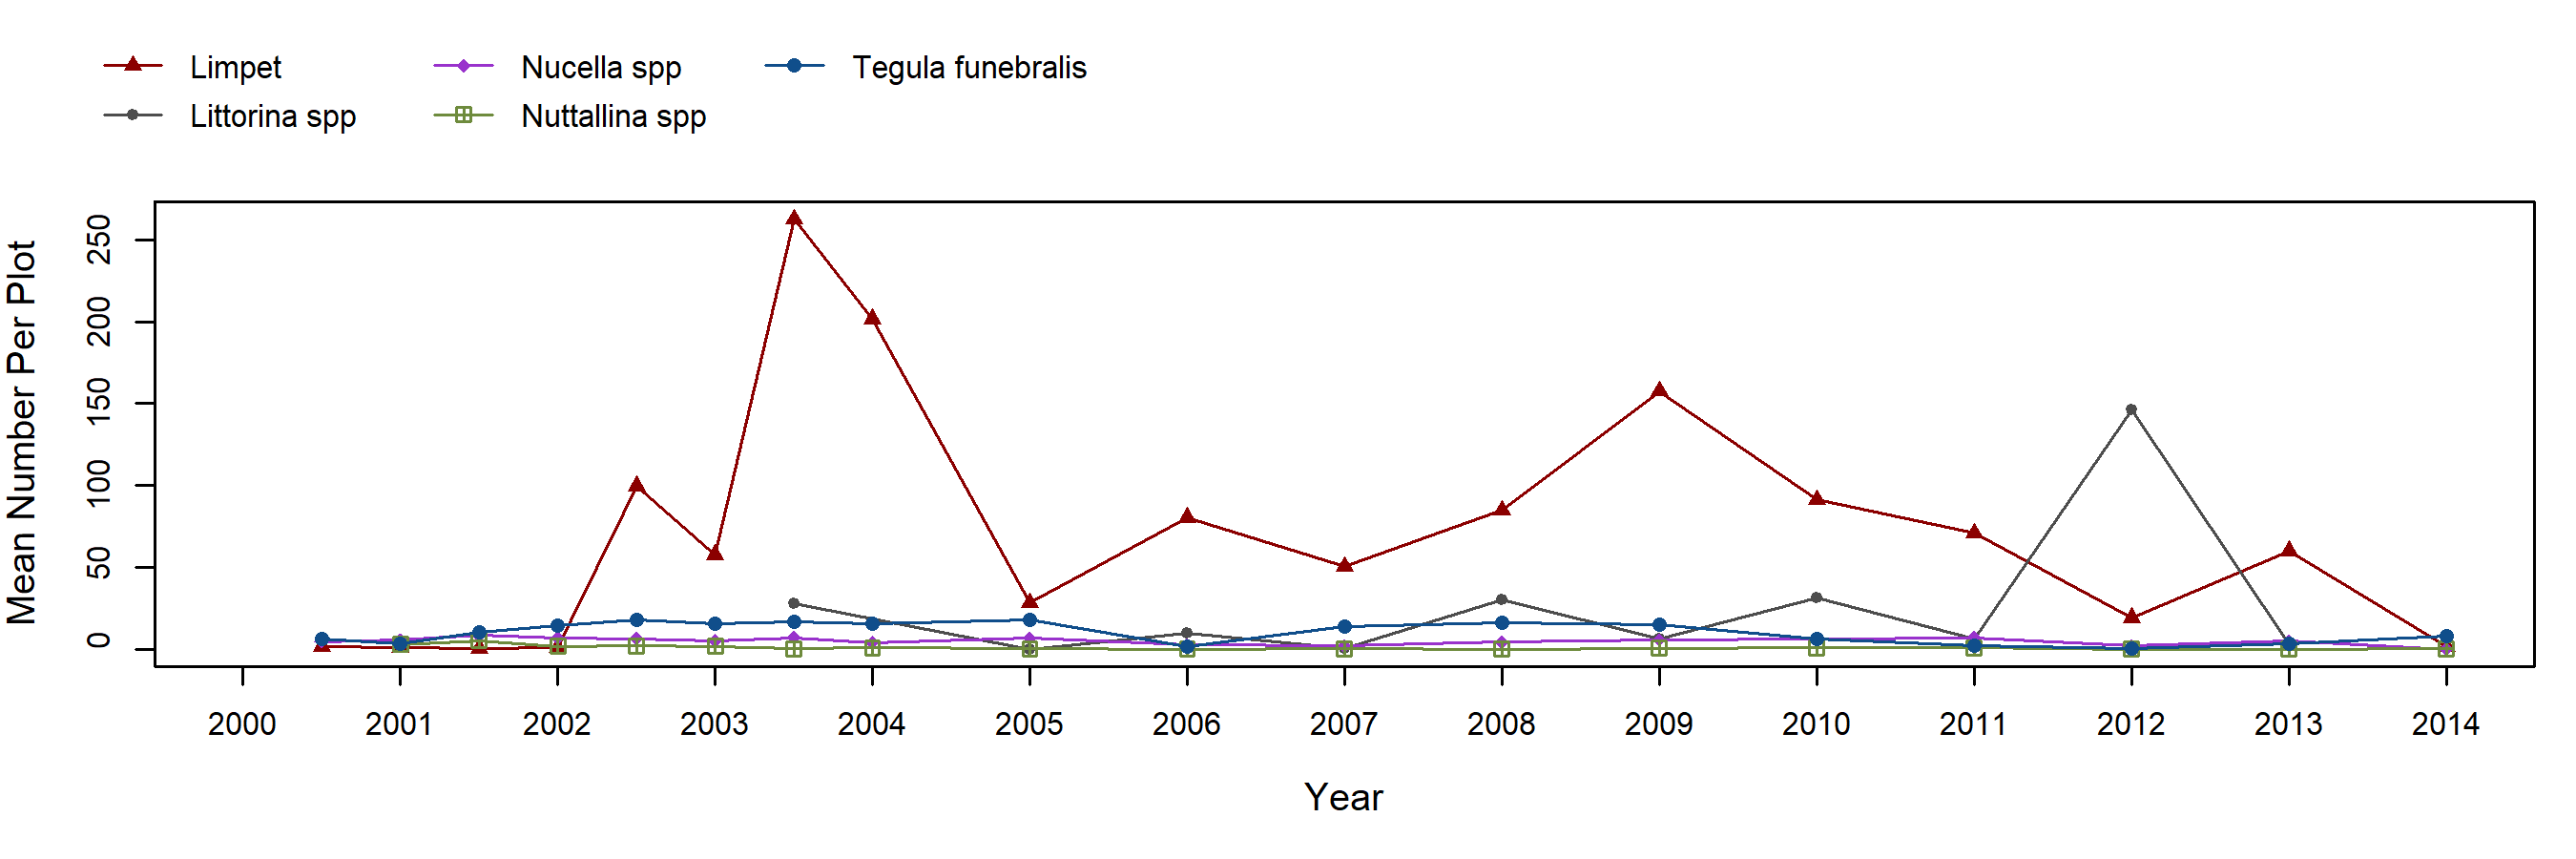
Mytilus cover in the mussel plots began around 80% on average in 1992, declined gradually to under 60% through 1997, then declined precipitously to about 10% by fall 1998. After that mussel cover rebounded to about 70% by 2002 where it remained for several sampling seasons. Both the decline of the late 1990s and the 2002 recovery were represented by all five mussel photoplots. In 2005, one plot, plot 2, dropped to near zero mussel cover, with clonal anemones becoming the primary space occupier. This resulted in combined cover values declining to near 50%. All five plots remained very consistent for the next decade. Within the last five years, mussels in plot 2 have recovered to roughly 50% cover, driving the combined value back up to the historical high level observed at the installation of these plots. As with the barnacle plots, motile invertebrate counts within the mussel plots began seasonally in fall 2000 and were changed to annual sampling in 2004. Within the mussel plots, limpets numbers have exhibited moderate fluctuations with mean numbers ranging from near zero to over 250 per plot. These fluctuations are the result of recruitment pulses of small (<5mm) limpets. The factors contributing to these pulses, and the fate of these individuals through time, is not clear. Aside from limpets, littorines and other snails (Nucella spp. and Tegula funebralis) are typically found in the plots in low numbers and chitons (Nutallina spp.) are found occasionally. Littorines have been encountered more frequently in recent seasons, though it should be pointed out that these were not consistently sampled in the mussel plots prior to 2006. Littorine sampling ceased in 2014. Motile invertebrate counts in mussel plots were discontinued in 2015.
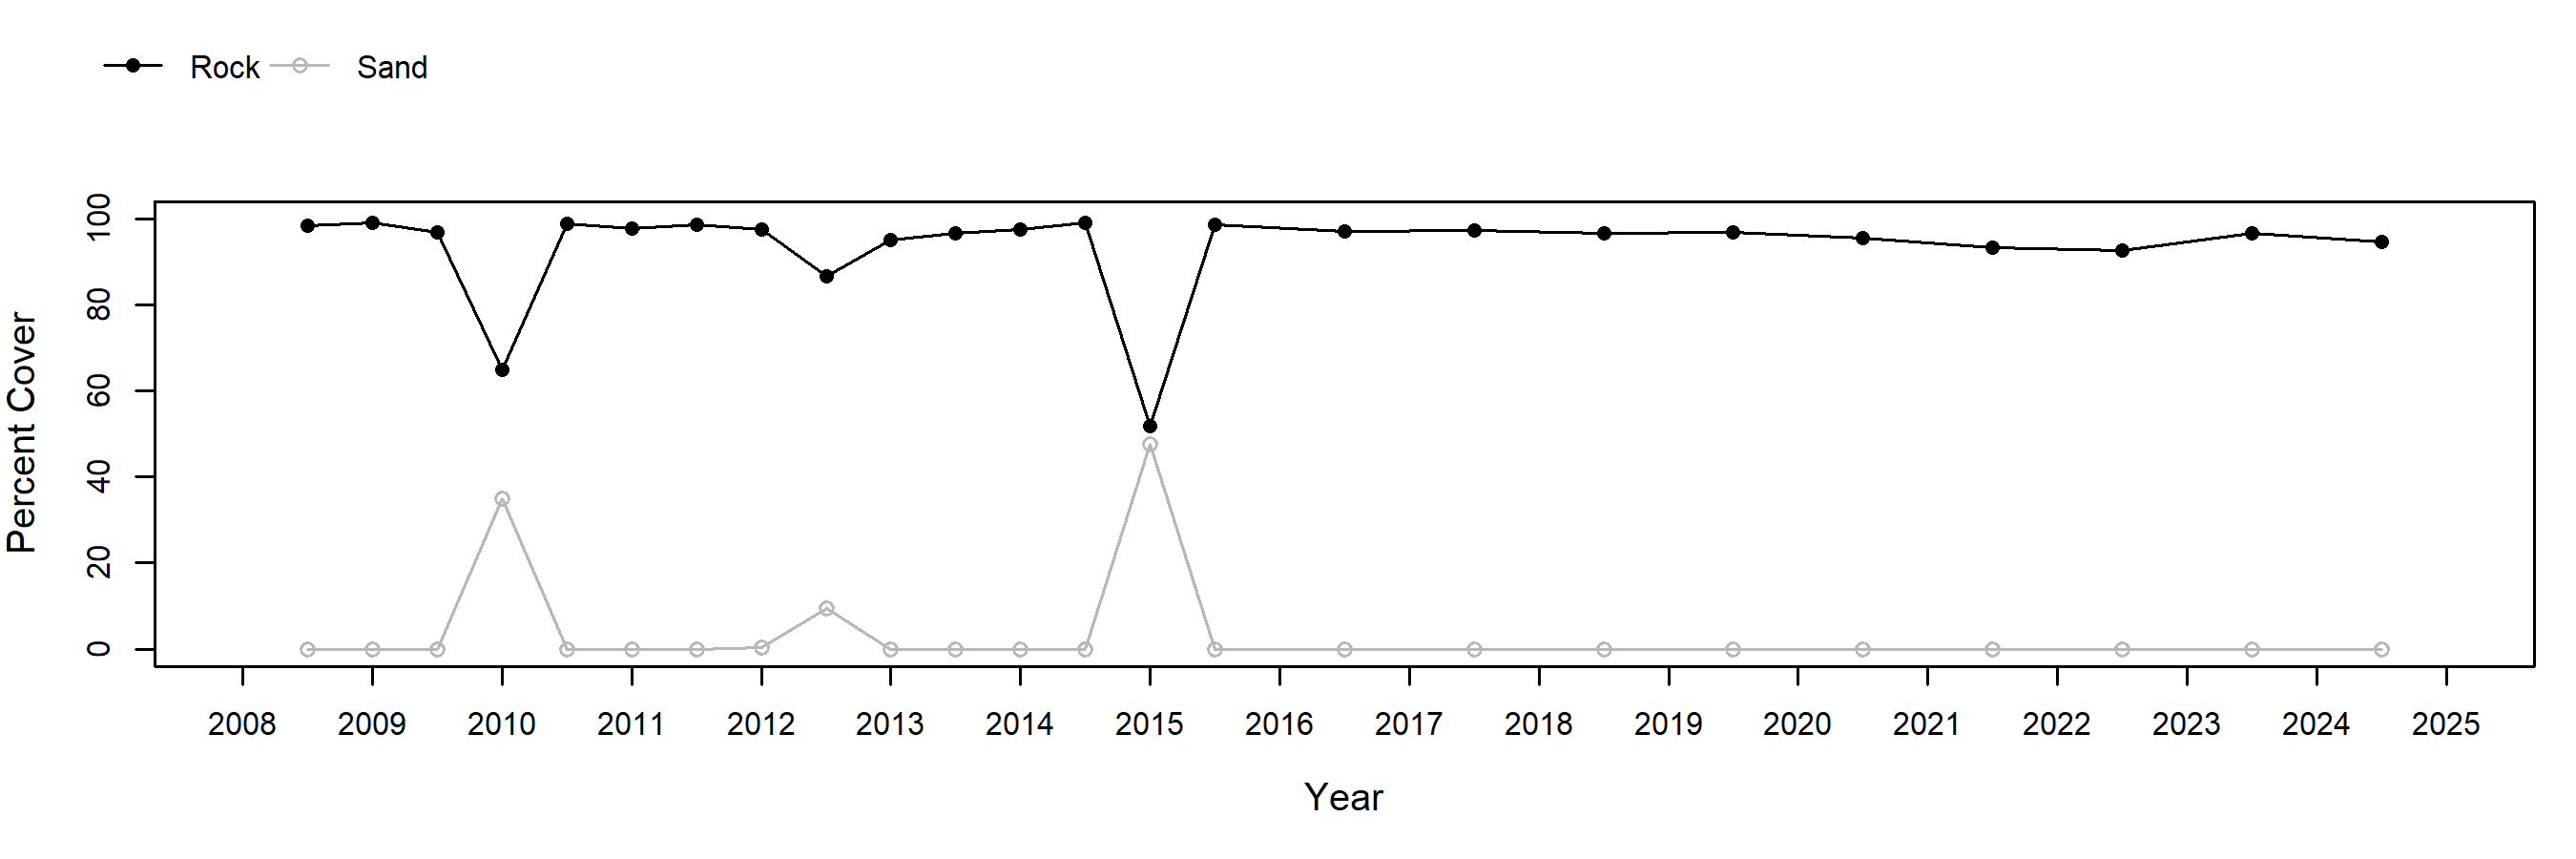
Rock ("Above Barnacles") plots were added to this site in the fall of 2008 to document any upward spread of intertidal species as a result of global climate change or other factors. These plots are expected to remain dominated by bare substrates unless barnacles or other high-intertidal zone species begin to encroach upon them. Other than bare rock and a few bits of tar, a few barnacles (up to 1-5% cover in some plots) were found in most plots by the fall of 2009, however values remain below the threshold for inclusion in the graphs. These plots are subject to occasional sand burial and scour. Sand burial events occurred in the spring of 2010 and the fall of 2012; other scour events may have occurred in between our regular sampling intervals. Motile invertebrate counts in rock plots were discontinued in 2018.
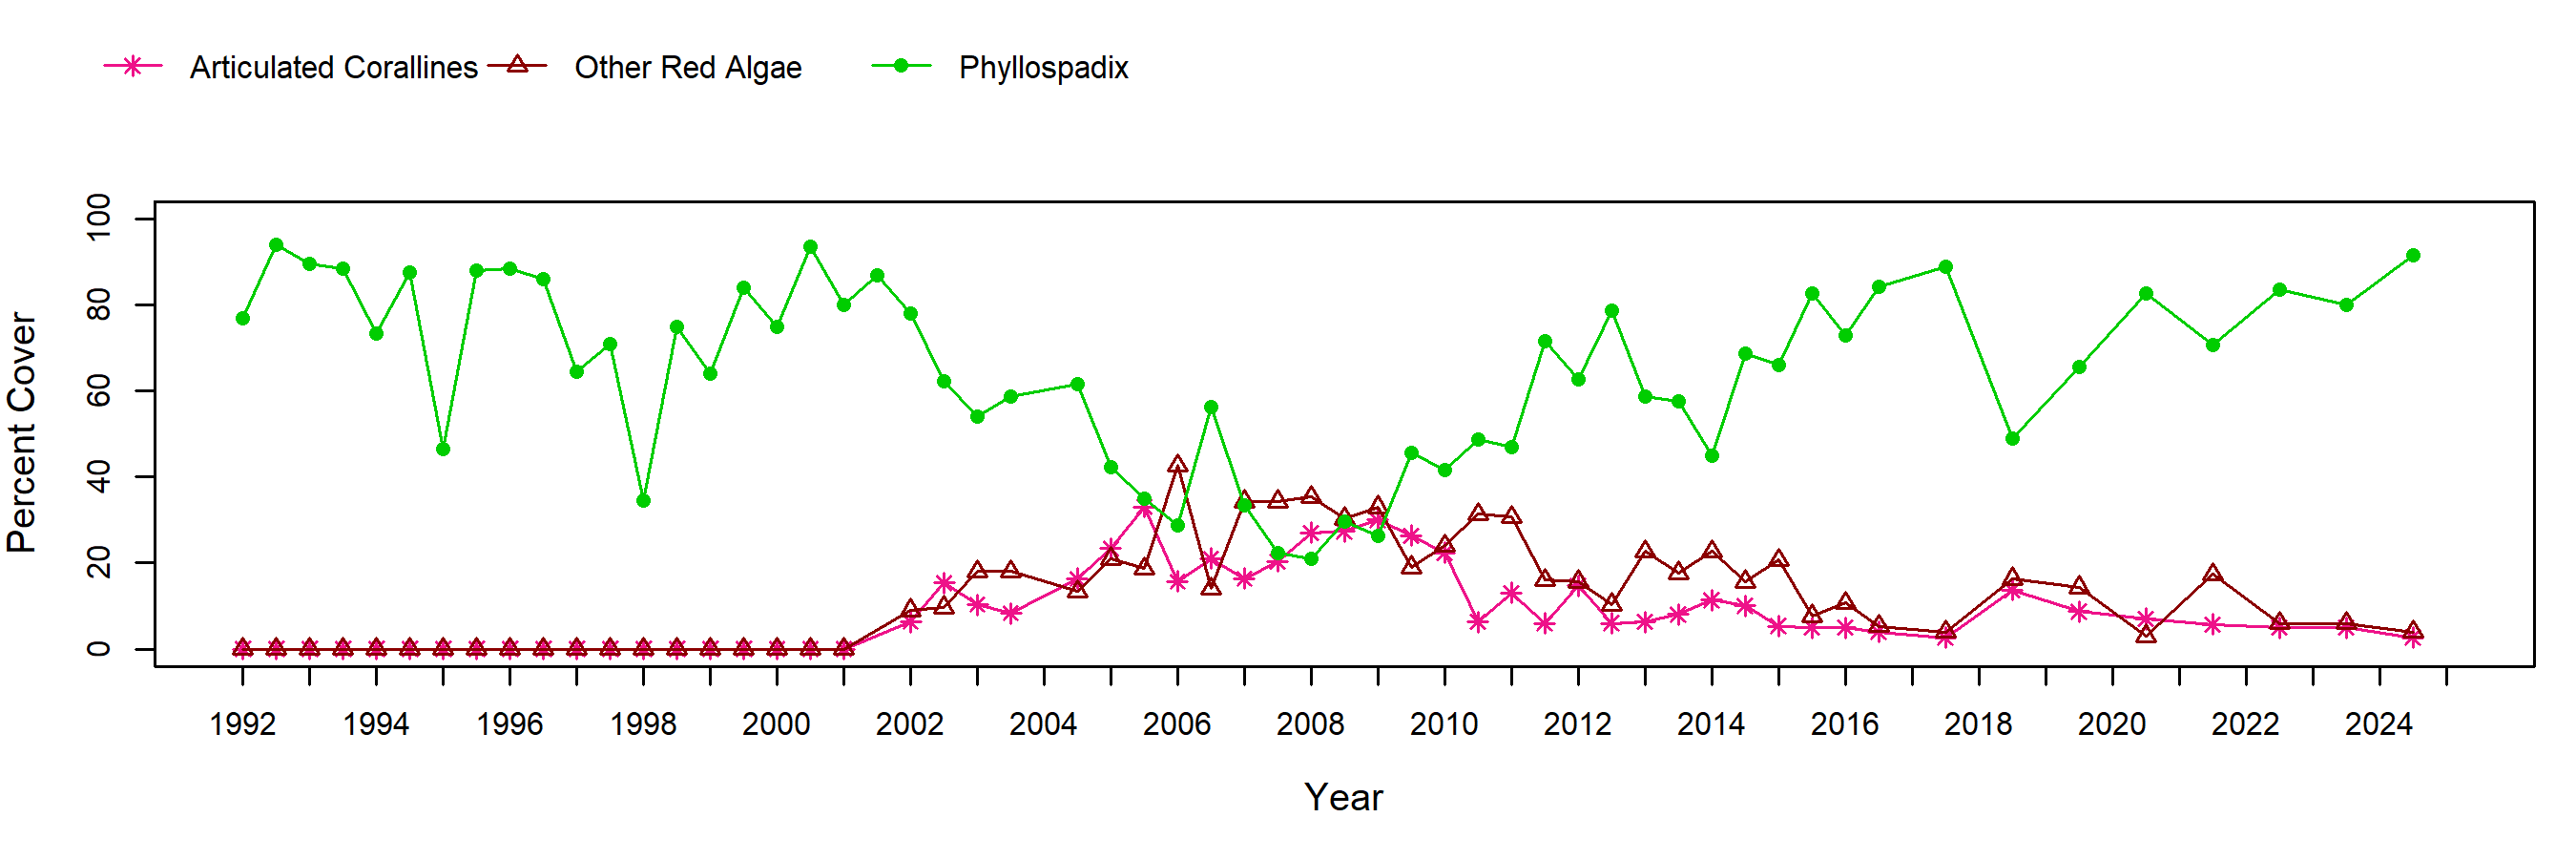
The mean cover of Surfgrass (Phyllospadix spp.) has fluctuated widely throughout the years at Arroyo Hondo. Initially, only two transects were installed at this site due to limited habitat on a single horizontal reef top, however a third transect was added in the spring of 2001 to achieve consistency with other sites. Throughout the 1990's and up to 2002, mean surfgrass cover varied from a high of around 90% to a low of around 30%, but with cover rebounding to the higher end every few seasons or so and the long-term mean remaining around 80%. Starting in 2002, Phyllospadix underwent a decline with cover fluctuating between 25 and 60% for almost a decade. Declines in surfgrass have been met with increases in algal cover (mostly Chondracanthus sp. and articulated corallines). Surfgrass cover generally recovered to near historical high levels from 2012 to 2017, however dropped significantly again for the past two surveys.
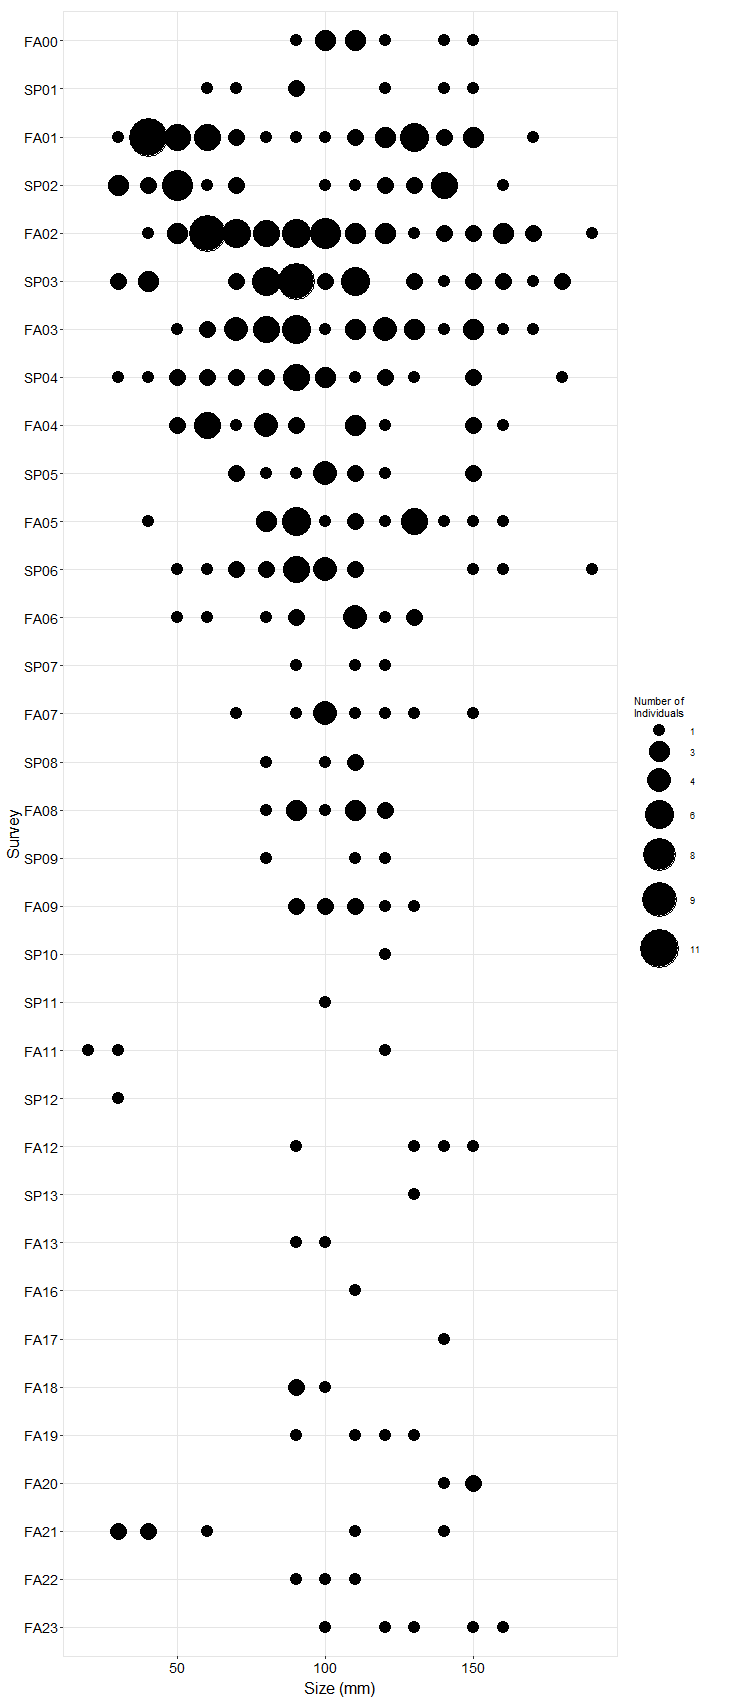
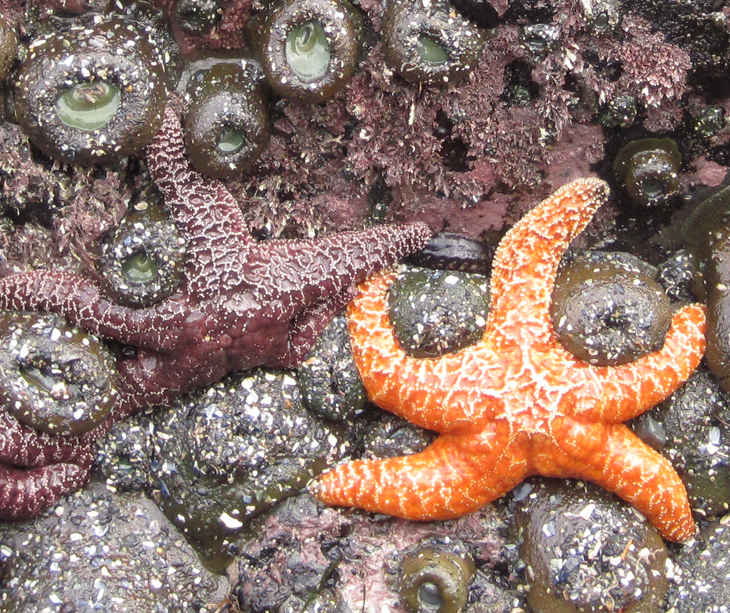
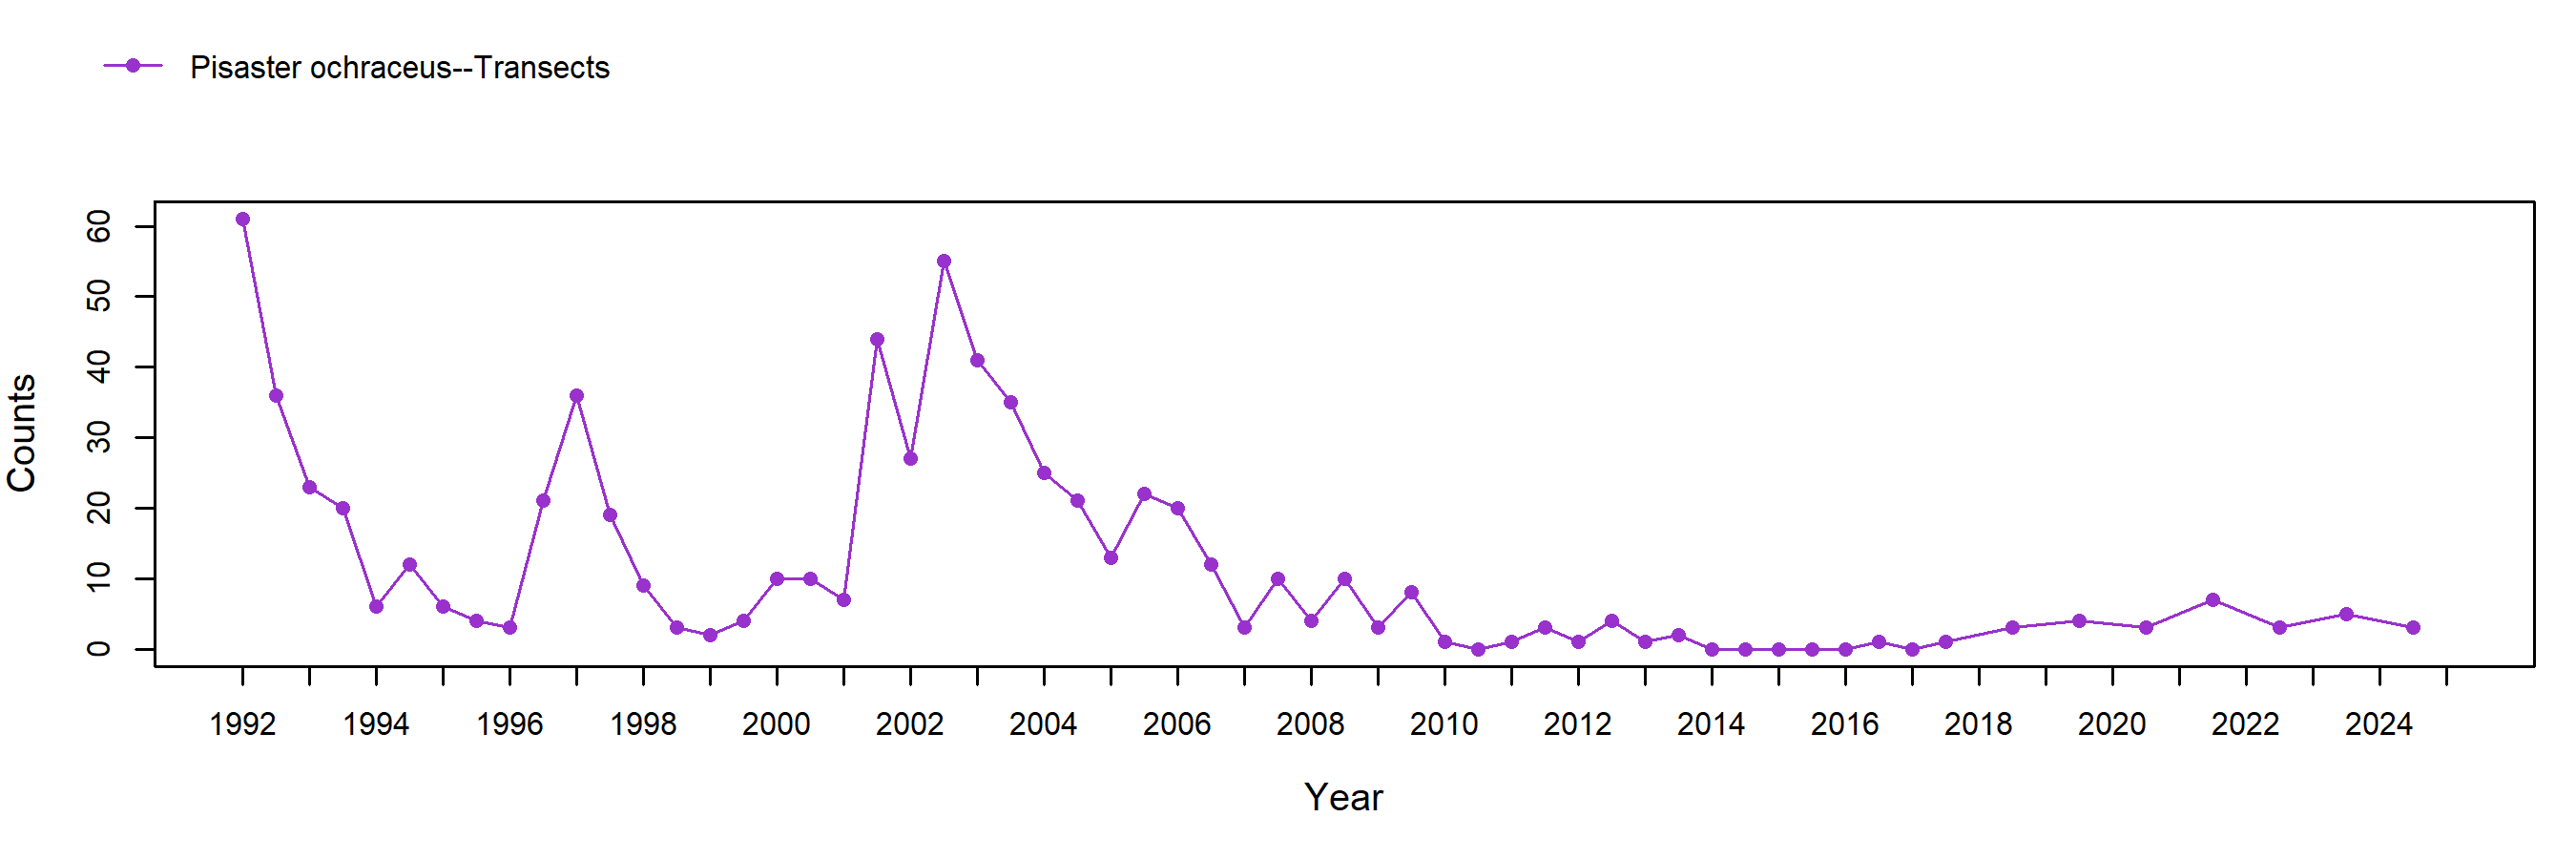
Seastar (Pisaster ochraceus) numbers have fluctuated widely at this site from over 60 stars counted and measured to just a few, with peaks in 1992, 1997 and 2002. Since 2002, there has been a general decline in seastar numbers to nearly zero in 2010. In some periods, seastar numbers show some suggestion of seasonal variation with higher numbers in the spring compared to the fall. These data have historically been collected within three short transect swaths. However, in the spring of 2004, the push for methodological consistency among sites prompted the addition of a series of three large irregular plots encompassing most of the monitoring site to be sampled alongside the transects. These plots contained a higher number of stars, compared to the transect data, during their first few seasons of sampling (expected given the greater amount of area sampled), but with declines converging toward the transect data numbers in more recent seasons and likewise approaching zero by 2010. Seastar plot data is not shown. Seastar sizes have been measured since the fall of 2000. A large recruitment pulse occurred in the fall of 2001 and the growth of these stars is evident in these trend graphs. No other significant recruitment events have been observed. Despite the fact that our monitoring reef is separated from other reefs by expanses of sand, it seems from our size and abundance data that stars are able to migrate to and from the reef. While seastar wasting disease arrived at this part of the coast in fall 2013 and a couple of possibly sick stars were observed during that sampling season, no conclusive evidence of the disease was ever recorded at this site. That said, the numbers of stars in fixed plots dropped from 10 in fall 2013 (irregular plots) to two in spring 2014 and one in fall 2014. An additional sitewide search in fall 2014 turned up three more stars. It seems likely that the disease struck this site, but did so during the Spring and Summer preceding our Fall survey. In 2019 only four seastars were found on transect, however 68 were found on a sitewide search, mostly aggregating on one rocky ridge to the East of the transects.
Photo Plots
Below are the trends observed for each Photo Plot target species at this site. Long-Term percent cover trend graphs also include any species that reached a minimum of 25% cover during any single point in time within a given target species assemblage. Breaks in trend lines represent missed sampling events. For additional species observed that did not meet this 25% threshold, please use the Interactive Map.
For motile invertebrate Species Counts, a mean across all plots was calculated, and only those species with a value of at least 5 individuals for at least one sample are shown. Due to time constraints, motile invertebrate counts have not been done at most sites since 2012. For motile invertebrate size trend graphs by site, please use the Interactive Map.
Chthamalus/Balanus (Acorn Barnacles) - percent cover
Chthamalus/Balanus (Acorn Barnacles) - motile invertebrate counts
Mytilus (California Mussel) - percent cover
Mytilus (California Mussel) - motile invertebrate counts
Rock (Above Barnacles)
Rock (Above Barnacles) - motile invertebrate counts
Transects
Below are the trends observed for each Transect target species at this site. Long-Term trend graphs also include any species that reached a minimum of 25% cover during any single point in time within a given target species assemblage. Breaks in trend lines represent missed sampling events.
Phyllospadix (Surfgrass)
Species Counts and Sizes
Species Counts and Sizes (where recorded) for Pisaster are shown below for this site. At some sites, other sea star species and Katharina are counted in addition to Pisaster. The sum of all individuals across all plots is displayed. Note that data gaps are represented by breaks in long-term count trend lines, but are not shown in size plots.
Pisaster (Ochre Star) - counts
Pisaster (Ochre Star) - sizes in Transects