Long-Term Monitoring Trend Graphs
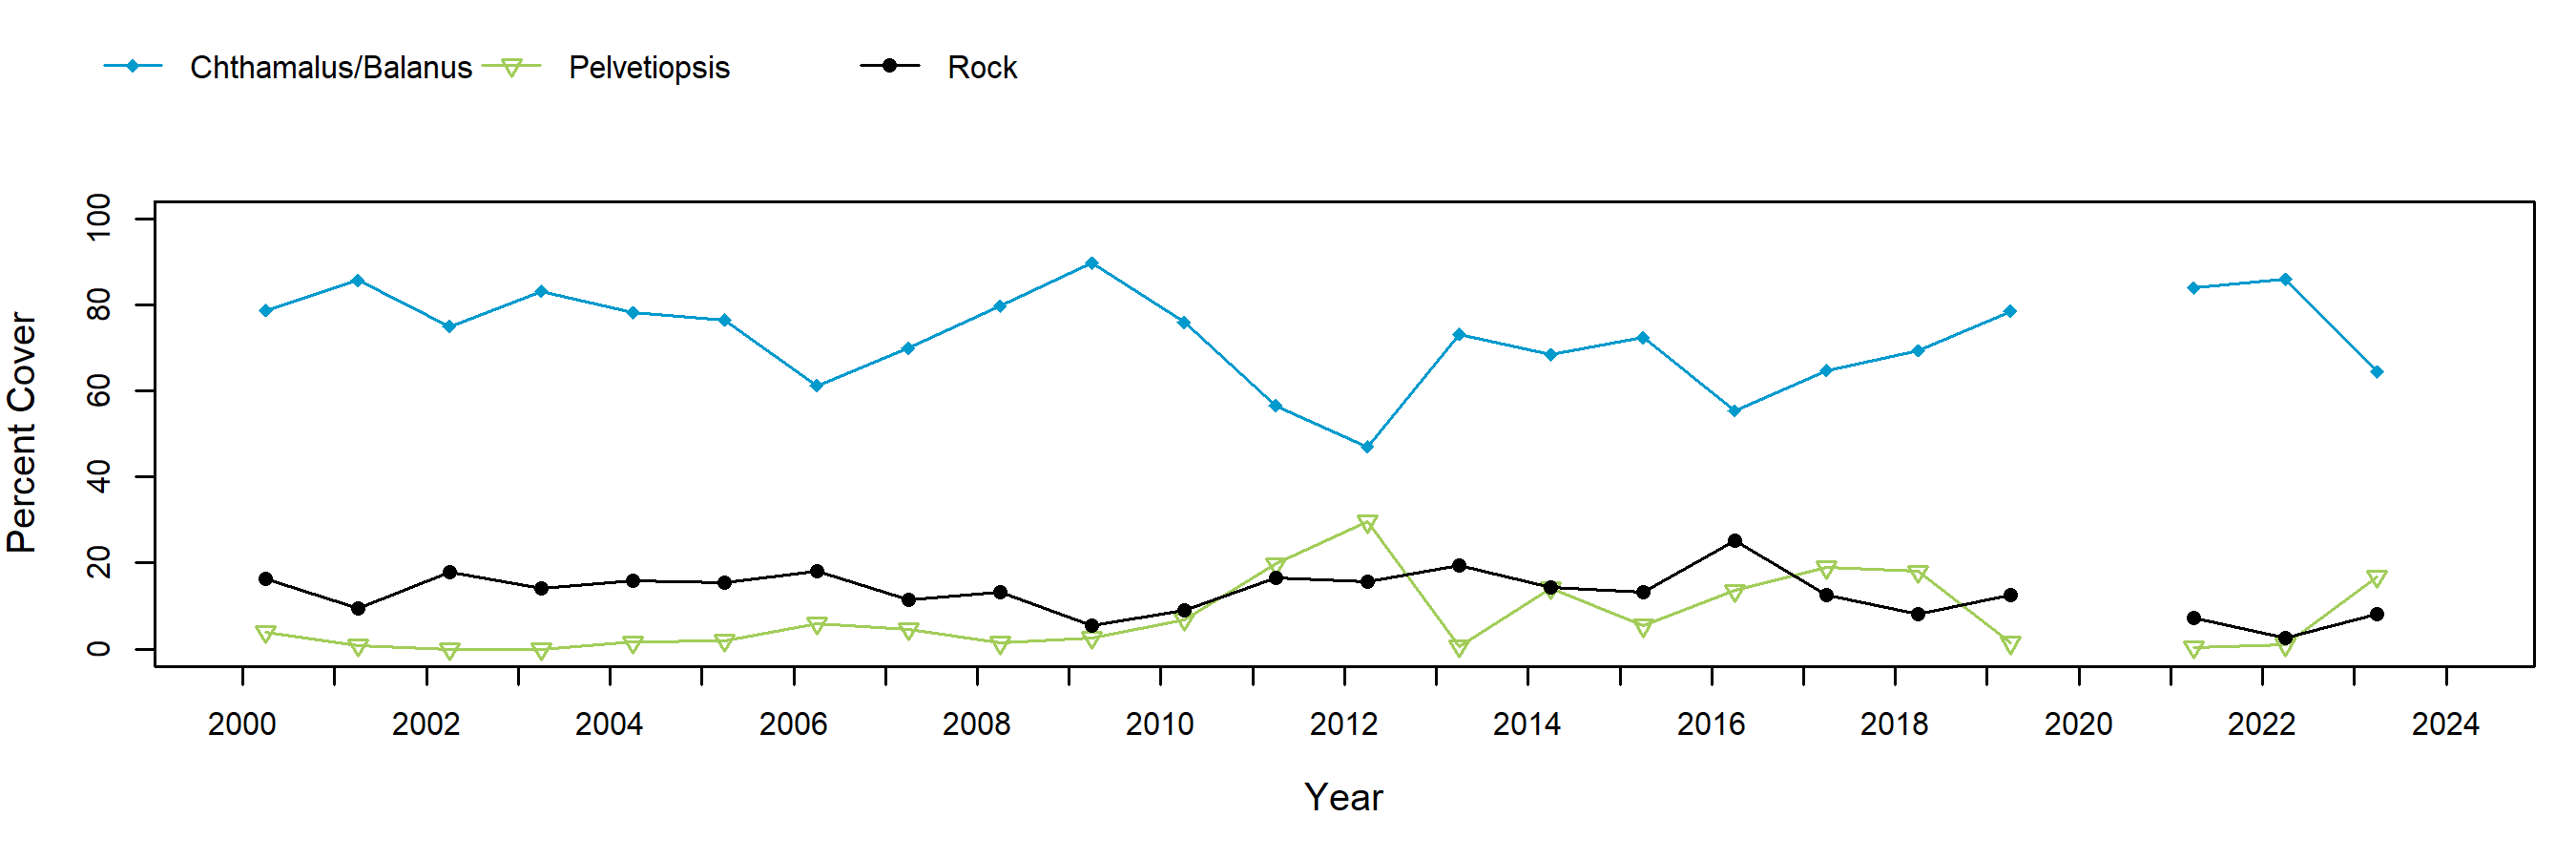
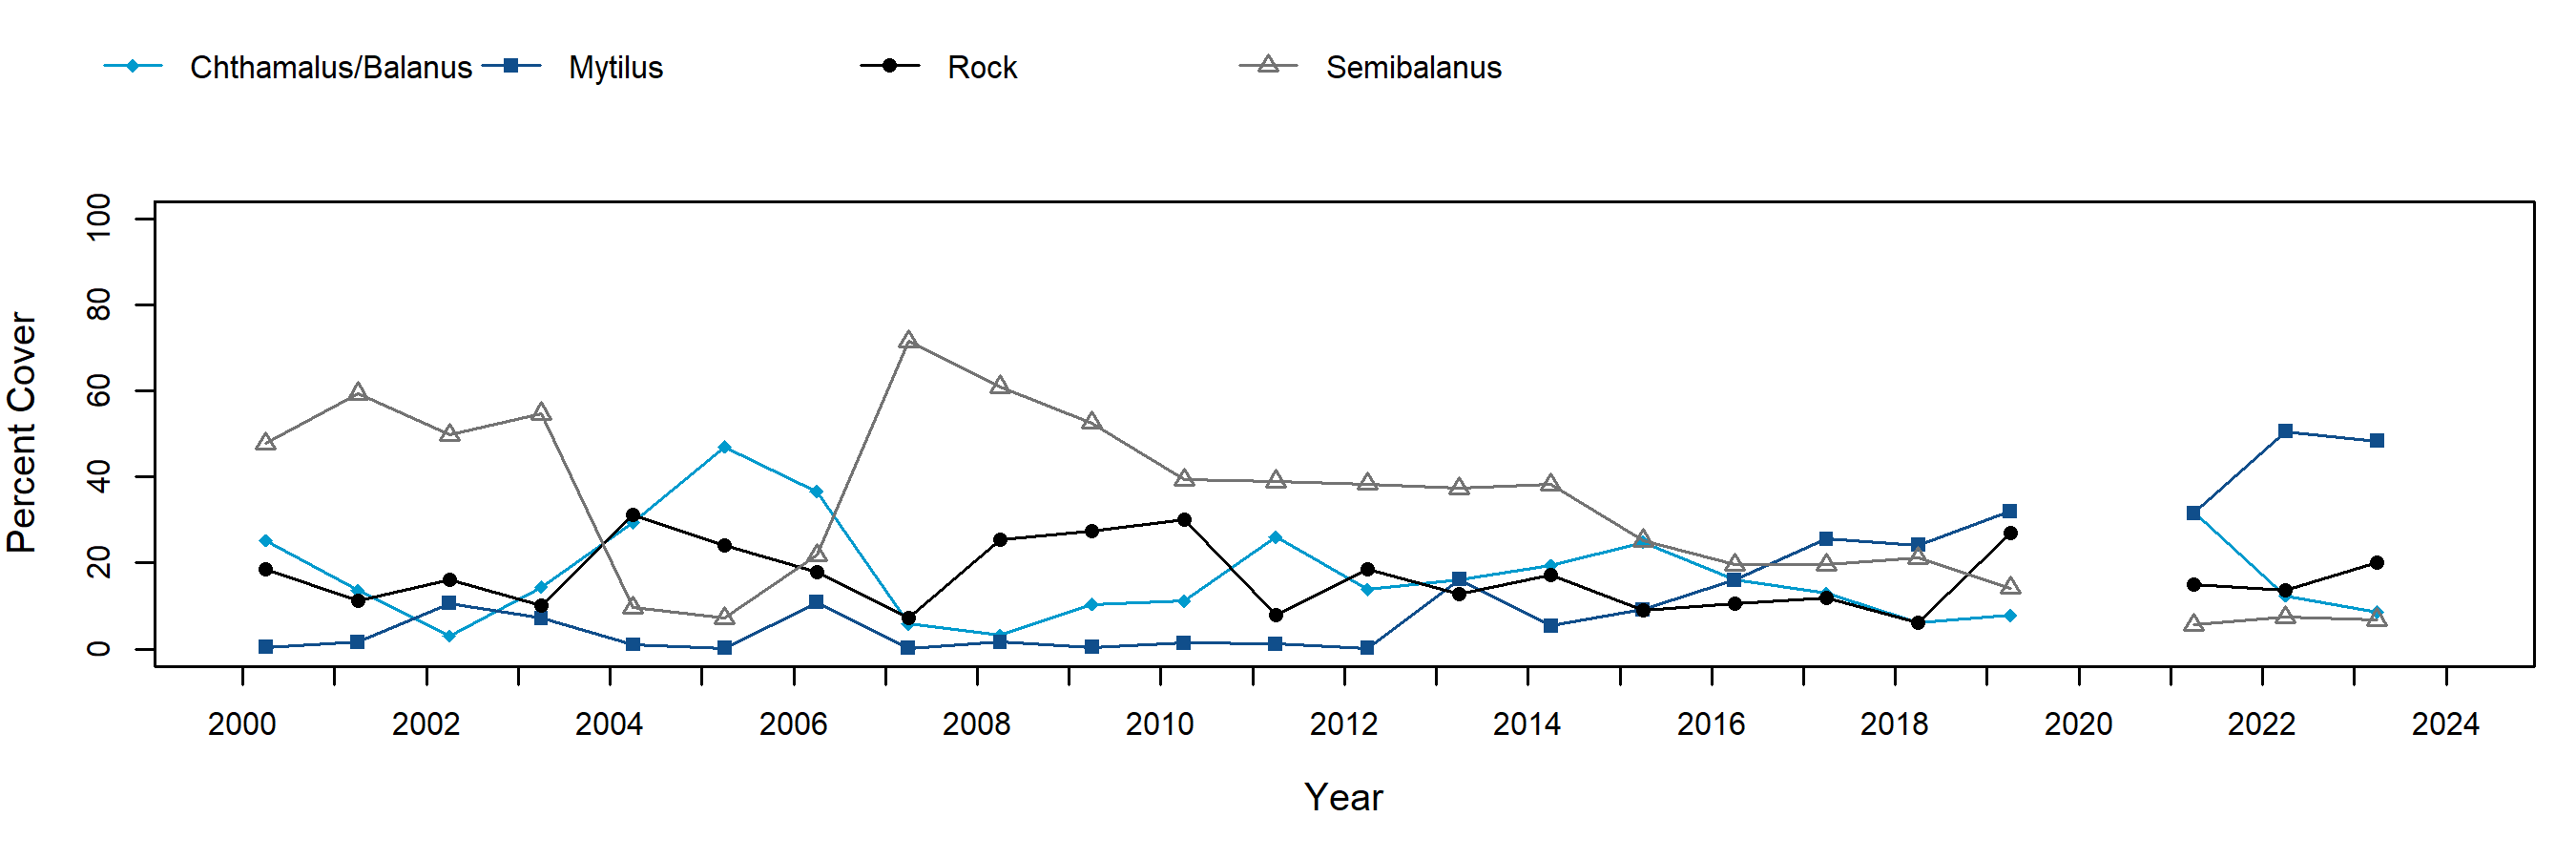
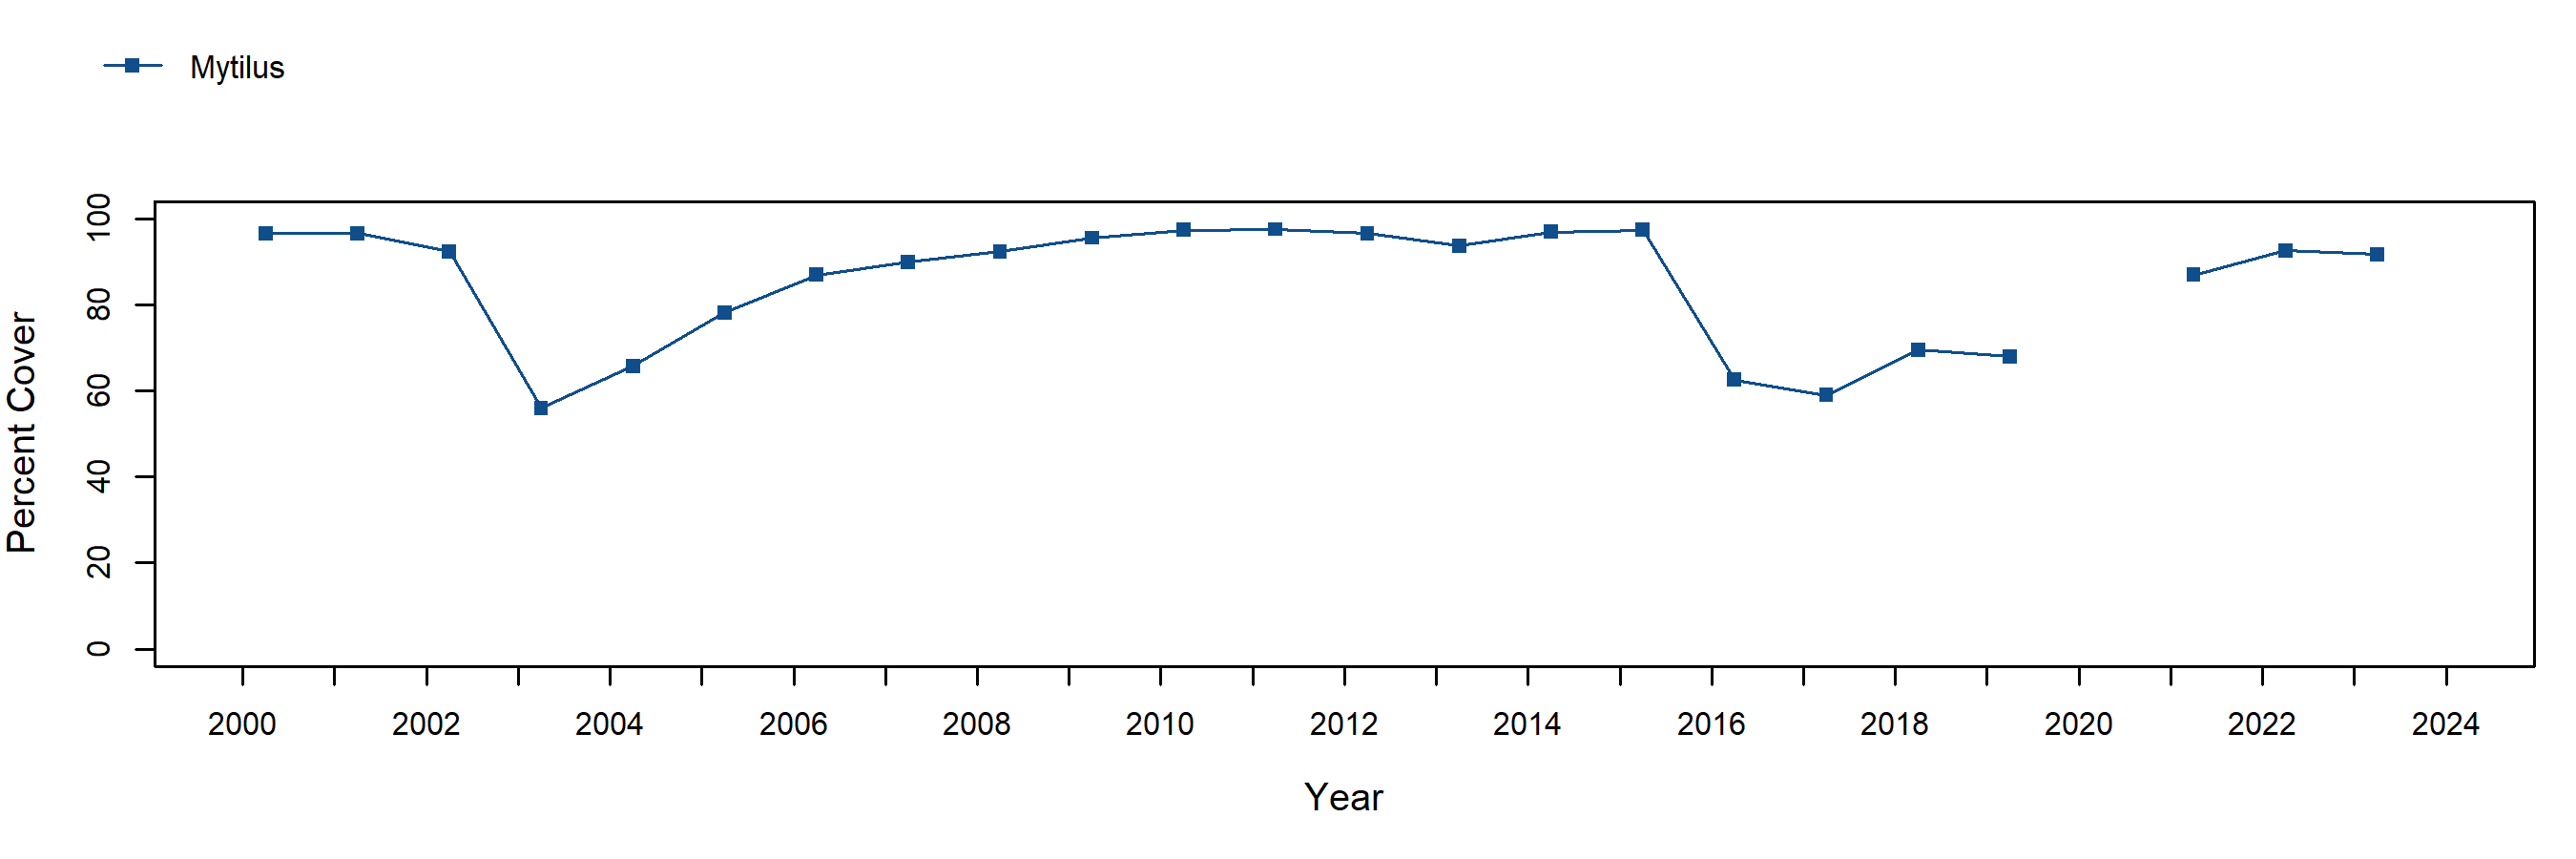
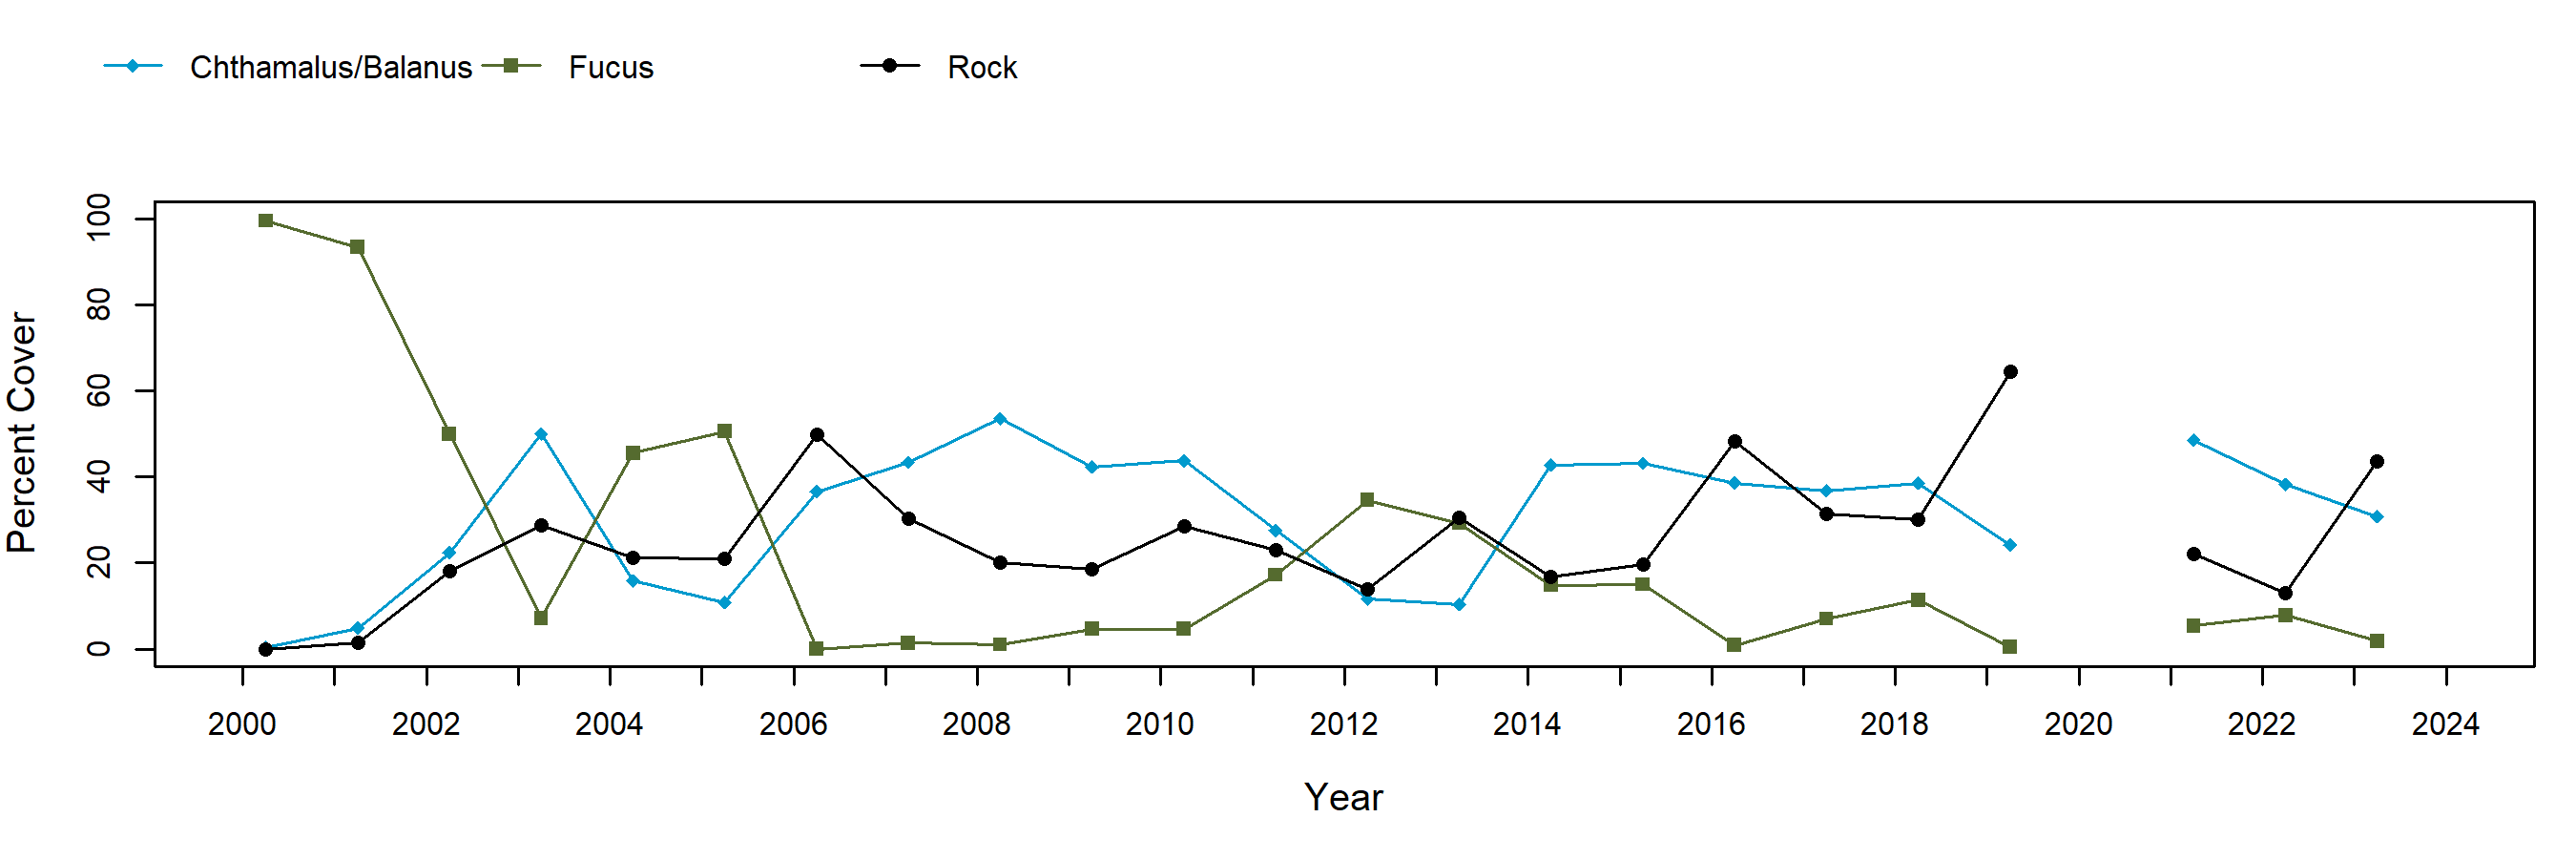
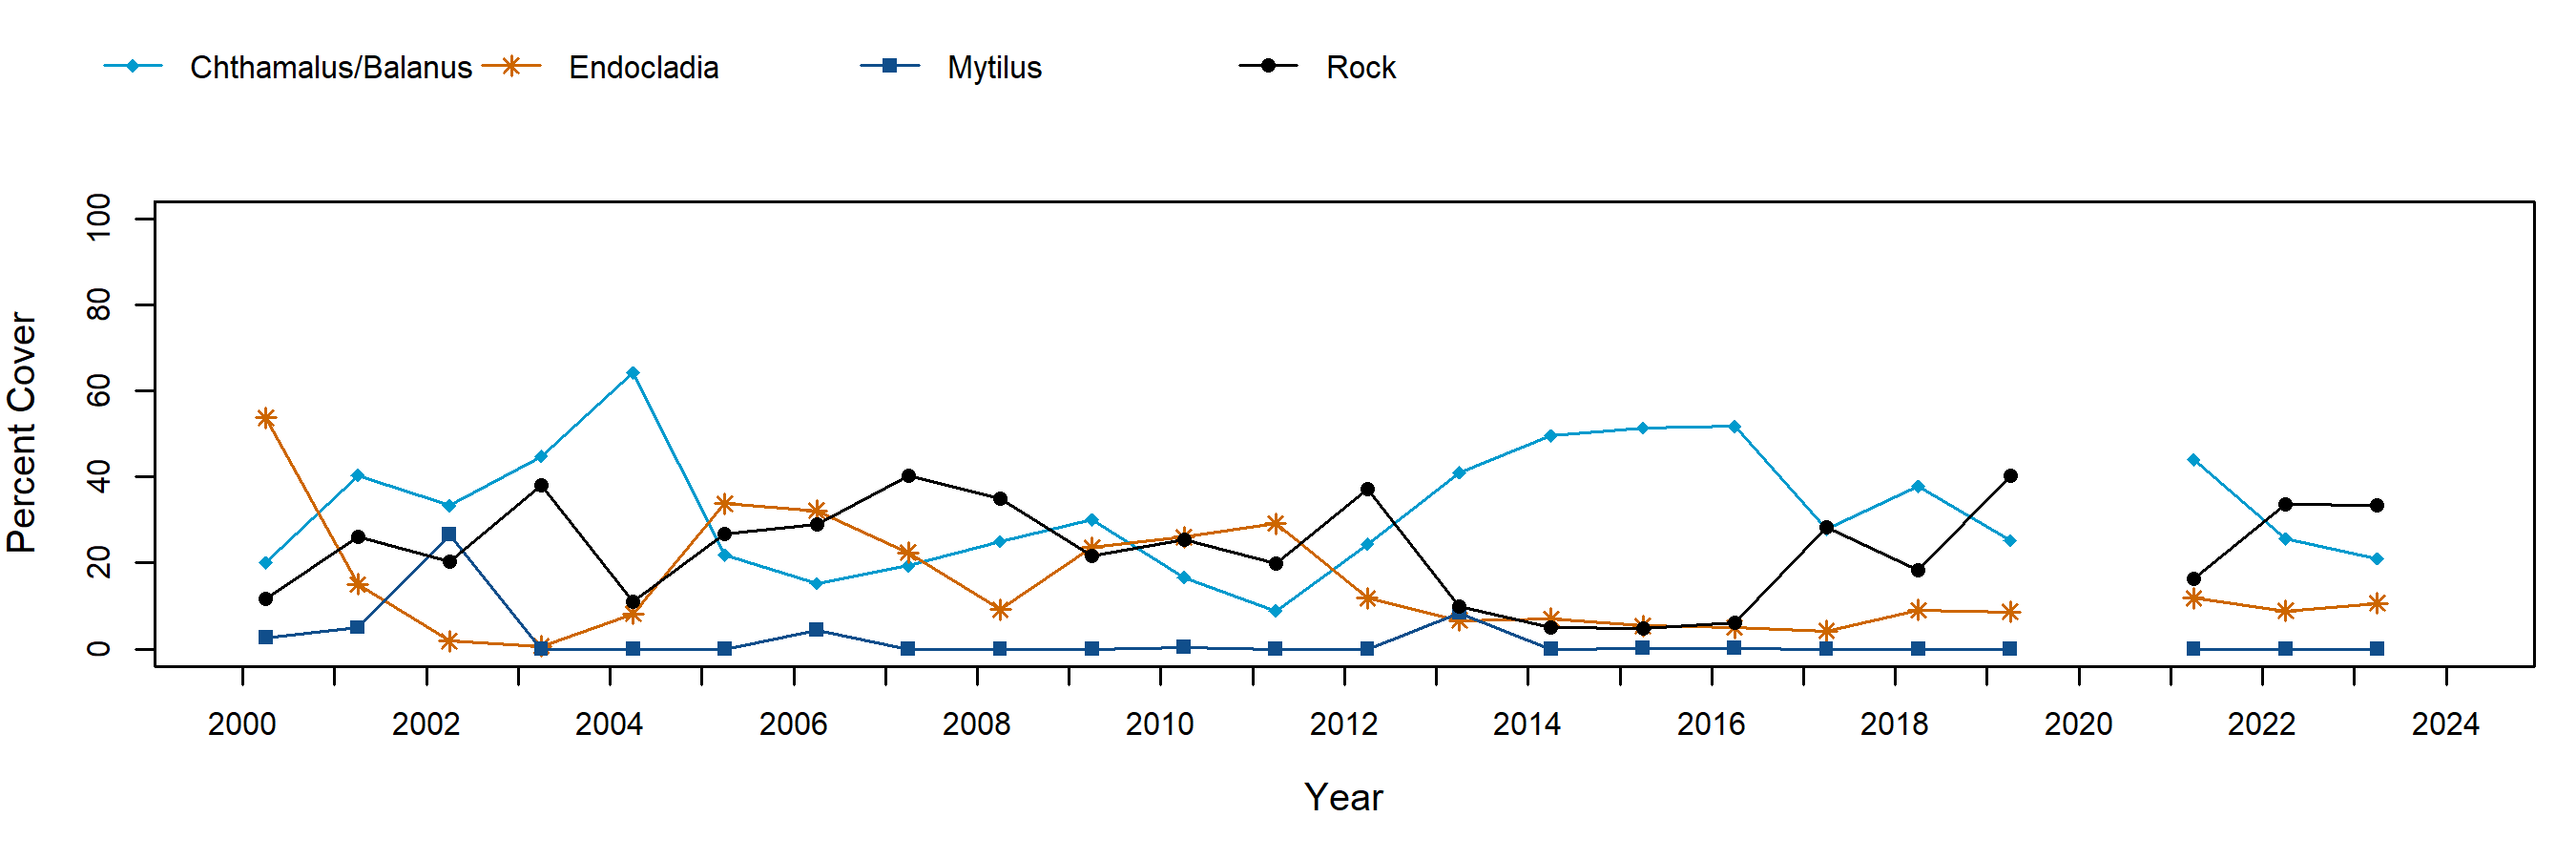
Barnacle cover was generally high in the barnacle plots at Bob Creek, and consisted almost exclusively of Balanus glandula. Barnacle plots at this site are subjected to a high level of scour from sand movement, and plot 5 is often buried when we survey in the summer. Because of this, we added a 6th barnacle plot in 2001 and excluded plot 5 from the trend graph summary data. Cover of Semibalanus within its target plots was quite variable over time, which was somewhat surprising given its ability to be quite long-lived (10-15 years; Morris, Abbott, and Haderlie, 1980). Since 2016, mussels have been increasing in these plots, which likely signals a long-term shift, as Mytilus californianus can also be long-lived. Mussel cover was generally high in Mytilus plots and dips in cover were followed by recovery within a few years’ time. Fucus cover in rockweed plots started out at nearly 100% but declined dramatically in 2002/2003. Rockweed cover increased during 2004/05, and again in 2012, but for most of the 25 year survey period, these plots have largely consisted of barnacles and bare rock. Pelvetiopsis cover in its target plots fluctuated substantially over time, varying inversely with barnacle cover. Endocladia cover in turfweed plots began at just above 50% but then declined and was generally quite low. Barnacles were commonly the most abundant taxa in these plots.
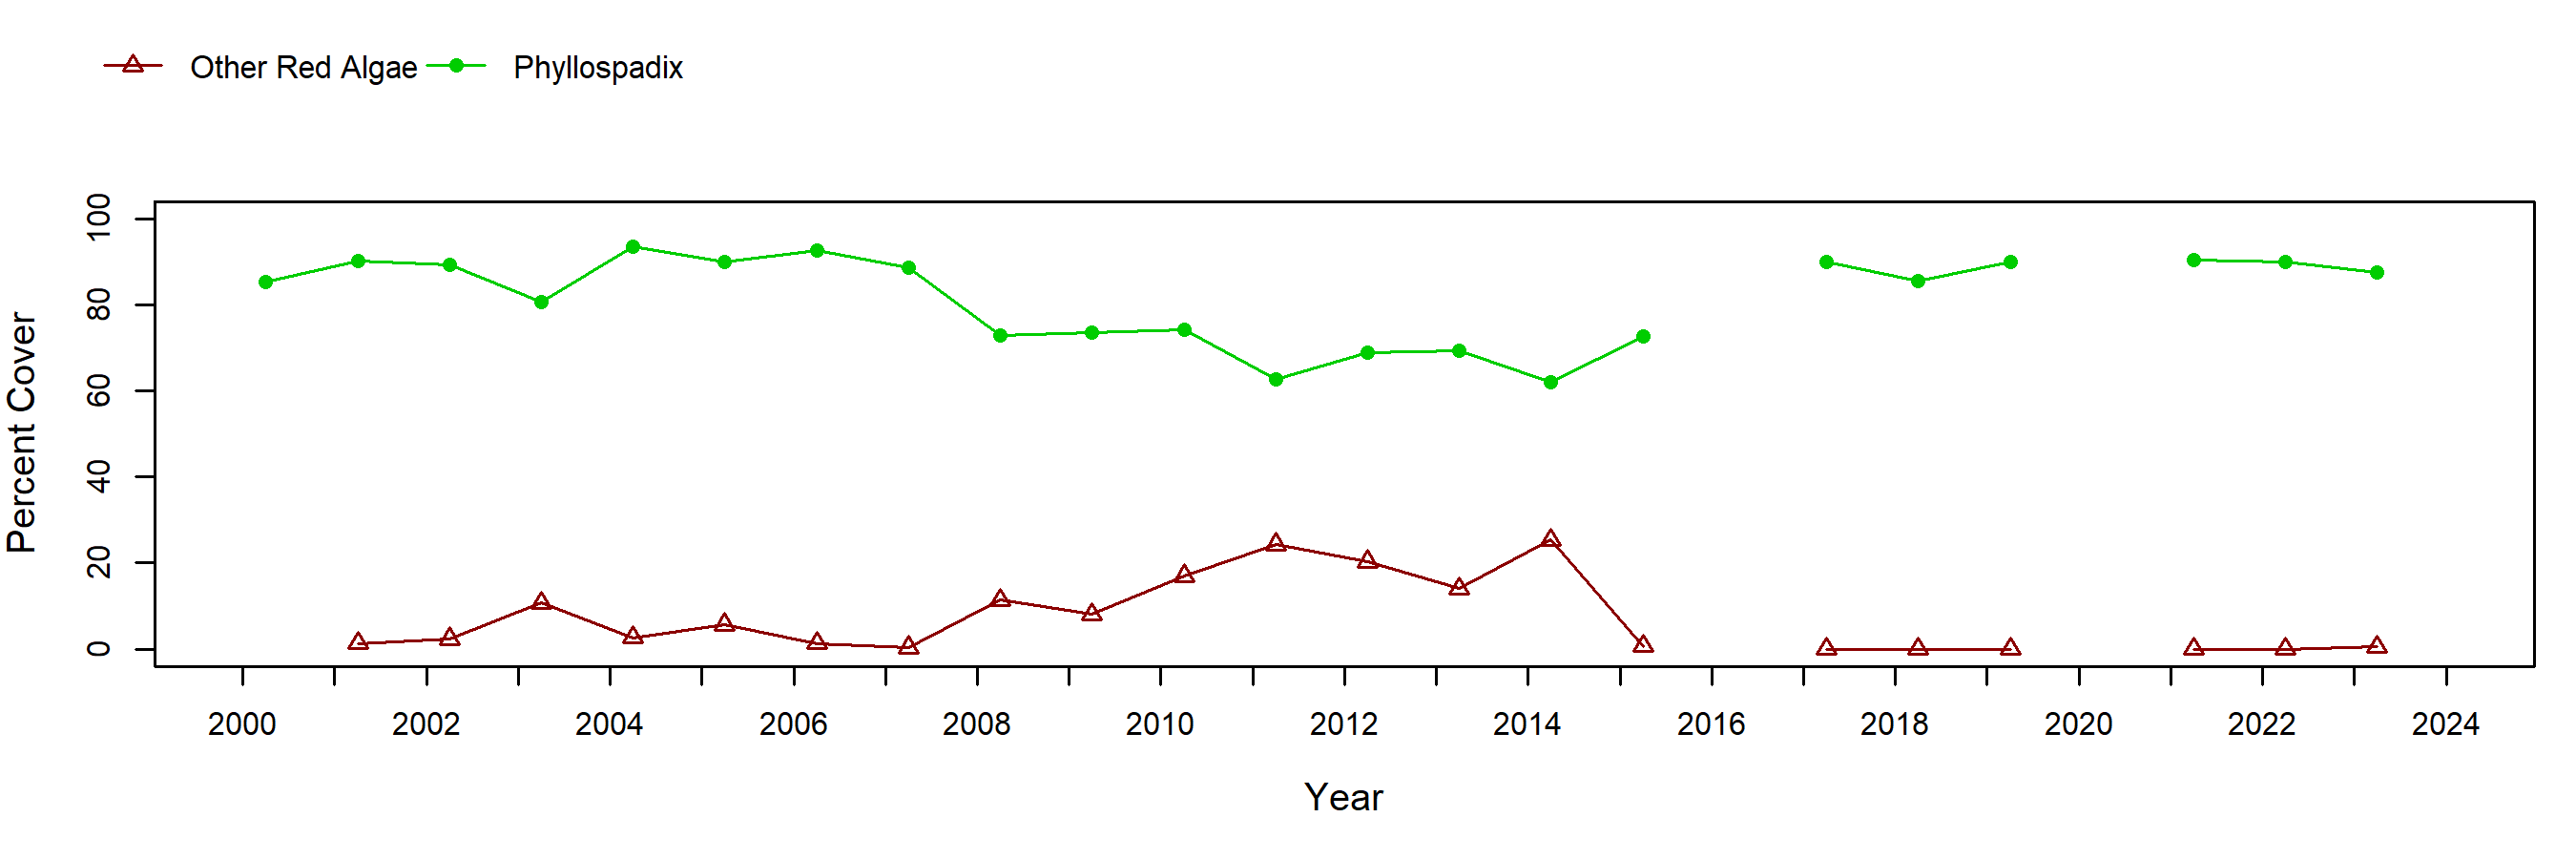
Two of the surfgrass transects at Bob Creek had consistently high cover of Phyllospadix (nearly always close to 100%), but the third transect is located along the side of a surge channel and commonly contains significant cover of red algae such as Prionitis spp. Sampling of this third transect was discontinued in 2017, due to access difficulties.
In ochre star plots, a “jump” in the total count between 2003 and 2004 was due to the enlargement of one plot that had low numbers of stars. Numbers declined in 2014 due to Sea Star Wasting Syndrome but then steadily increased to counts that far exceeded the long-term mean. However, population size structure never recovered to a normal distribution, with small ochre stars (< 50mm radius) much more abundant than larger individuals. In 2024, another substantial drop in numbers was observed, affecting all size classes.
In order to standardize species resolution across all MARINe groups and over time, some species (typically rare) were lumped for graphical presentation of Long-Term monitoring data. See lumped categories for definitions (some variation occurs between methods and over time).
If you experience any barriers accessing the trend graphs below, please contact (pacificr@ucsc.edu) for help.
Photo Plots

Below are the trends observed for each Photo Plot target species at this site. Long-Term percent cover trend graphs also include any species that reached a minimum of 25% cover during any single point in time within a given target species assemblage. Breaks in trend lines represent missed sampling events. For additional species observed that did not meet this 25% threshold, please use the Graphing Tool.
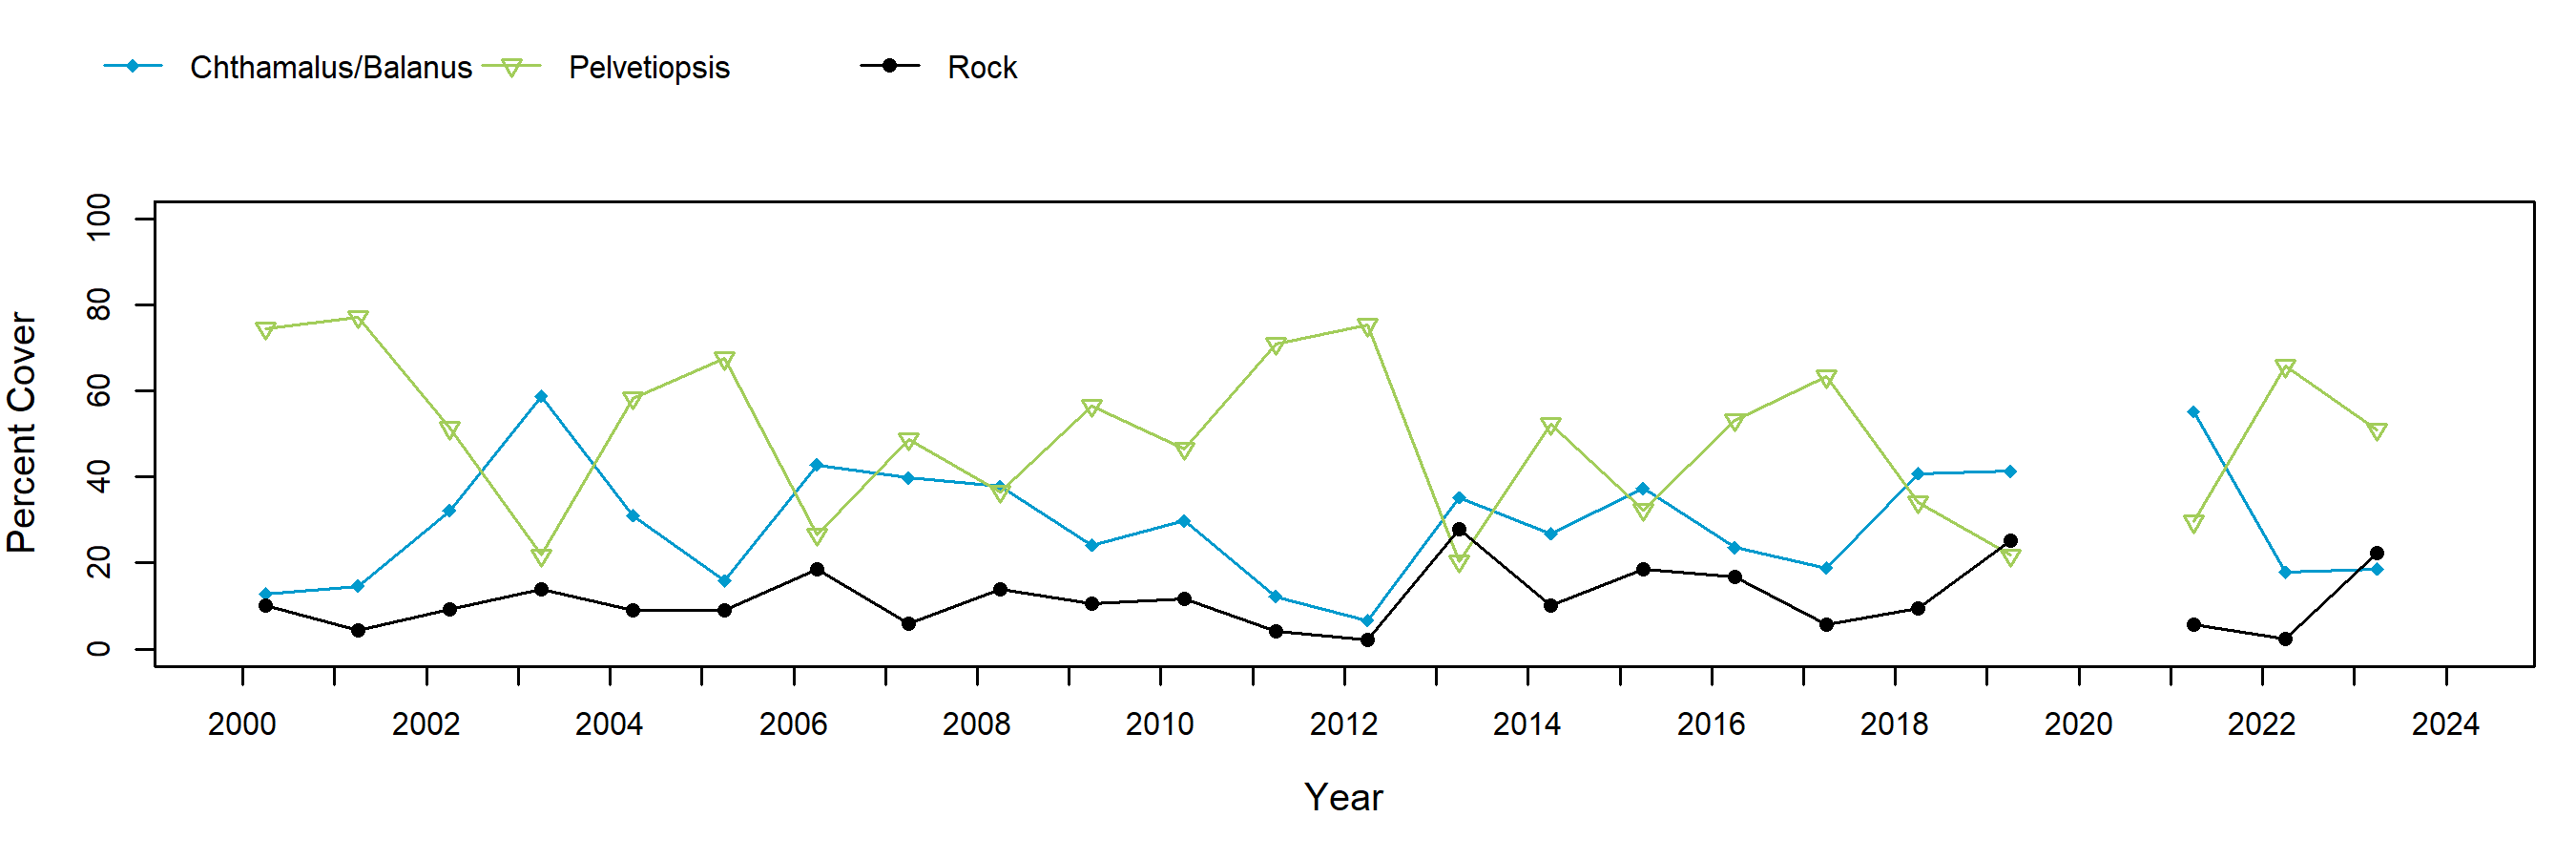
Chthamalus/Balanus (Acorn Barnacles) – percent cover
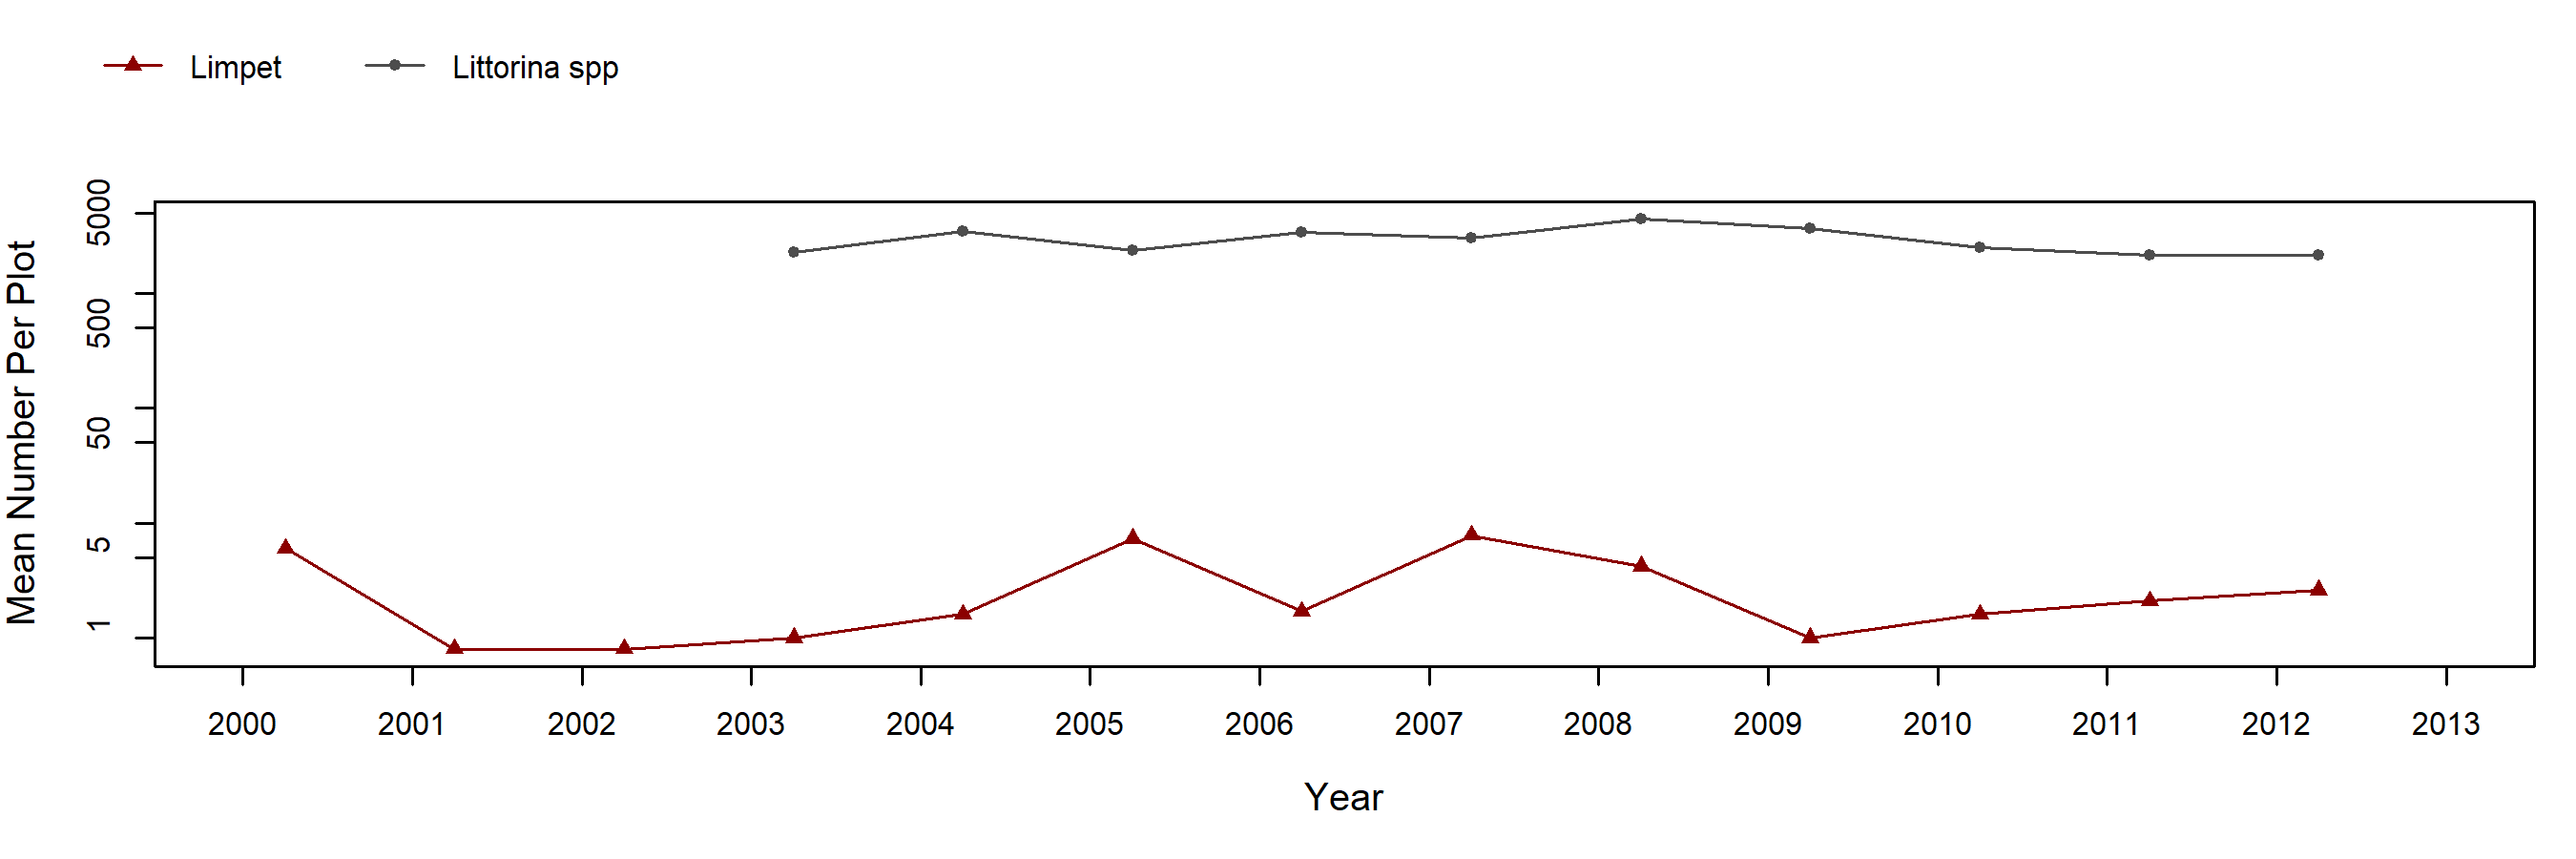
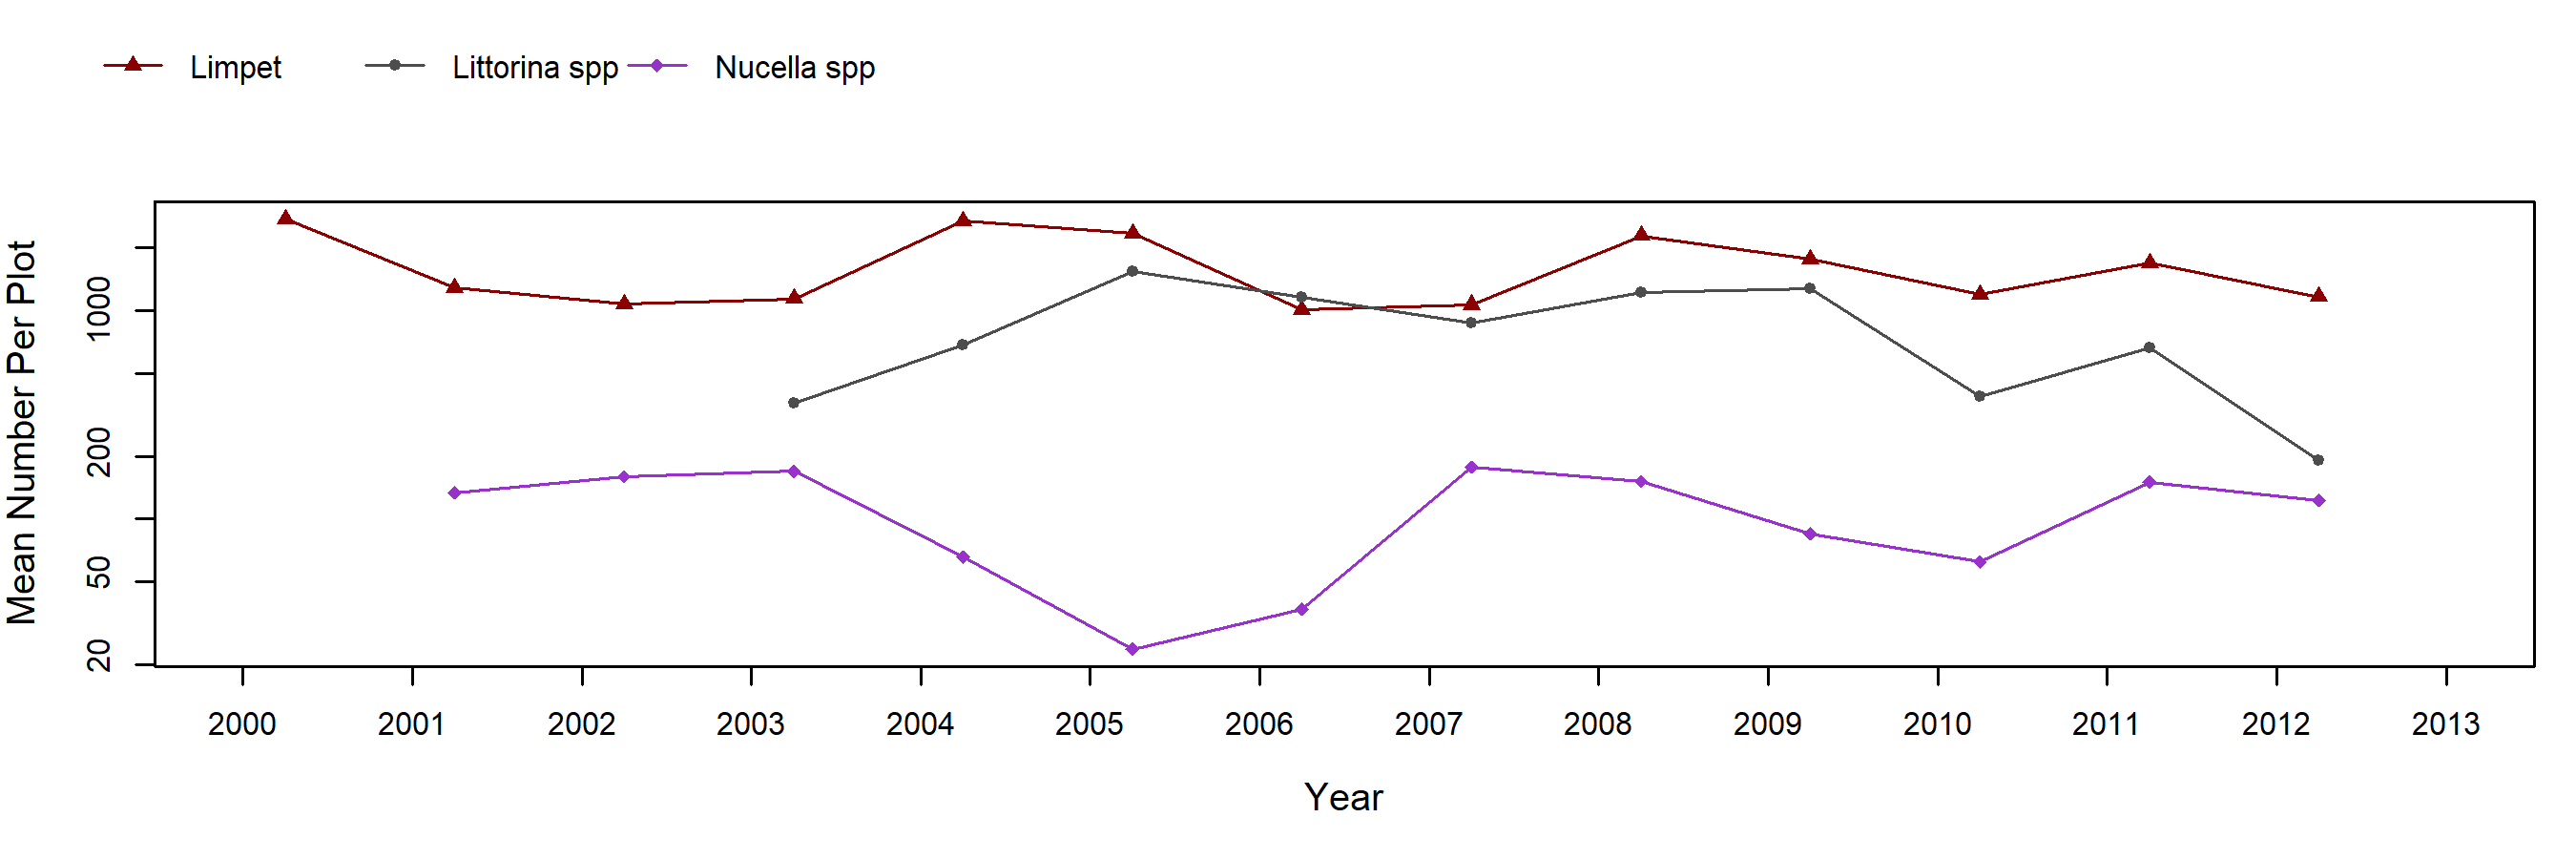
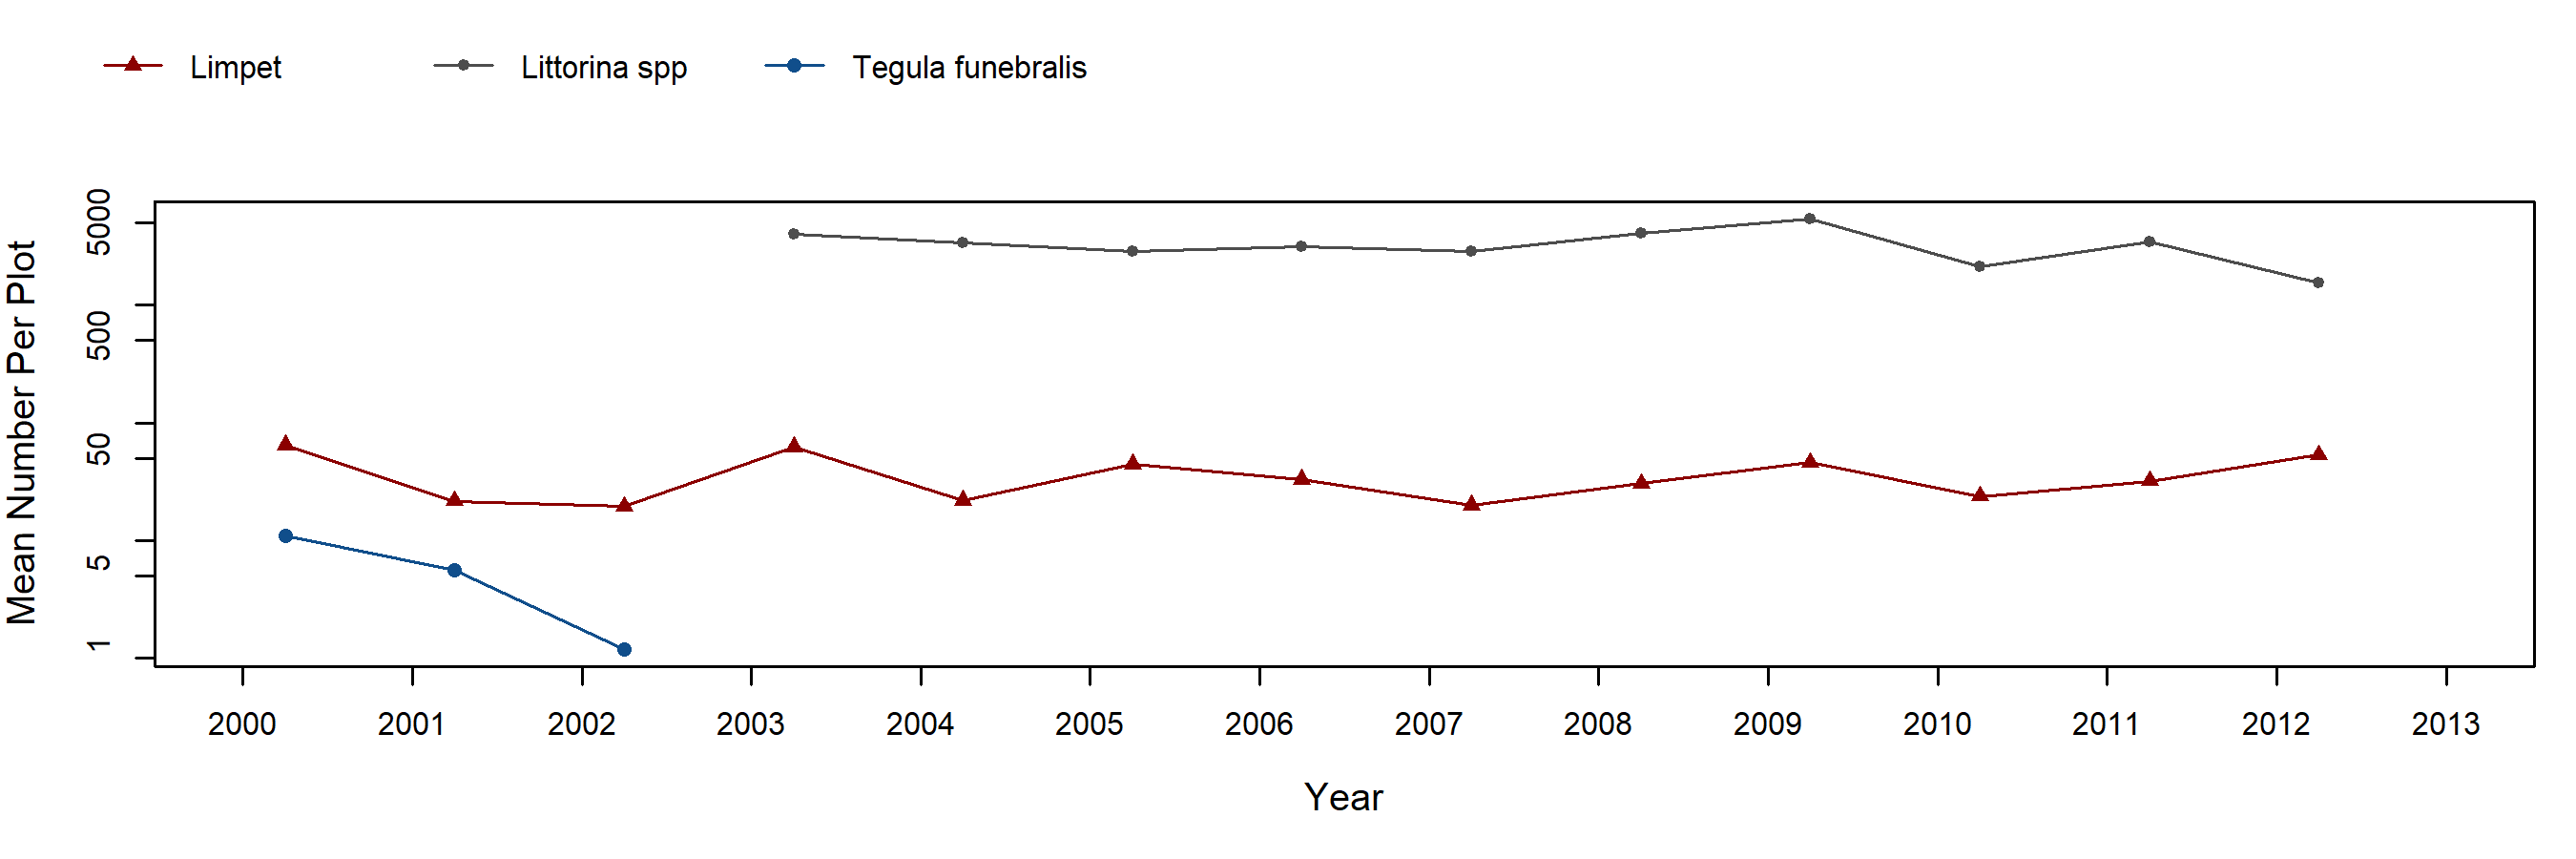
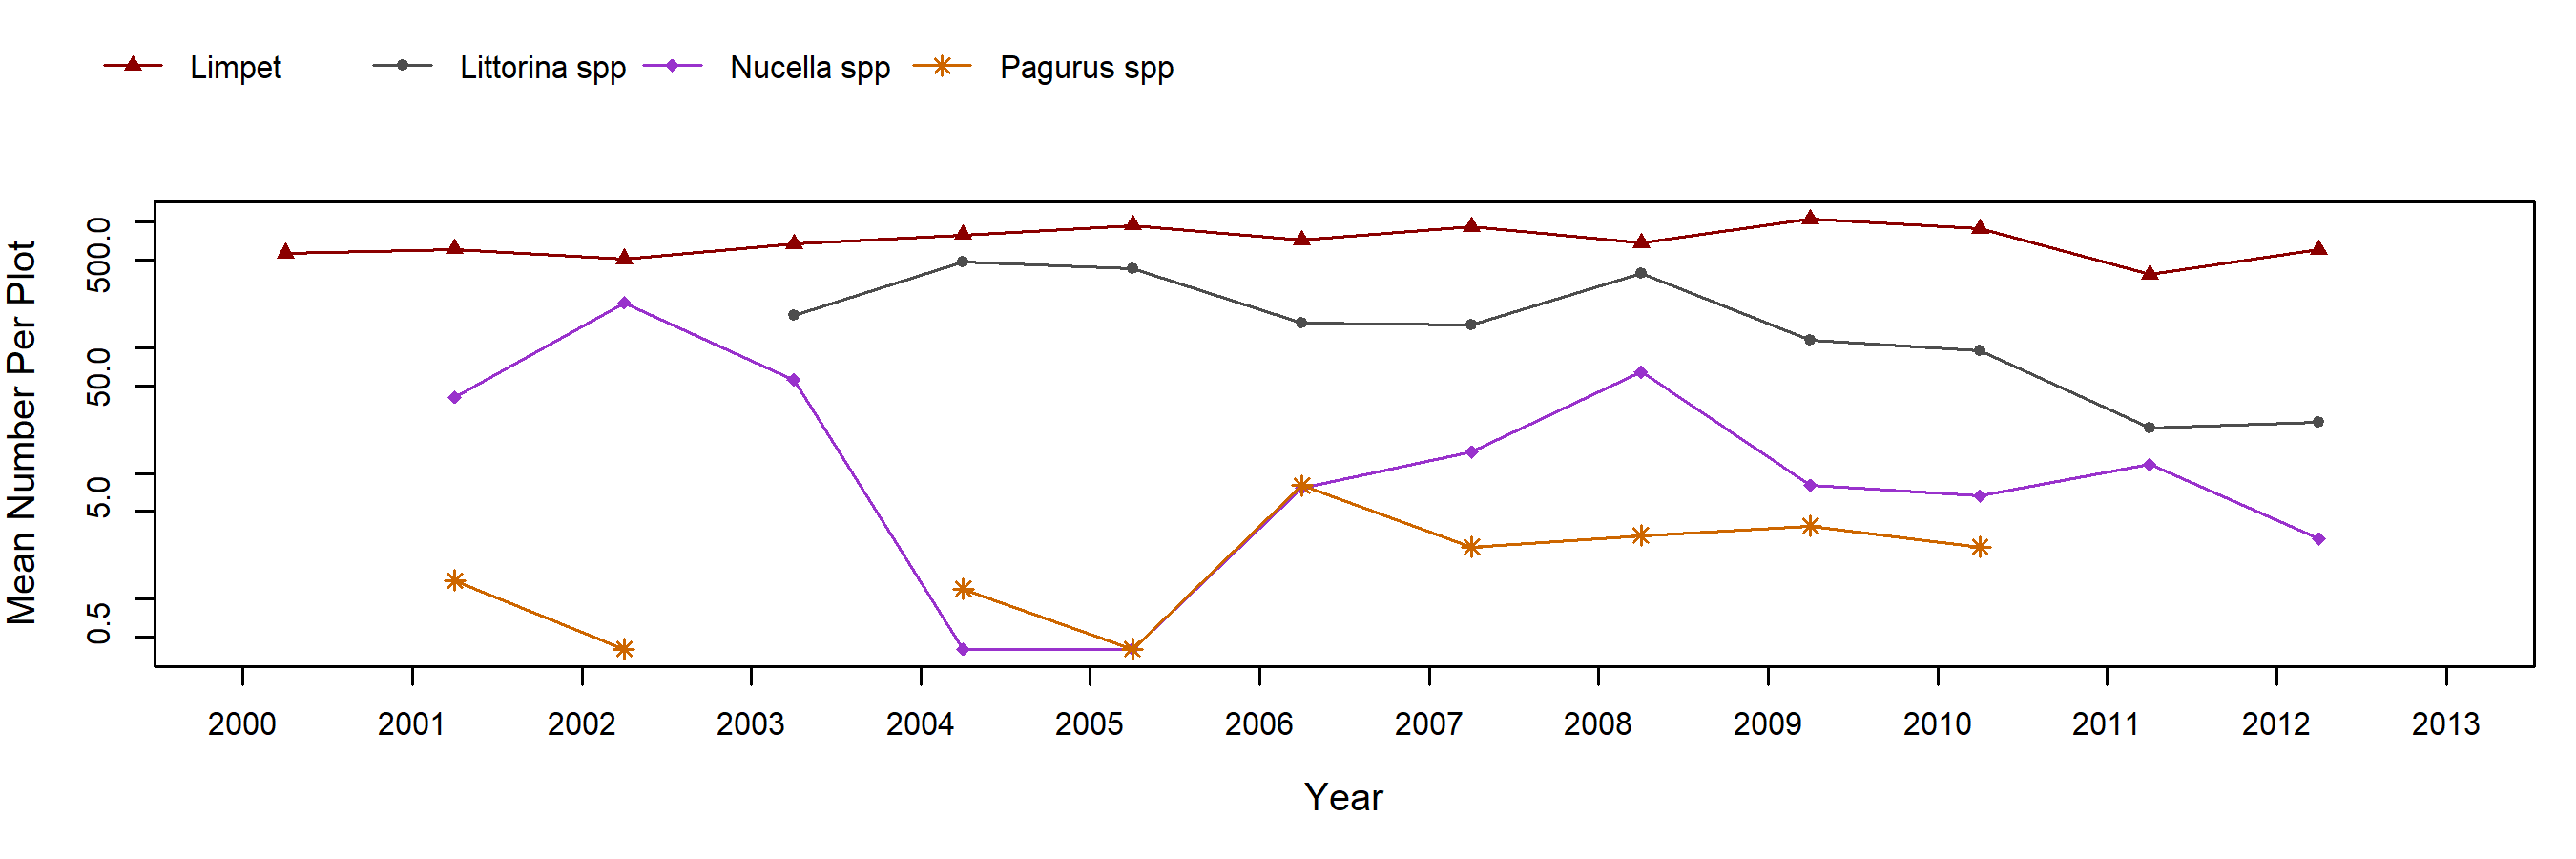
Chthamalus/Balanus (Acorn Barnacles) – motile invertebrate counts
Semibalanus (Thatched Barnacle) – percent cover
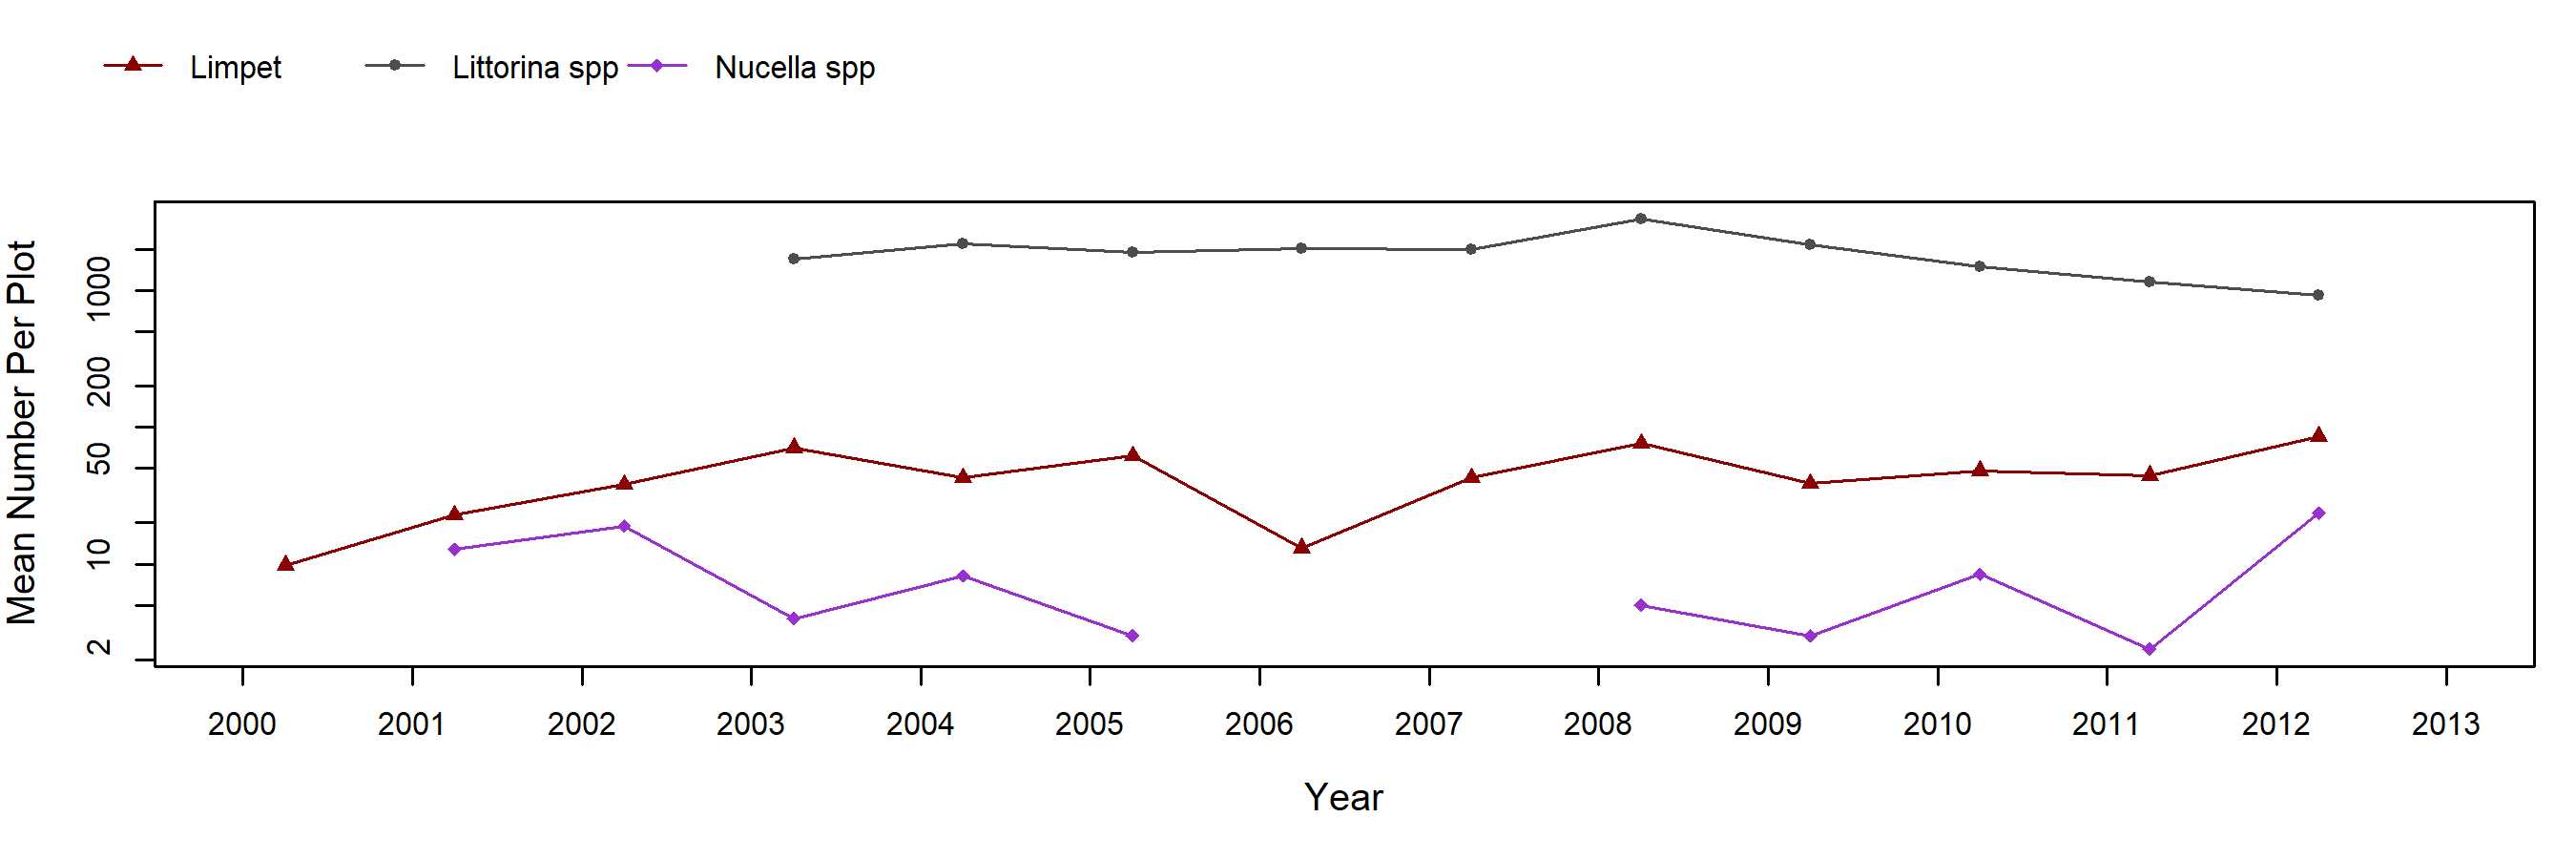
Semibalanus (Thatched Barnacle) – motile invertebrate counts
Mytilus (California Mussel) – percent cover
Mytilus (California Mussel) – motile invertebrate counts
Fucus (Northern Rockweed) – percent cover
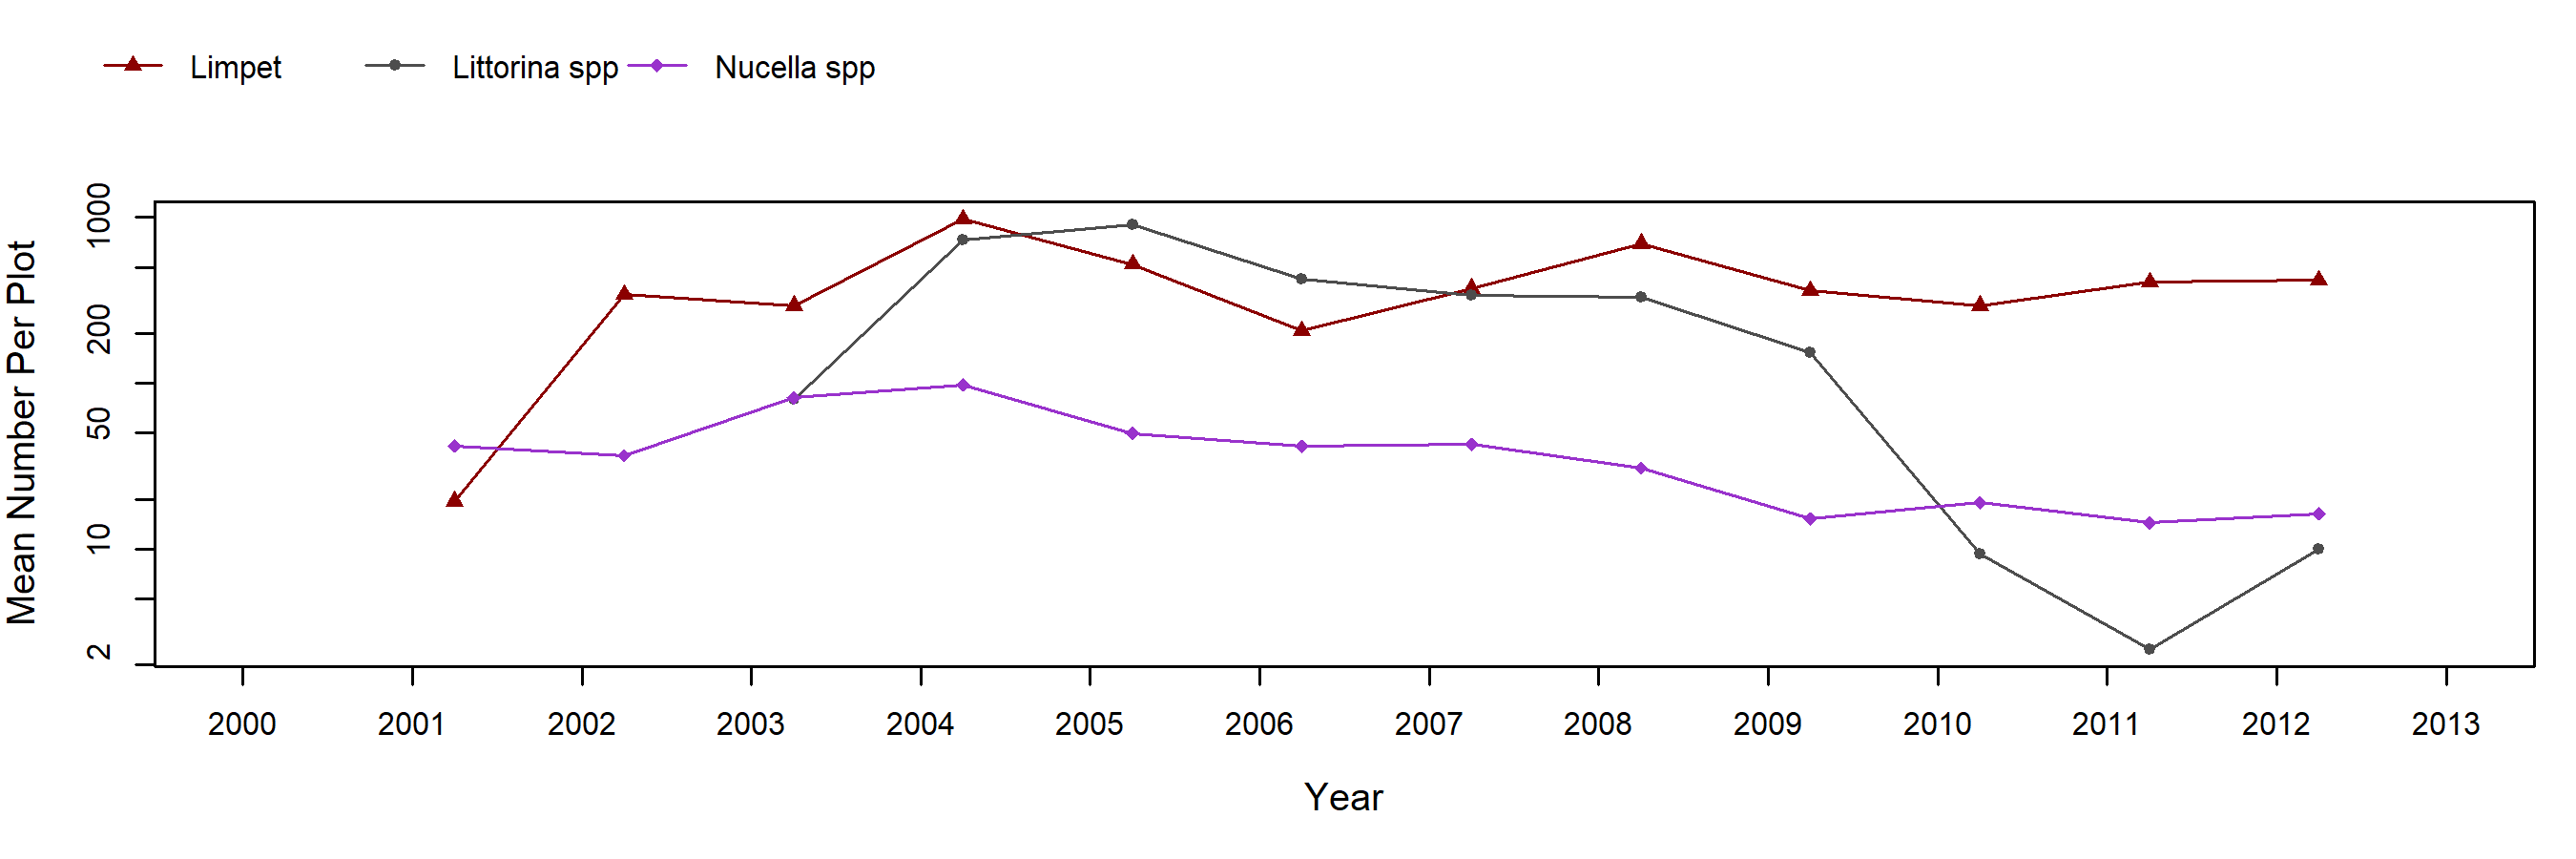
Fucus (Northern Rockweed) – motile invertebrate counts
Pelvetiopsis (Dwarf Rockweed) – percent cover
Pelvetiopsis (Dwarf Rockweed) – motile invertebrate counts
Endocladia (Turfweed) – percent cover
Endocladia (Turfweed) – motile invertebrate counts
Transects

Below are the trends observed for each Transect target species at this site. Long-Term trend graphs also include any species that reached a minimum of 25% cover during any single point in time within a given target species assemblage. Breaks in trend lines represent missed sampling events.
Phyllospadix (Surfgrass)
Species Counts and Sizes

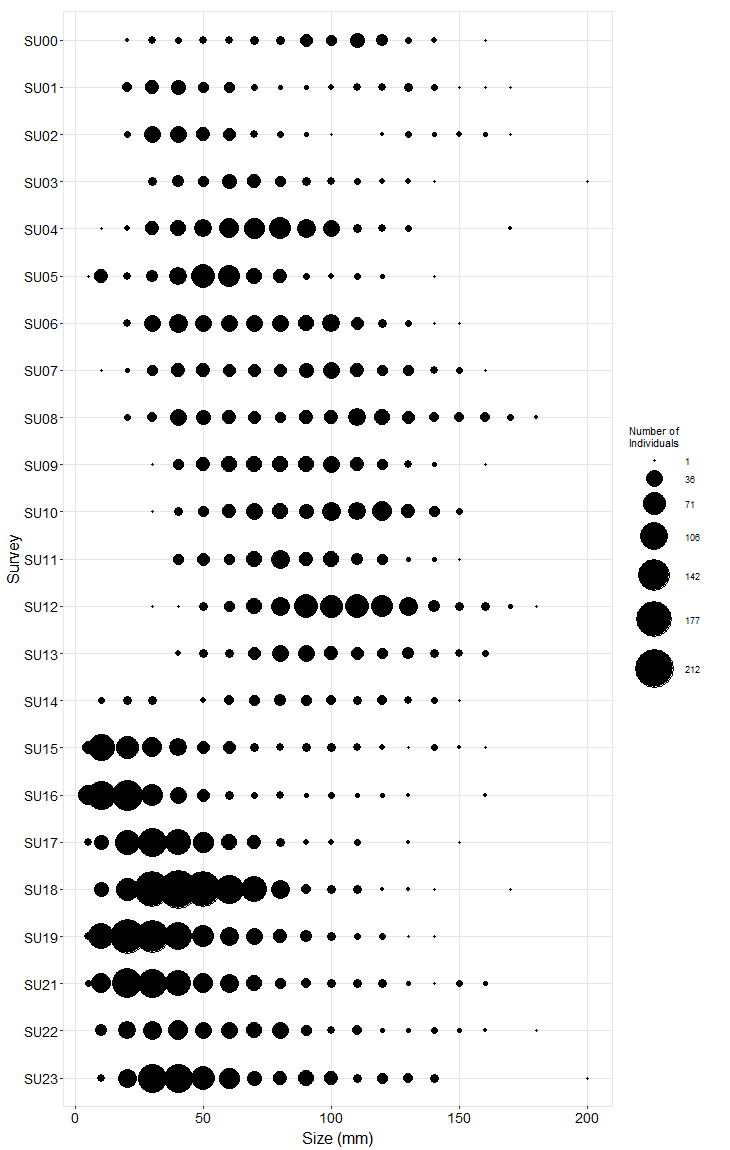
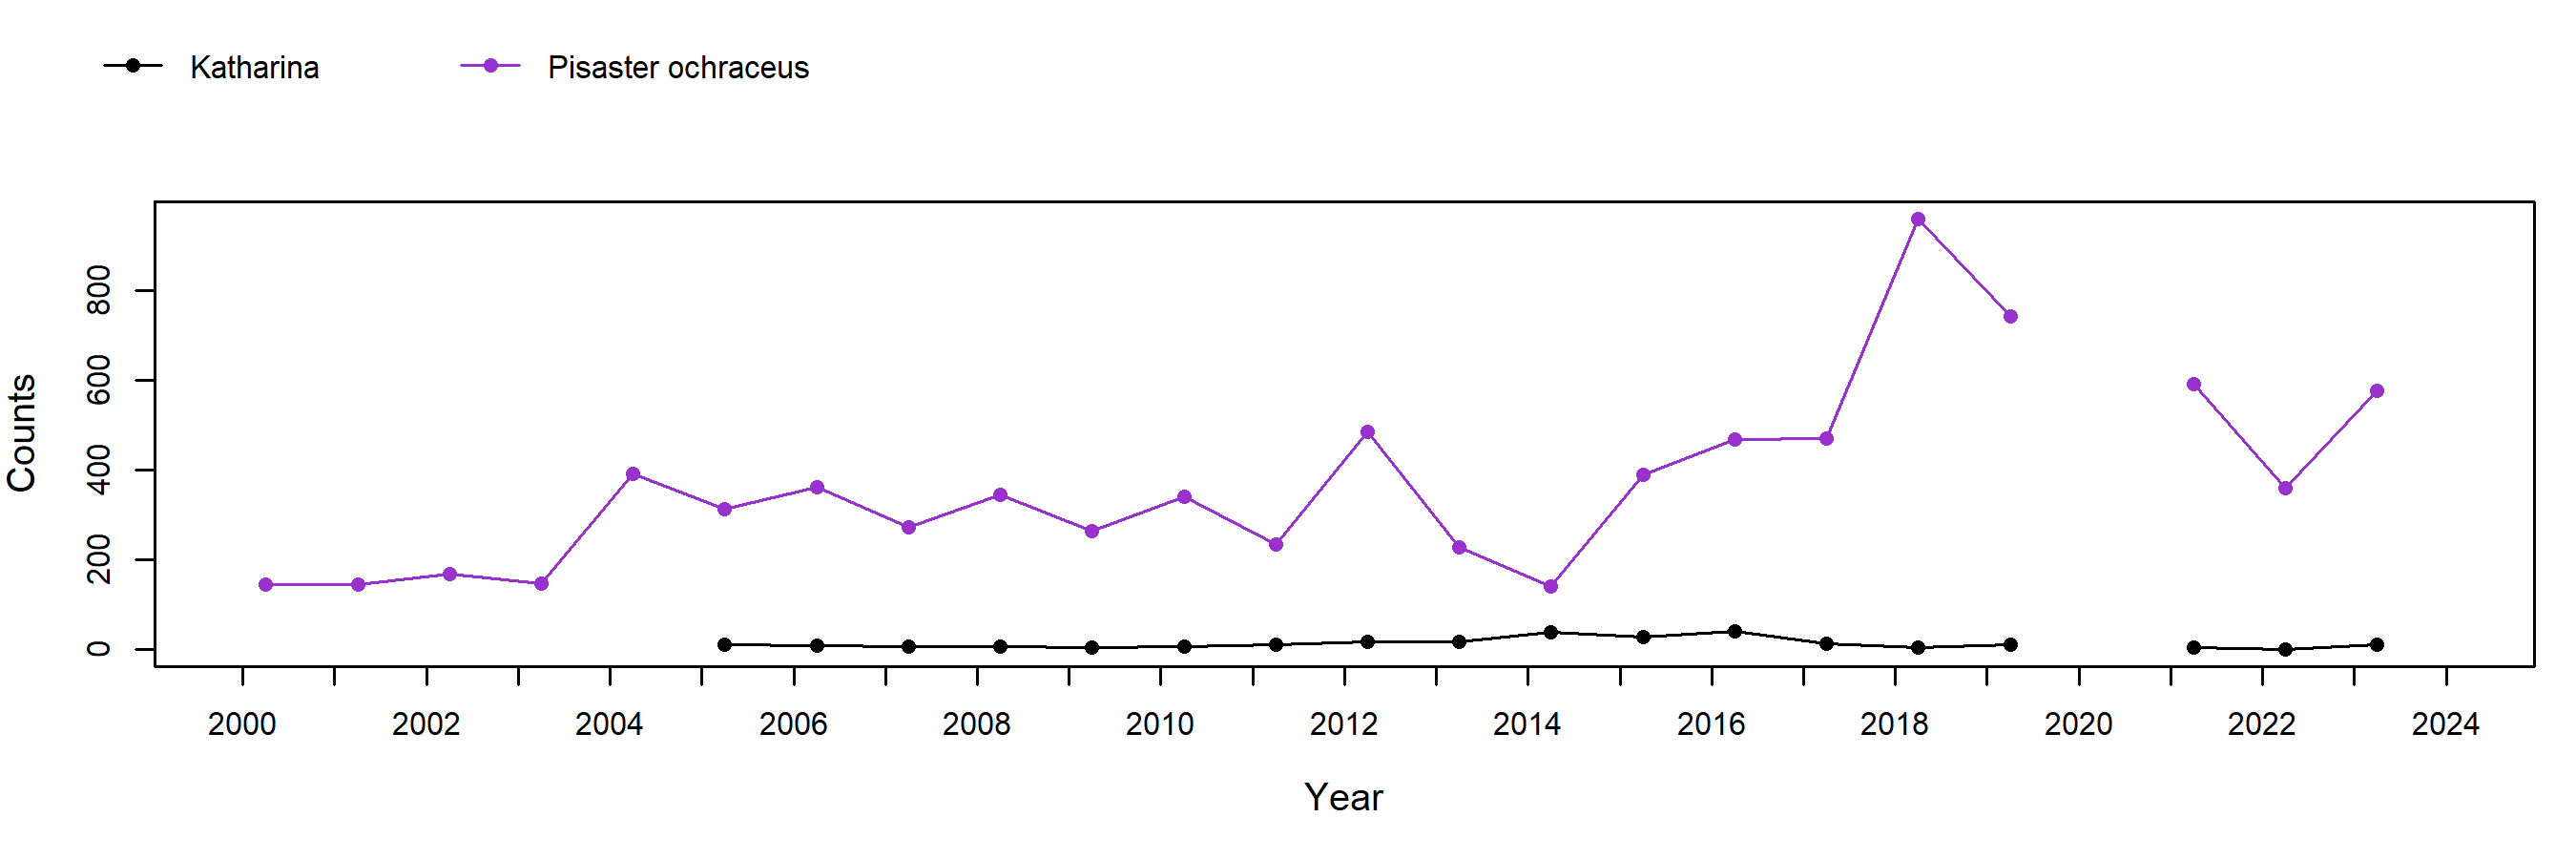
Species Counts and Sizes (where recorded) for Pisaster are shown below for this site. At some sites, other sea star species and Katharina are counted in addition to Pisaster. The sum of all individuals across all plots is displayed. Note that data gaps are represented by breaks in long-term count trend lines, but are not shown in size plots.
Pisaster ochraceus (Ochre Star) – counts
Pisaster ochraceus (Ochre Star) – sizes