Long-Term Monitoring Trend Graphs
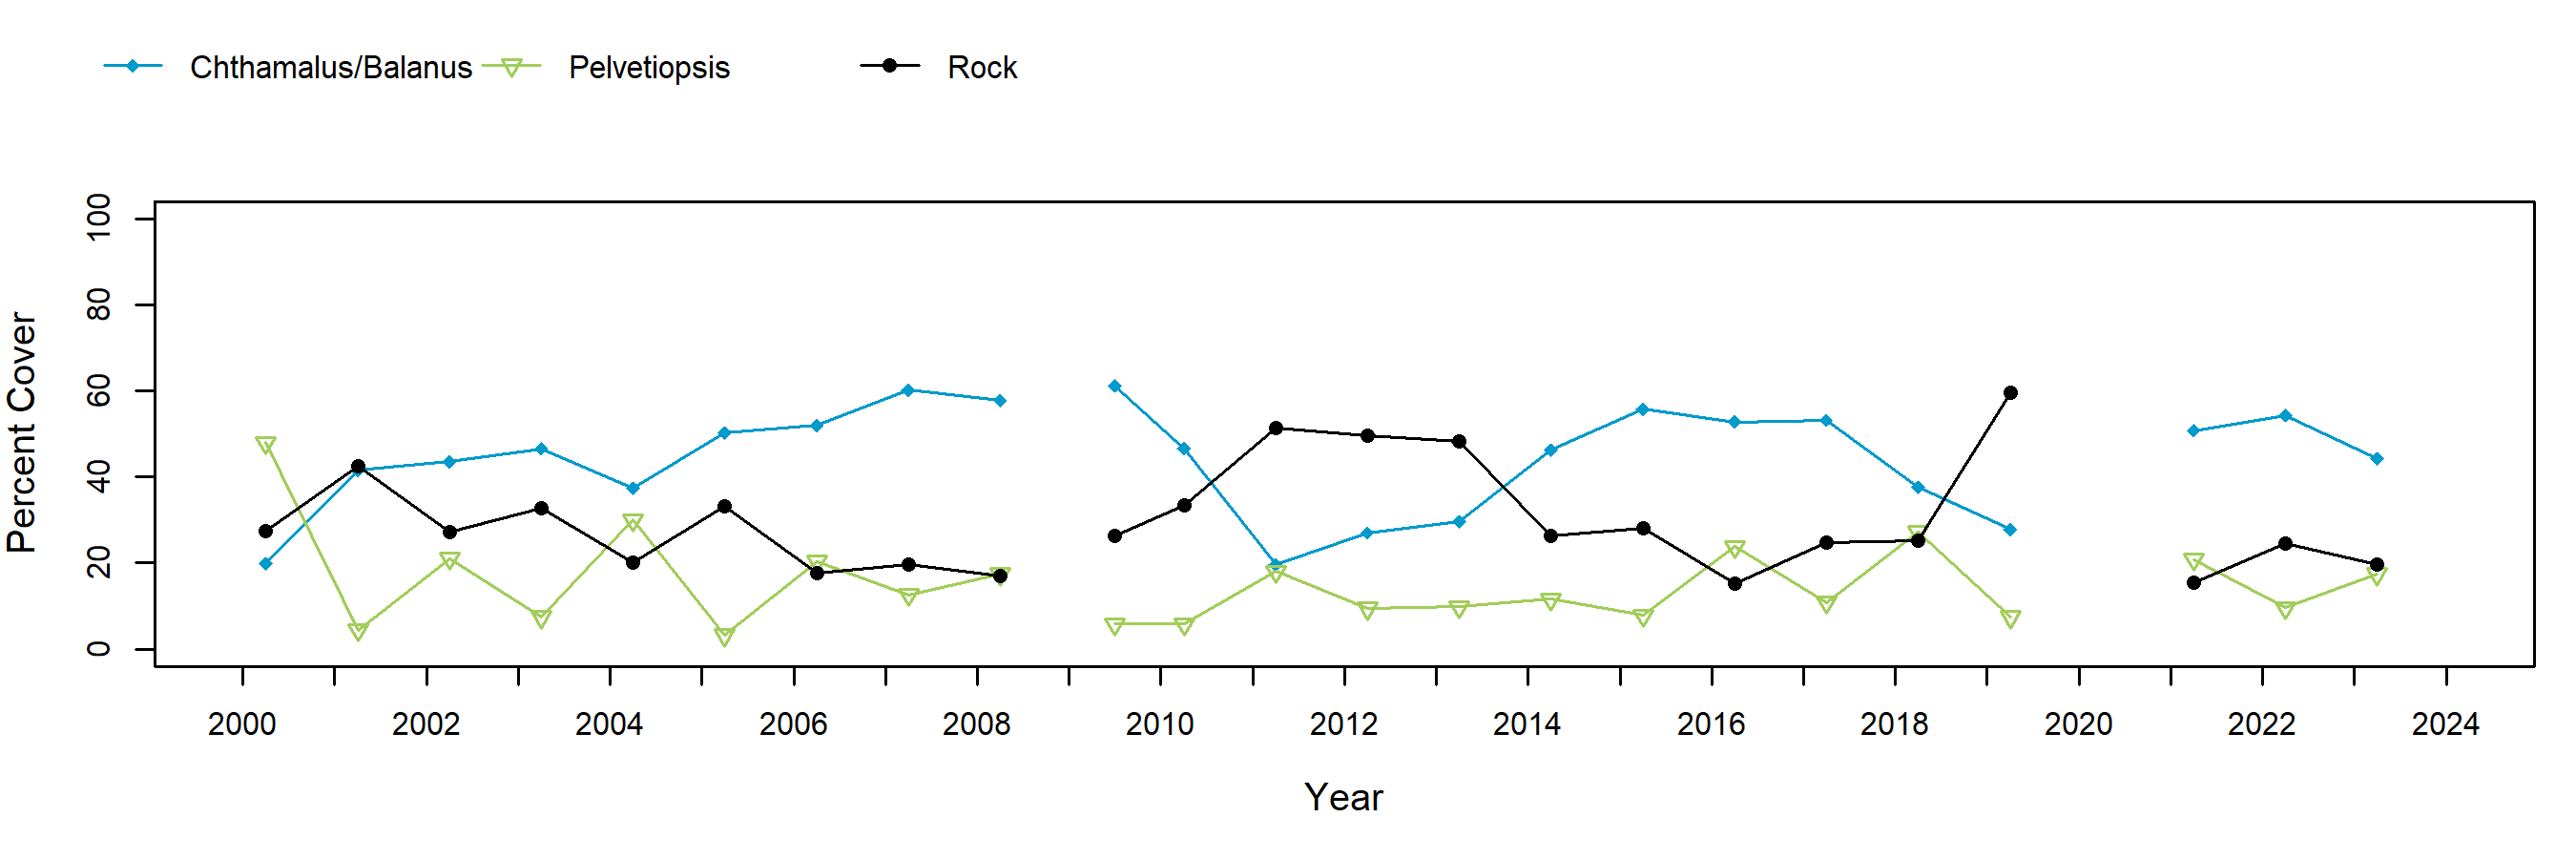
While barnacle and mussel plots have been relatively stable at Cape Arago in terms of cover of their respective target species, all photoplots targeting algae (Fucus, Pelvetioptis, Endocladia) experienced substantial target species decline. Declines occurred between 2000-2001 and have shown little to no signs of recovery throughout the 25-year period they have been monitored. Cape Arago is an important pinniped haul-out, and the number of seals and sea lions using the site, as well as the duration of time spent at the site by seals and sea lions, appears to be increasing. Pinnipeds impact rocky intertidal communities through physical disturbance (e.g., crushing organisms) and through excretion of waste, which can increase nitrate levels beyond tolerable limits. Fucus, Pelvetiopsis, and Endocladia plots now consist largely of bare space and acorn barnacles, a relatively short-lived group that can quickly recruit to newly disturbed patches on a reef. Mussels have periodically recruited to the Fucus plots but have not persisted.
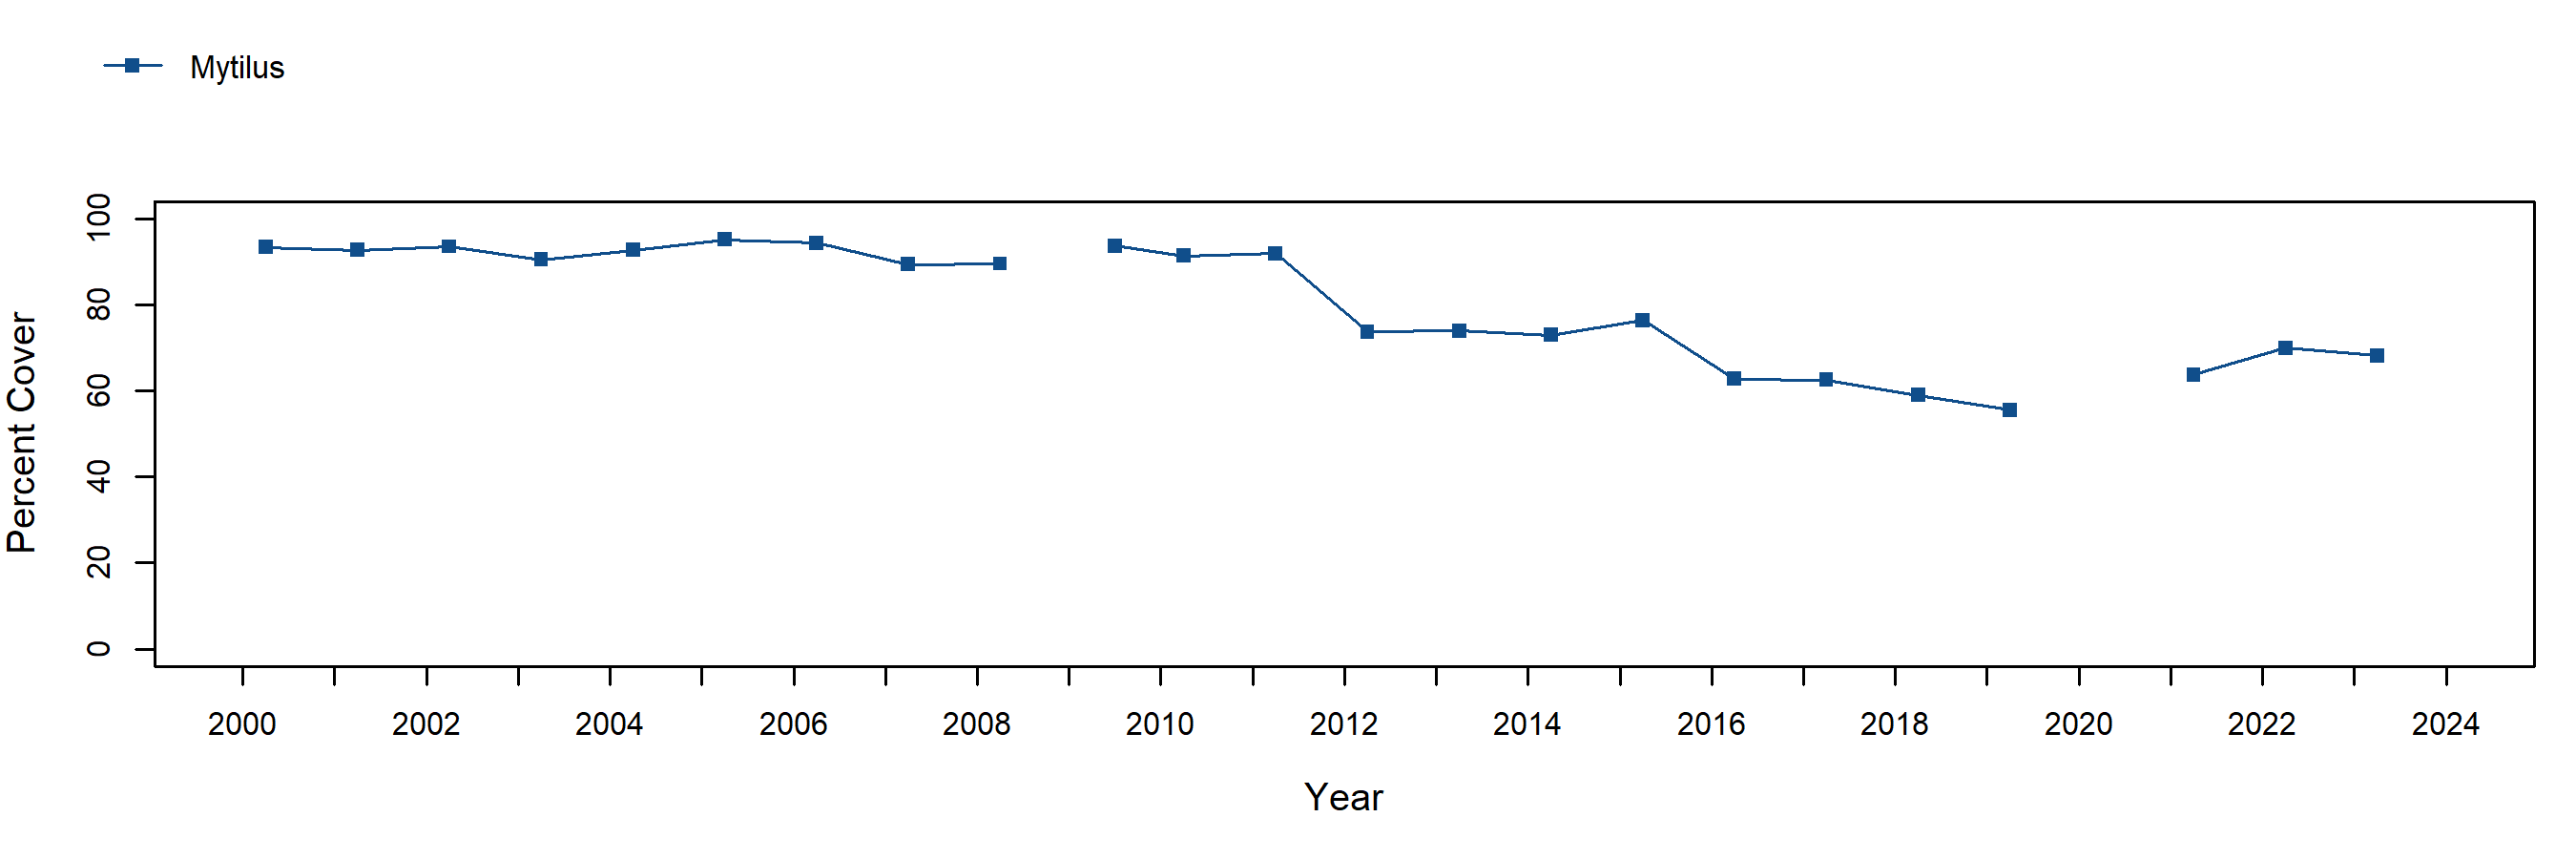
Mussel plots are located in a different section of reef from the other photo plots and were not heavily impacted by sea lions. Mean cover of Mytilus in these plots remained near 100% from 2000-2011 but experienced a gradual decline largely due to a substantial loss of mussels from plots 1 and 3.
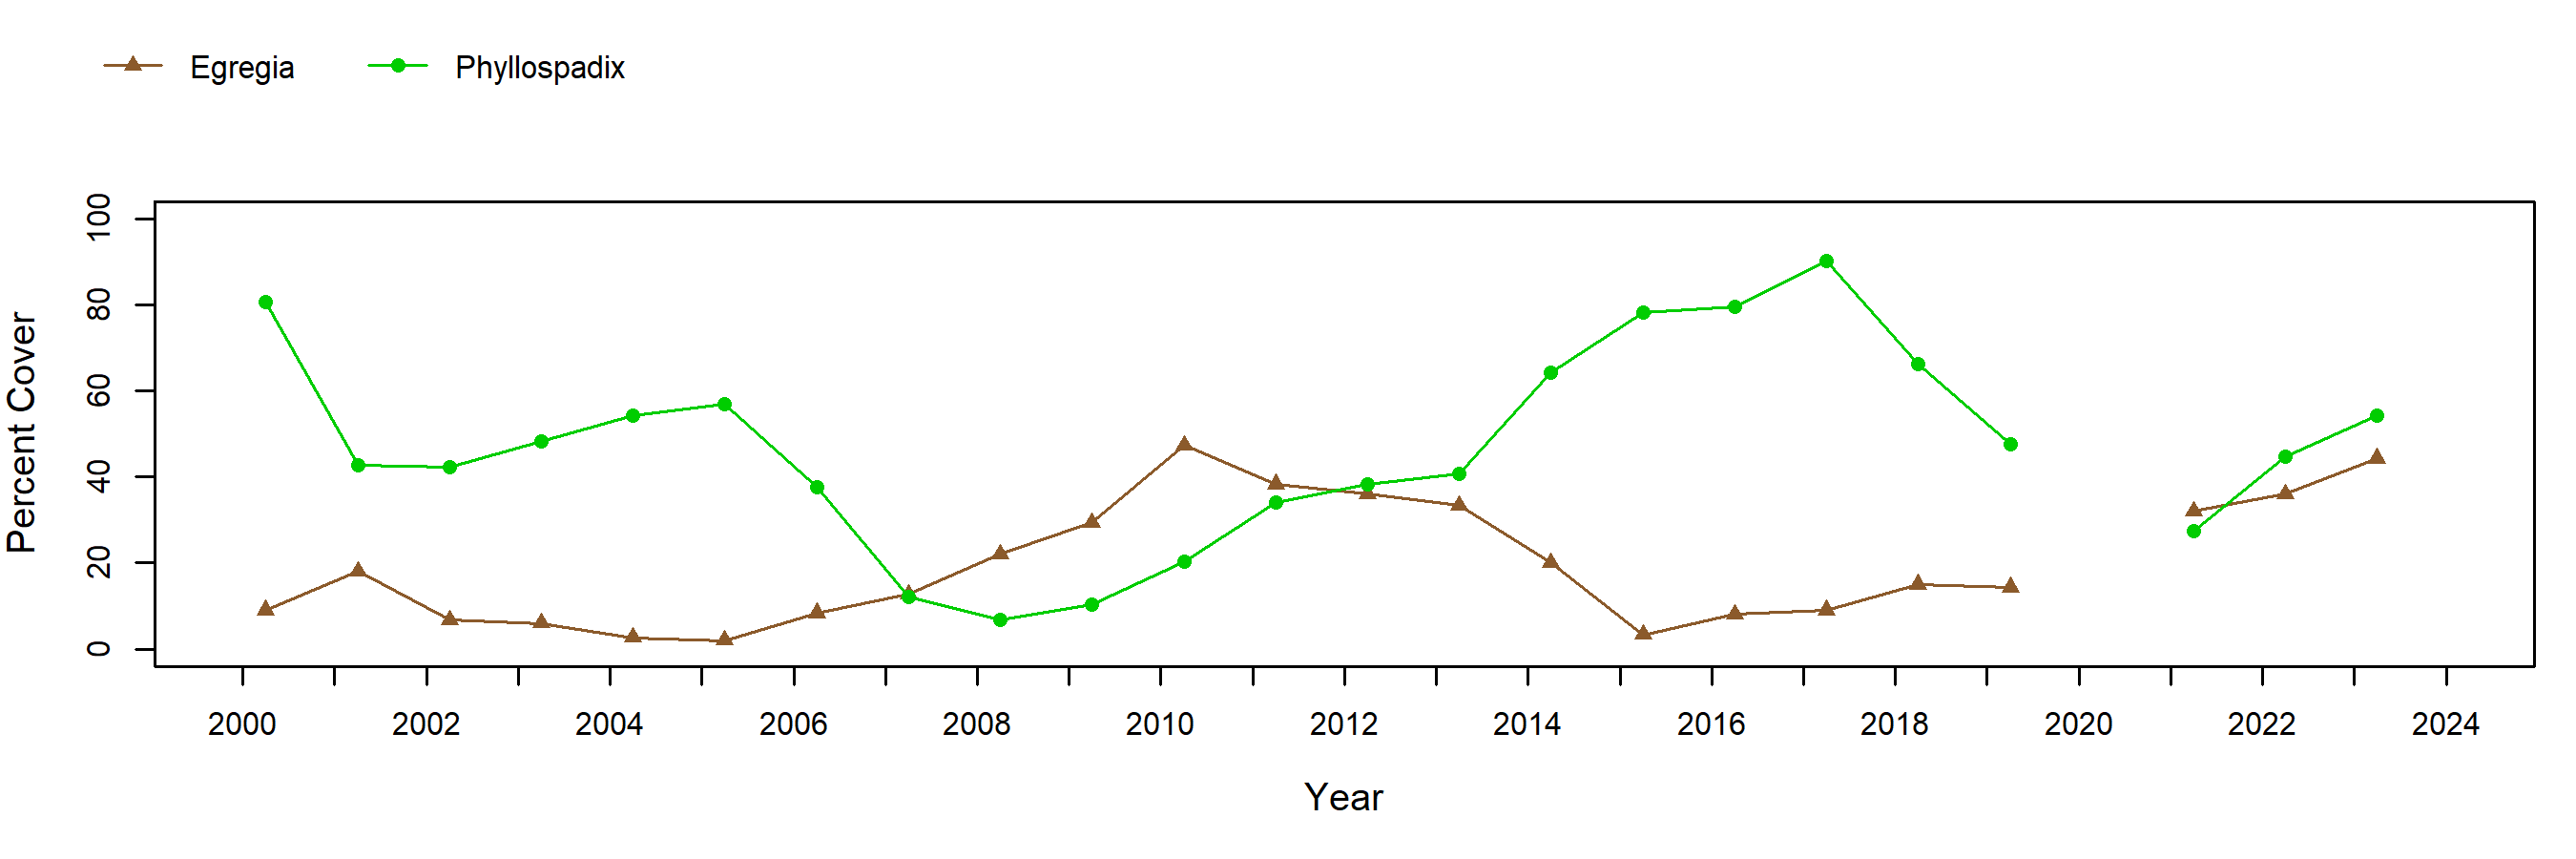
The Phyllospadix transects at Cape Arago are located in a low-lying, calm bay just upcoast from the main site. It is an area rich in low intertidal/subtidal algae and is unlike our surfgrass transect locations at most other sites in that it is not dominated by Phyllospadix. This difference is reflected in the long-term trend graph—surfgrass has remained relatively high in cover throughout most of the 25-year sampling period, but low intertidal algae, particularly the boa kelp, Egregia, have also been key players in the community.
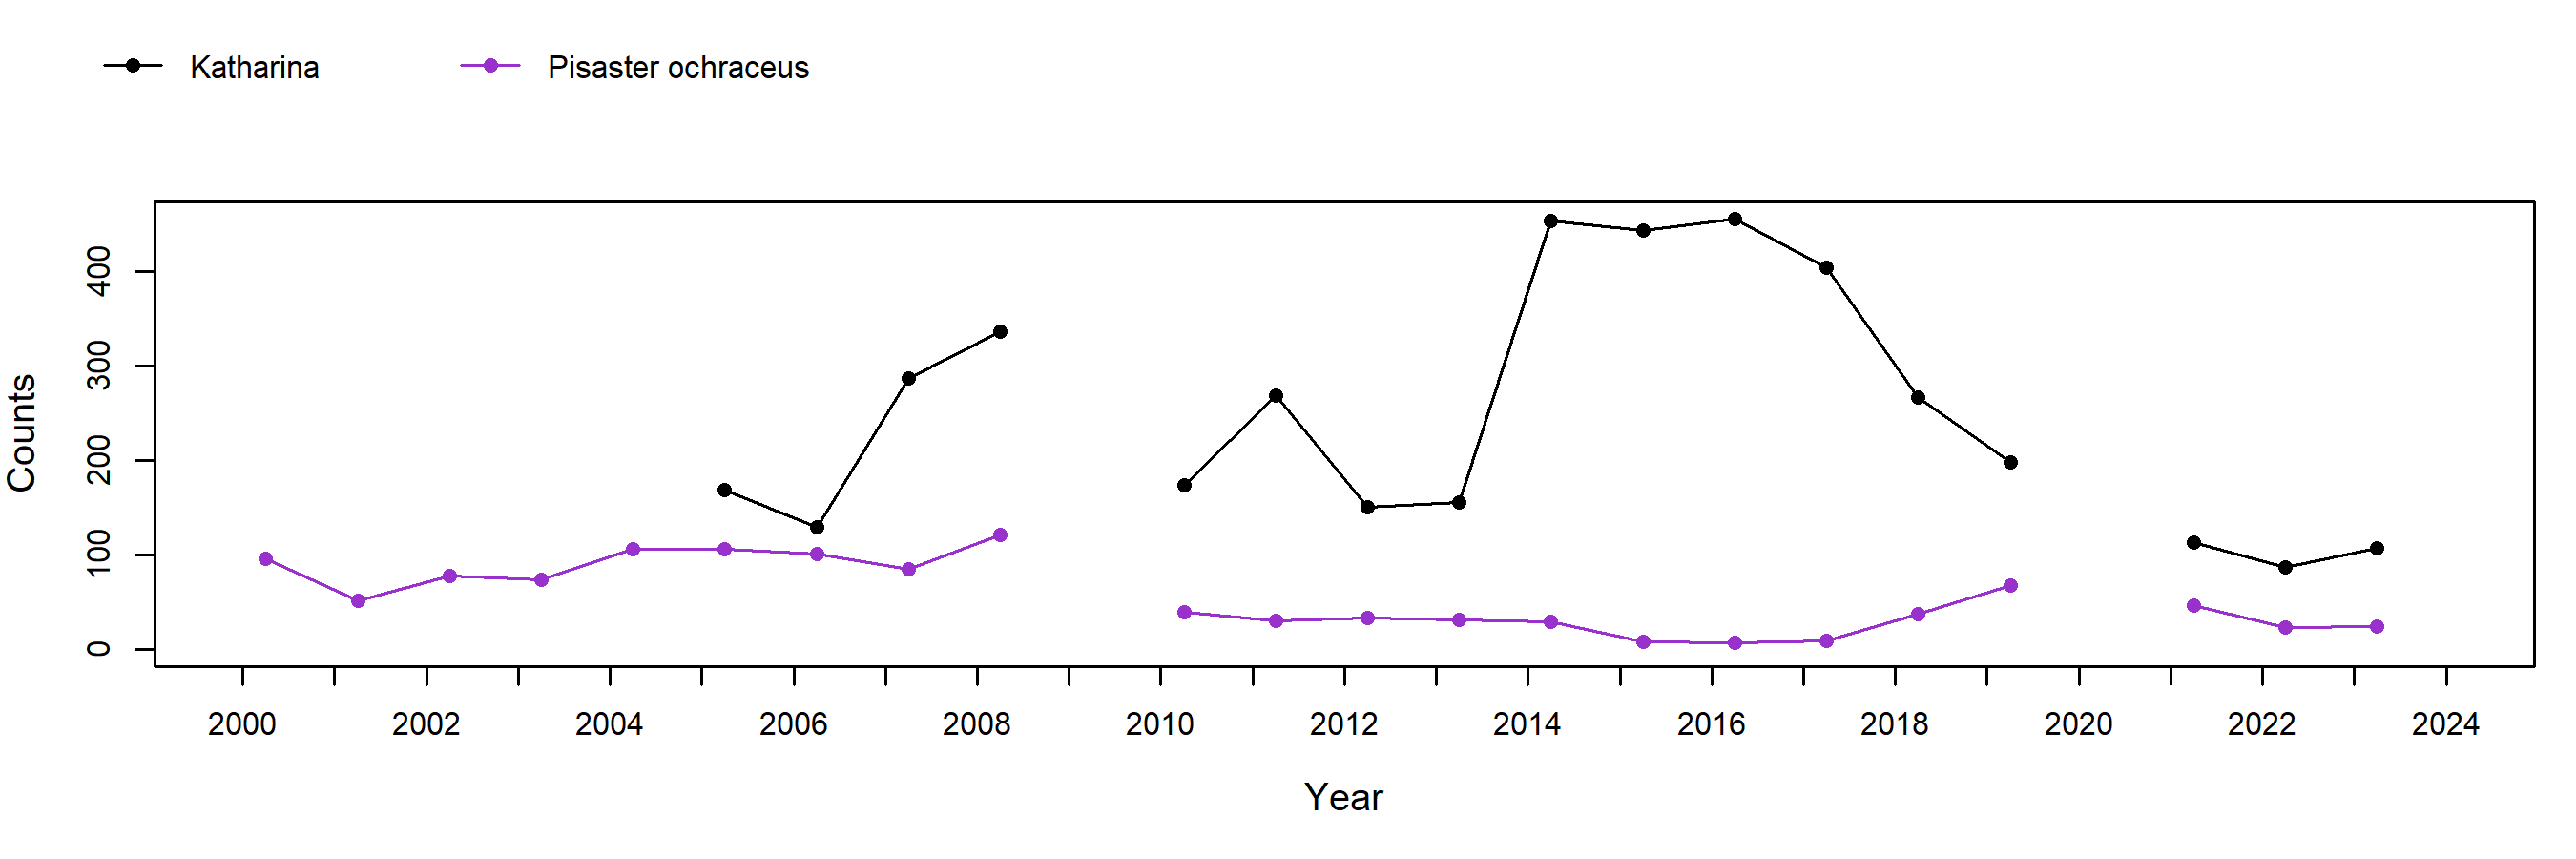
Ochre stars in the sea star plots were relatively common overall but experienced a decline in numbers between 2008-2010 (Cape Arago could not be sampled in 2009 due to sea lions hauled out on the reef). Ochre star counts declined further due to Sea Star Wasting Syndrome in 2015, but a recruitment event prior to 2019 resulted in the largest number of juveniles (< 50 mm radius) ever recorded in plots at this site. Unfortunately, these juveniles did not appear to survive over the long-term, and the sea star population at Cape Arago was at an all-time low as of summer 2024. The katy chiton, Katharina tunicata, was extremely abundant in the sea star plots, particularly in 2014-2017.
In order to standardize species resolution across all MARINe groups and over time, some species (typically rare) were lumped for graphical presentation of Long-Term monitoring data. See lumped categories for definitions (some variation occurs between methods and over time).
If you experience any barriers accessing the trend graphs below, please contact (pacificr@ucsc.edu) for help.
Photo Plots

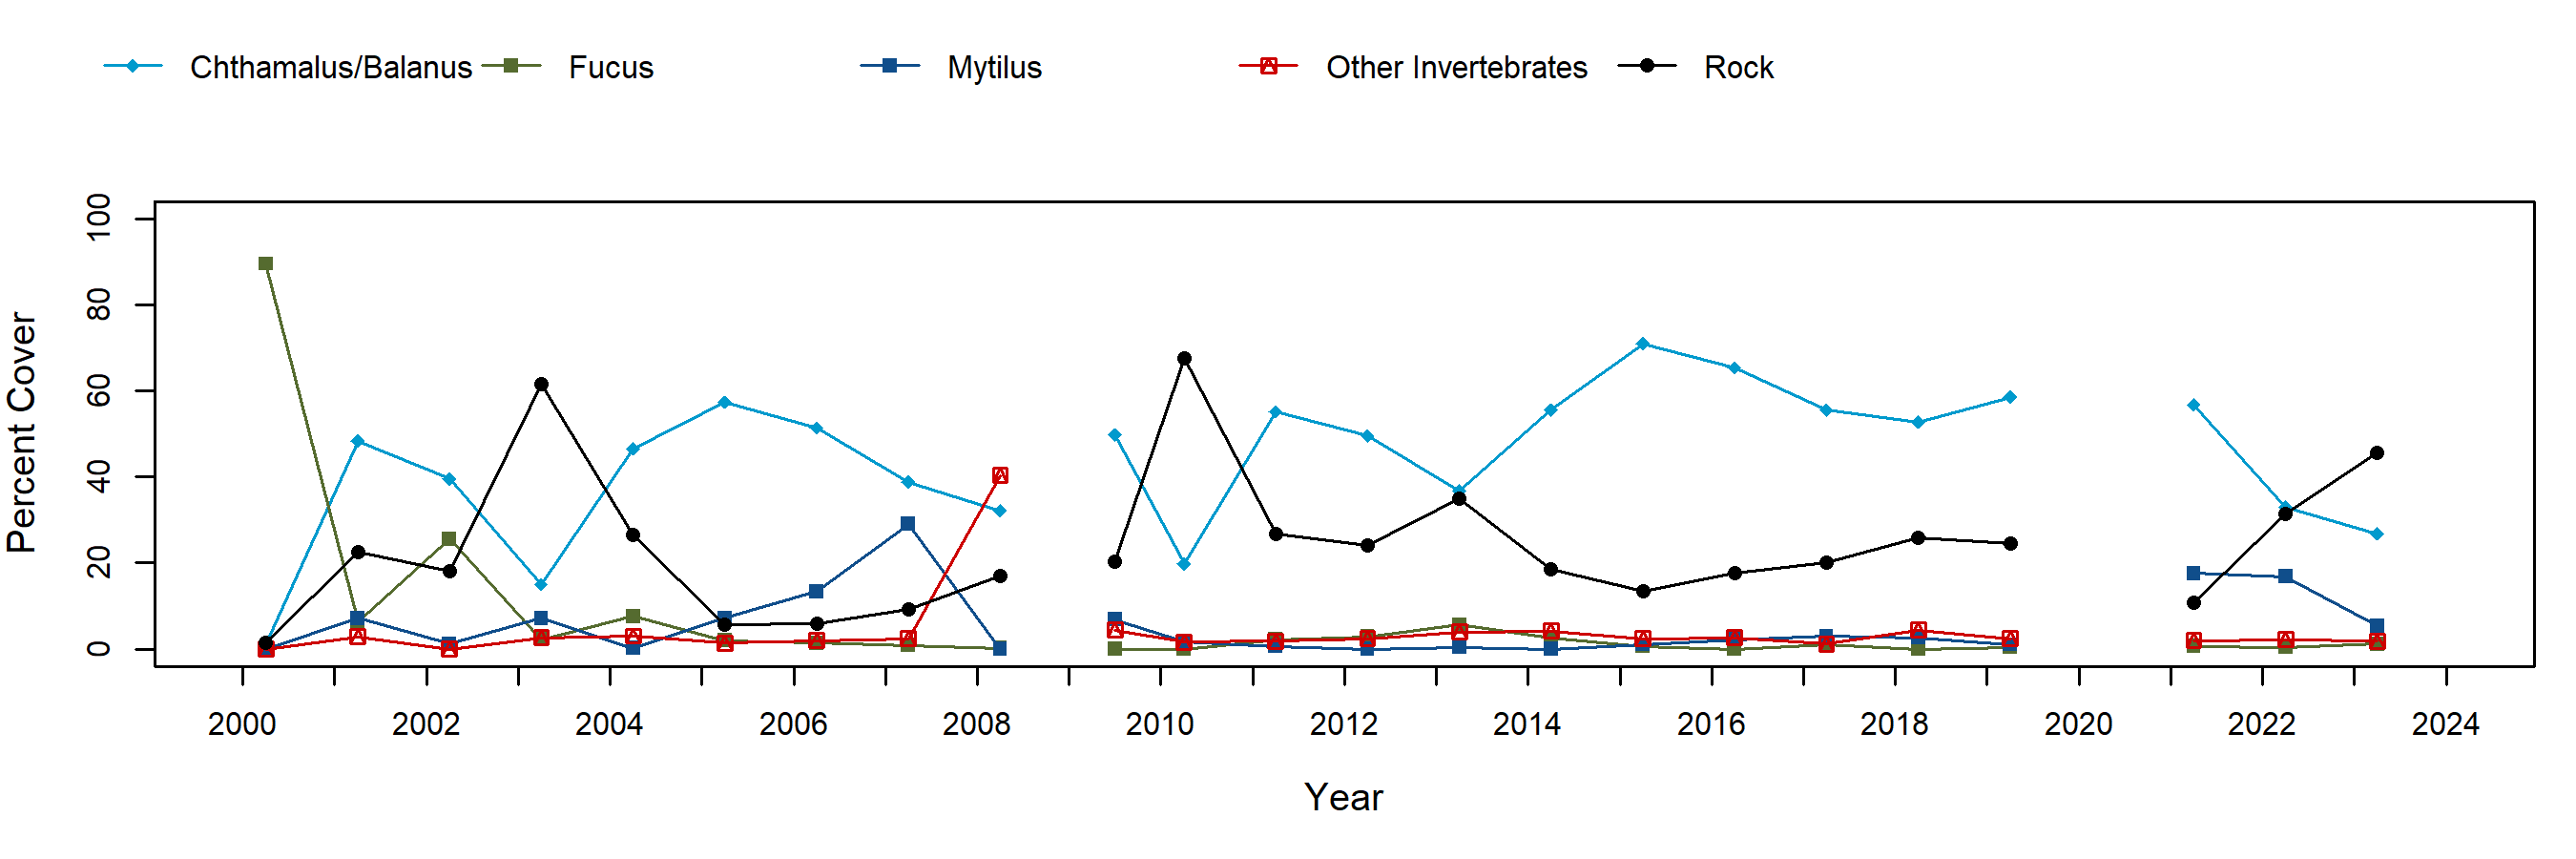
Below are the trends observed for each Photo Plot target species at this site. Long-Term percent cover trend graphs also include any species that reached a minimum of 25% cover during any single point in time within a given target species assemblage. Breaks in trend lines represent missed sampling events. For additional species observed that did not meet this 25% threshold, please use the Graphing Tool.
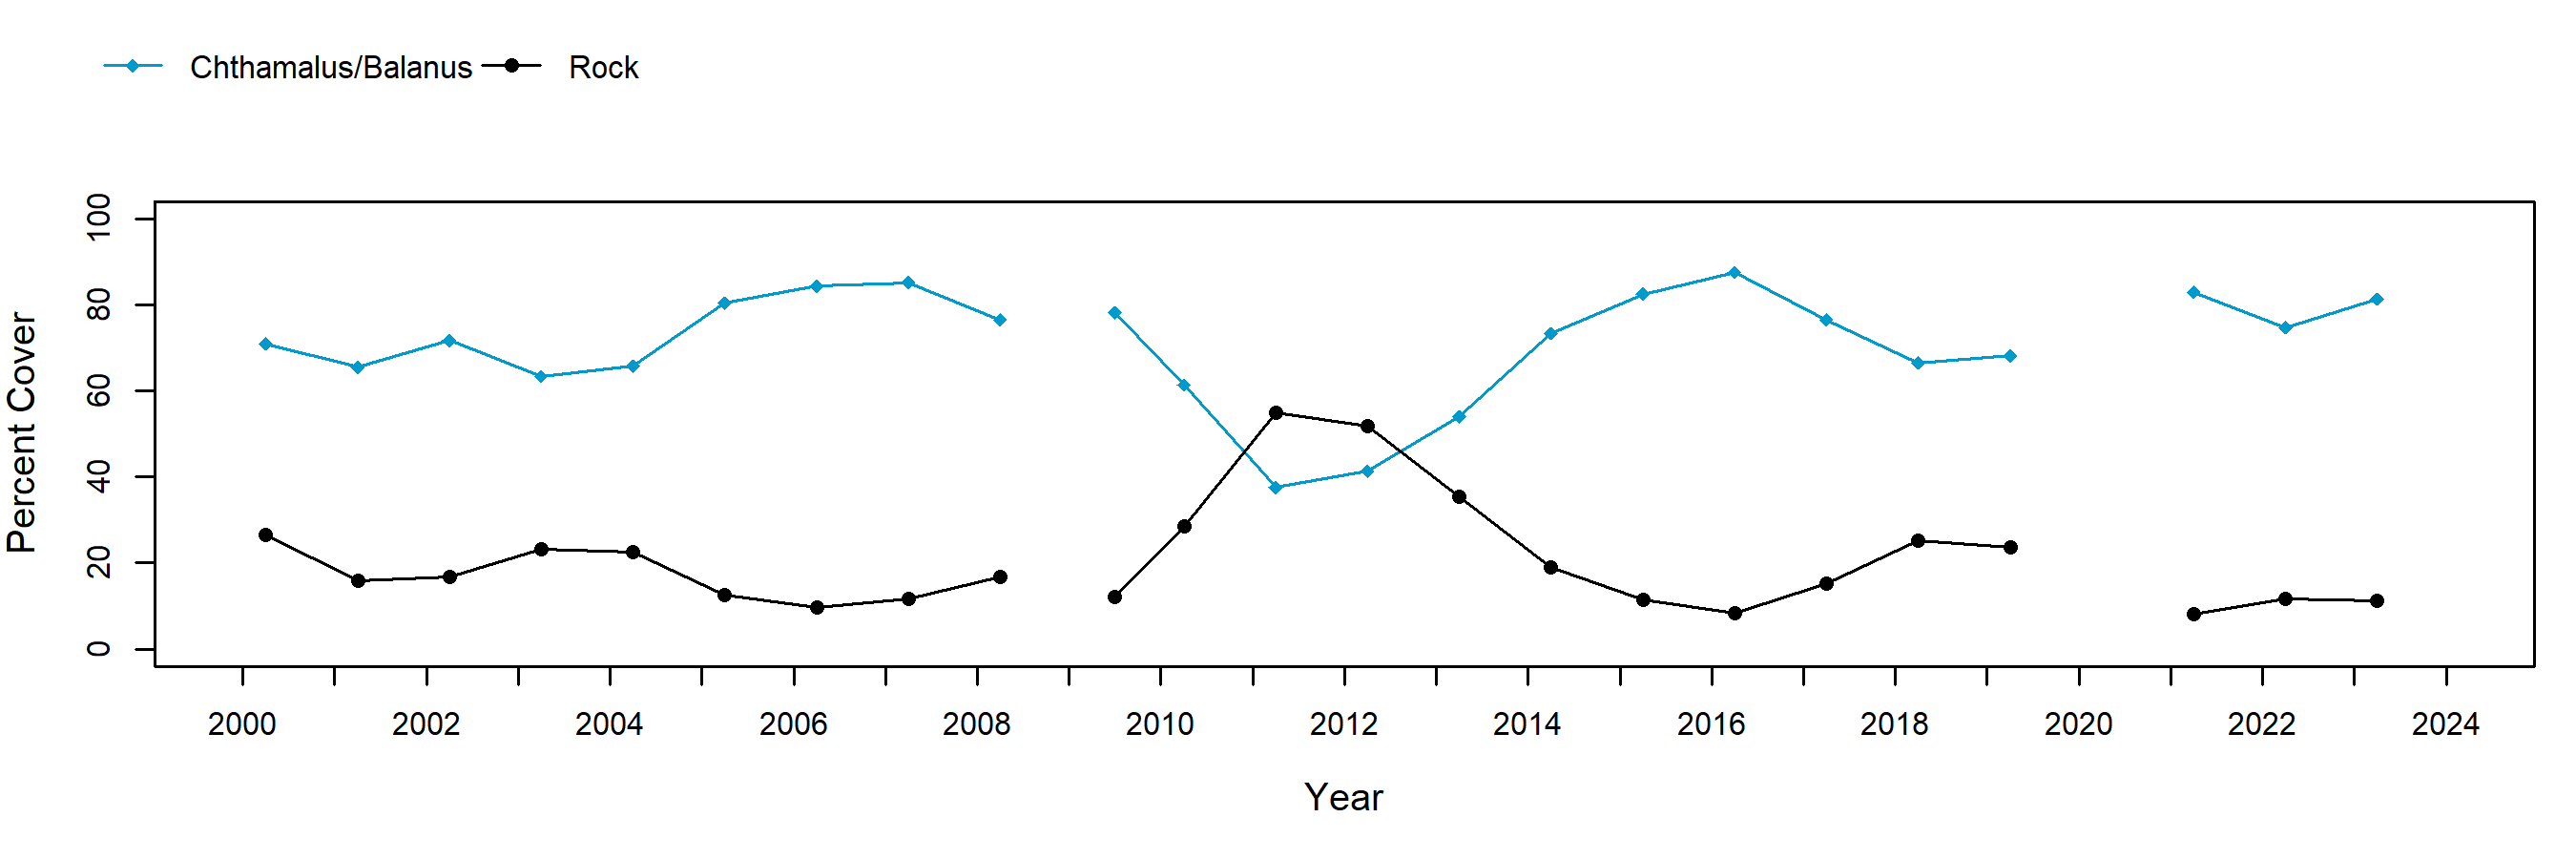
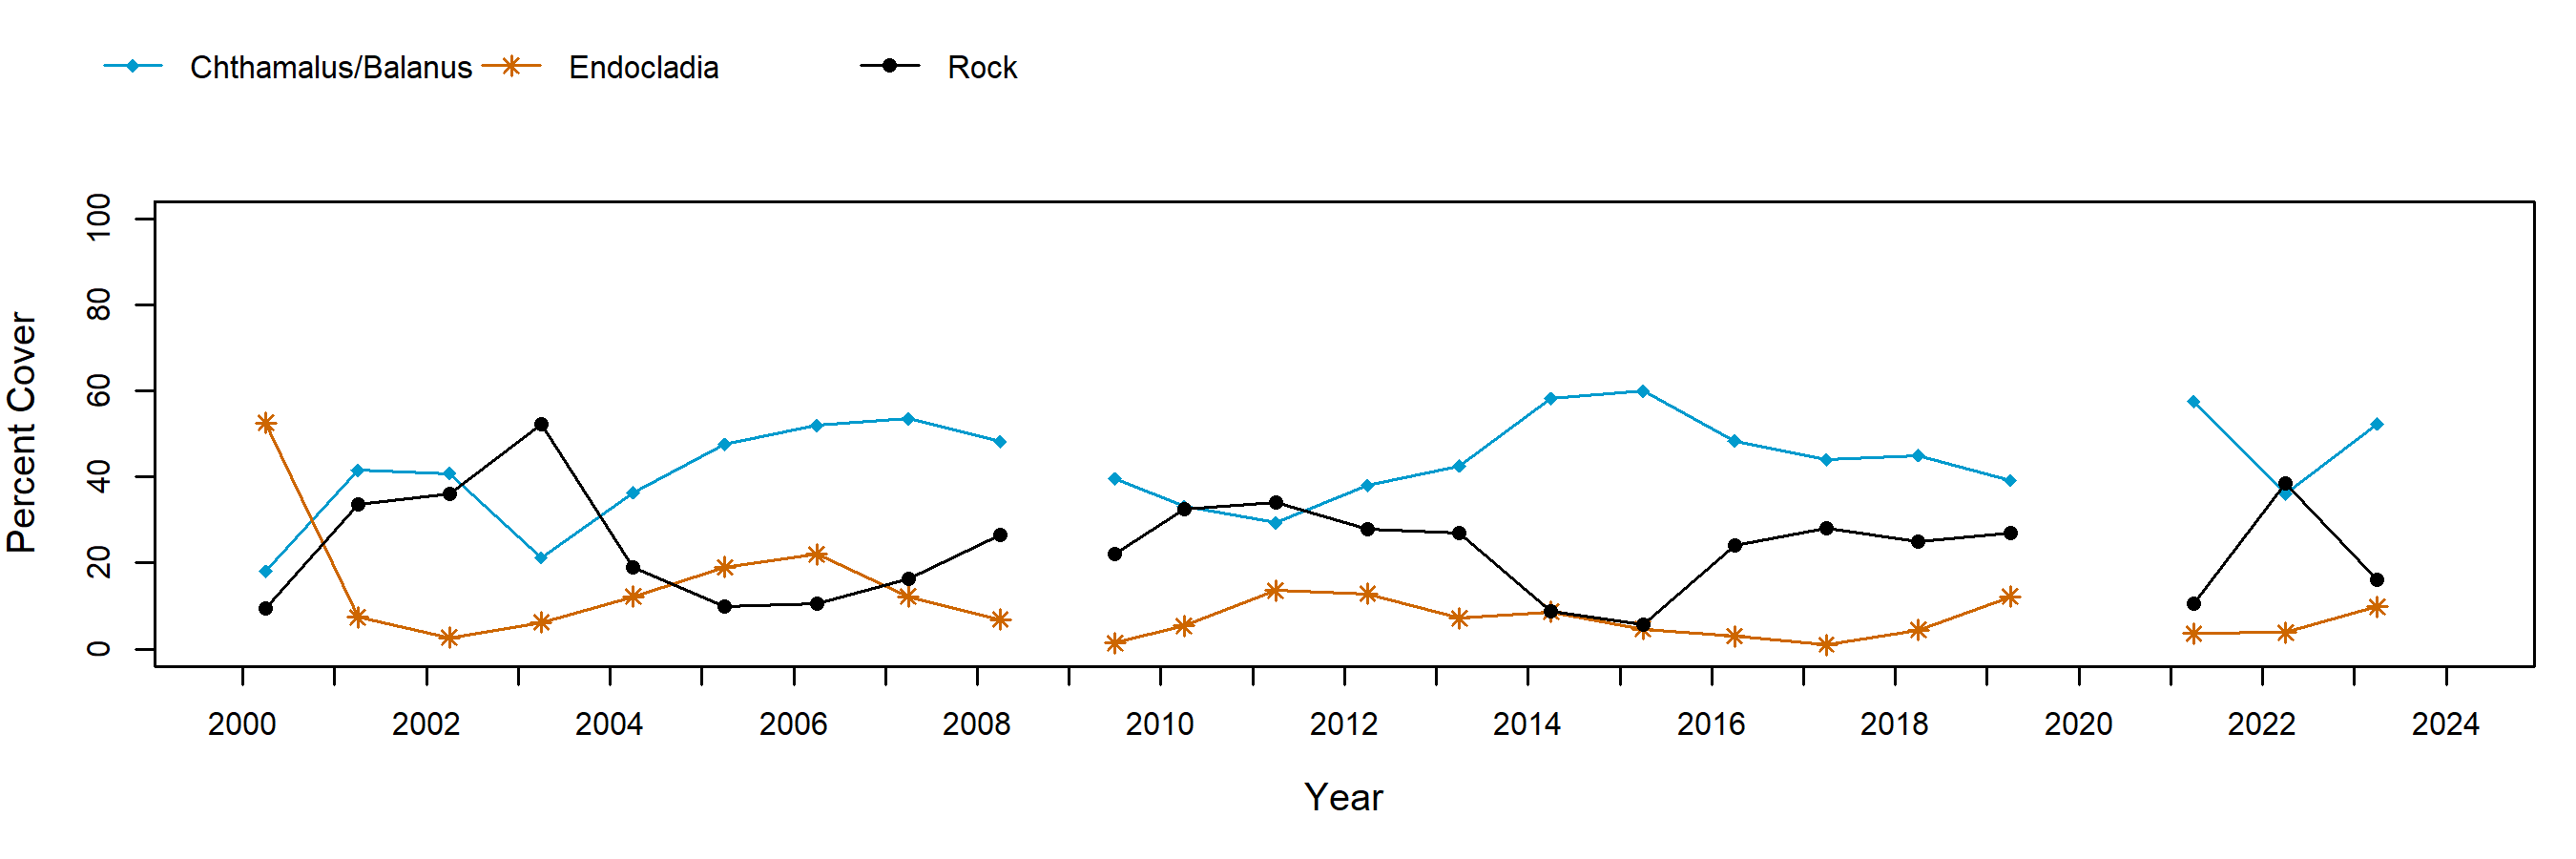
Chthamalus/Balanus (Acorn Barnacles) – percent cover
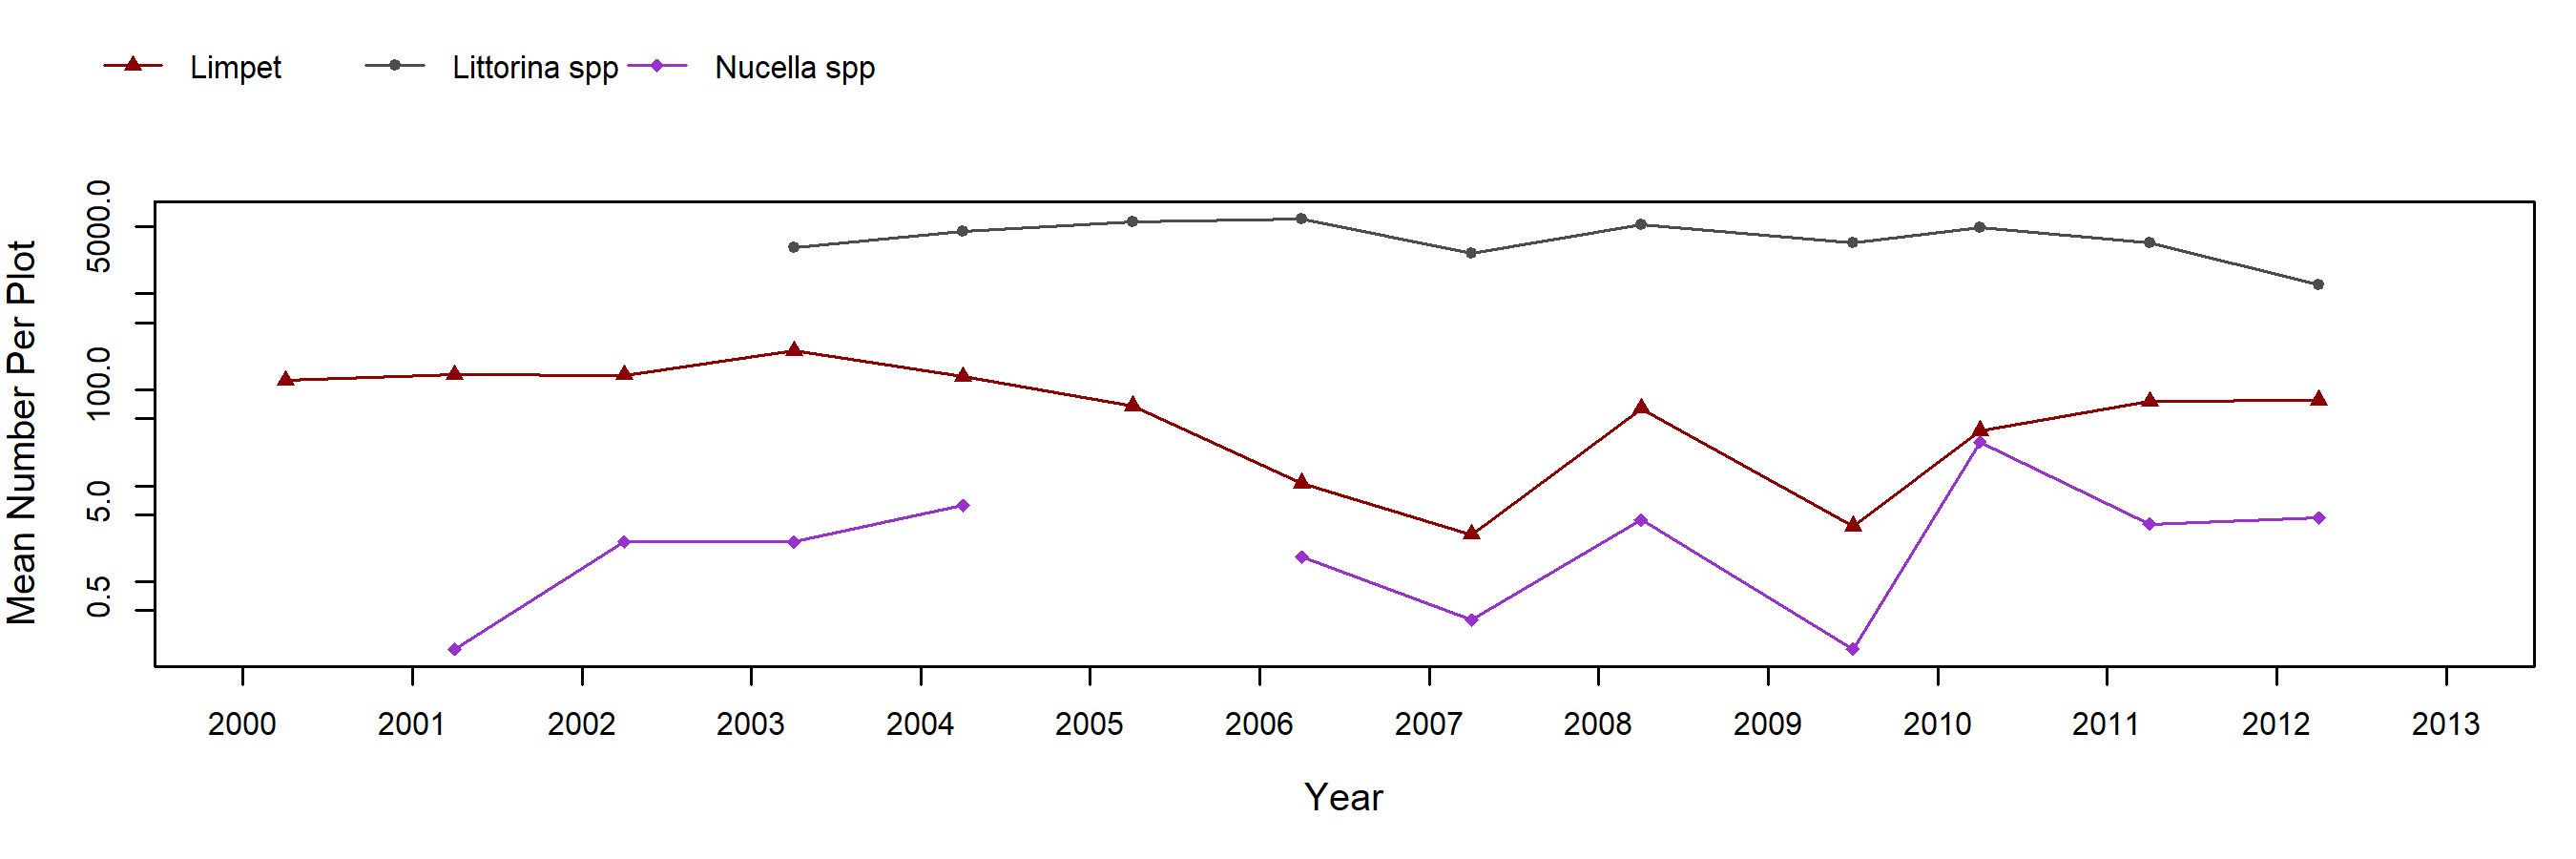
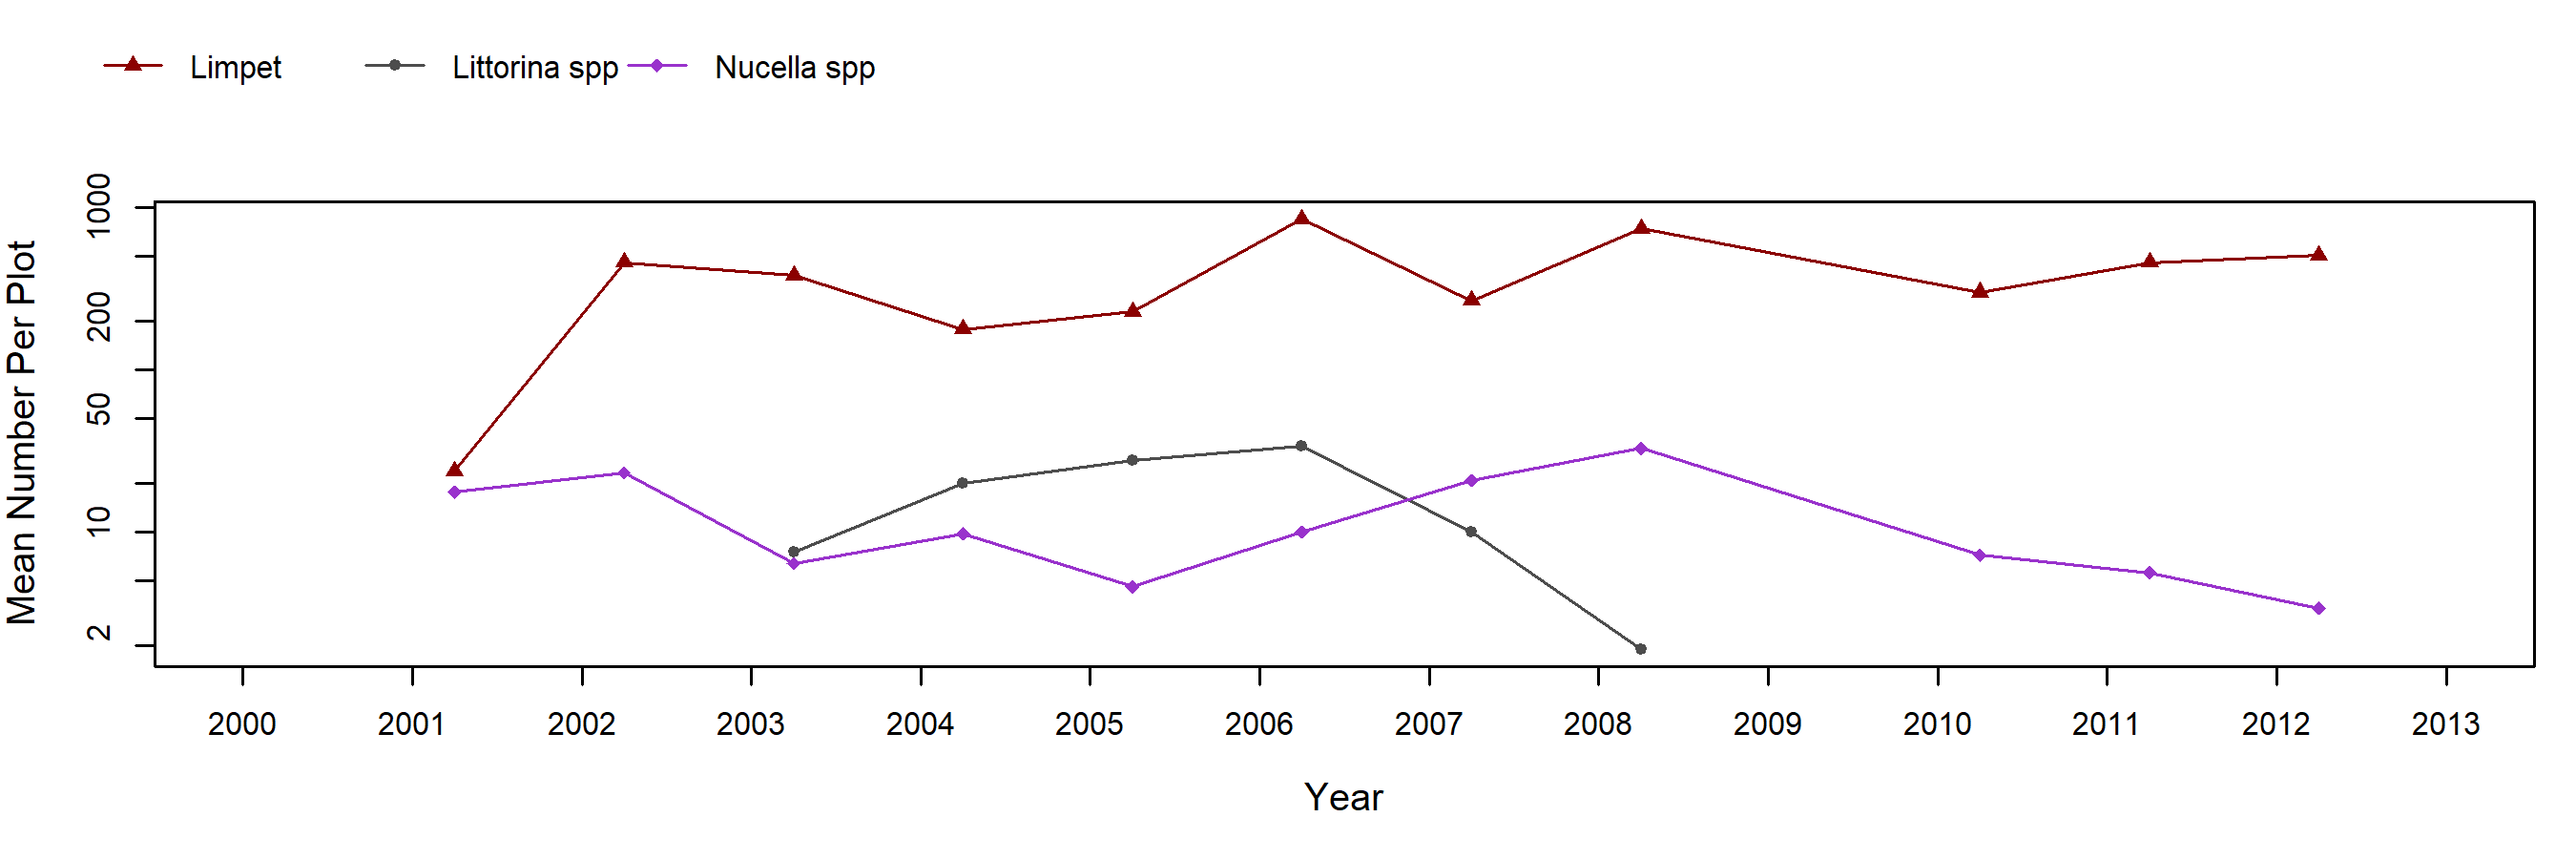
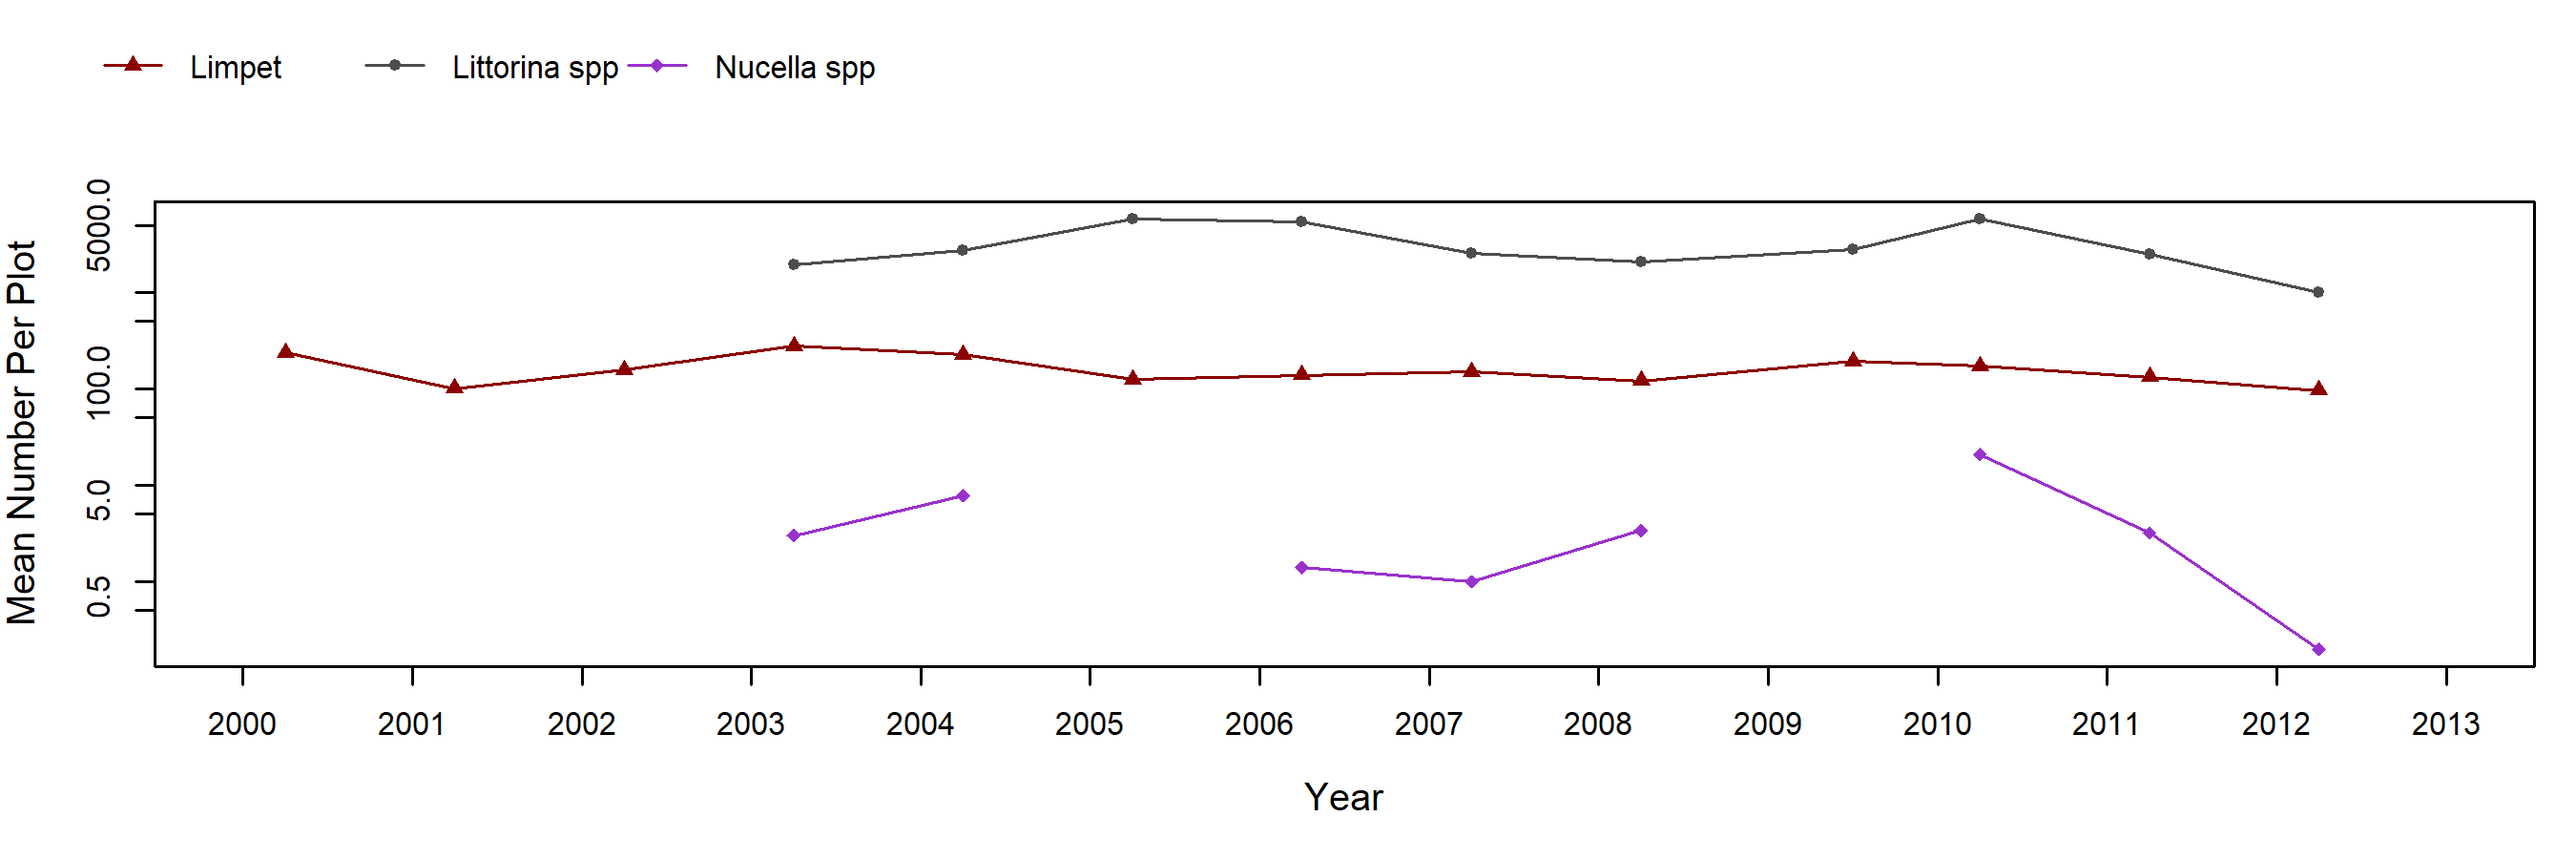
Chthamalus/Balanus (Acorn Barnacles) – motile invertebrate counts
Mytilus (California Mussel) – percent cover
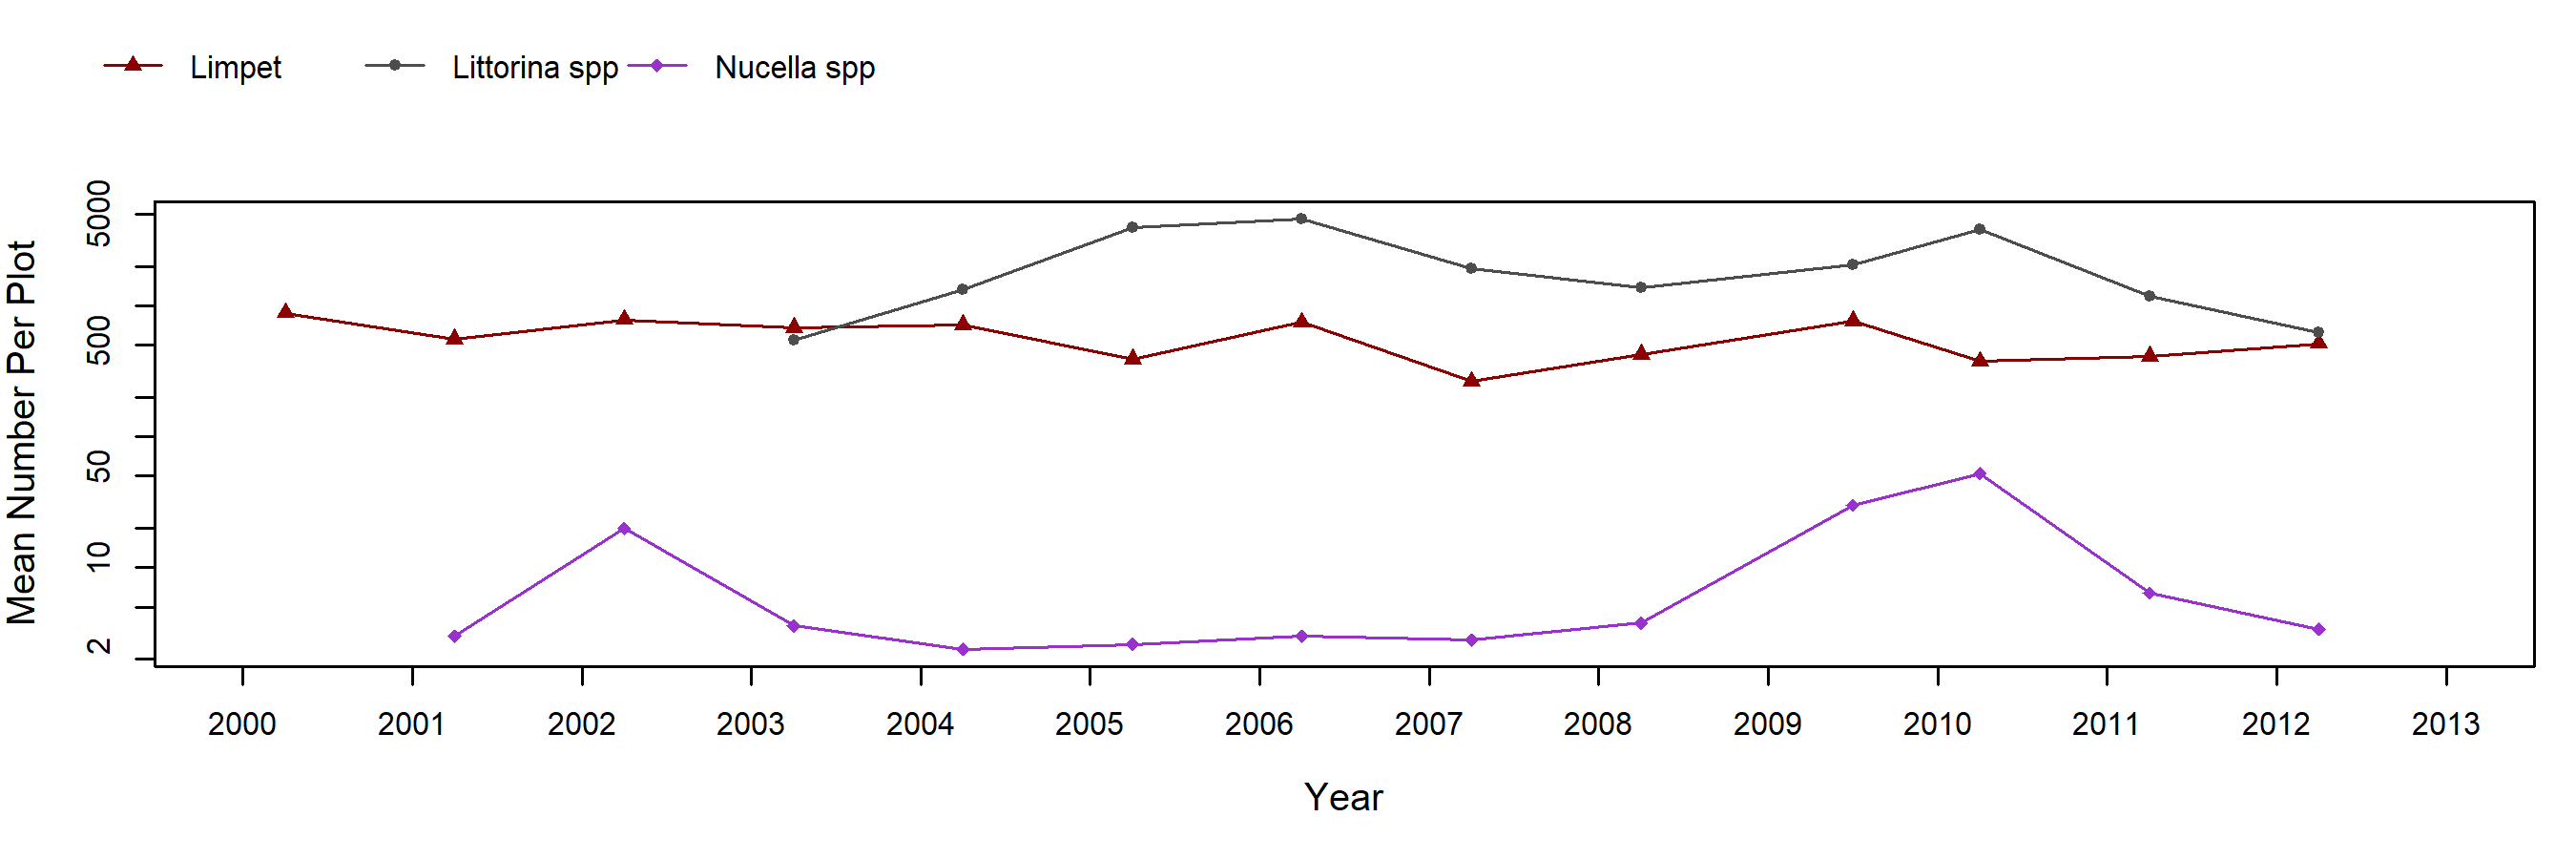
Mytilus (California Mussel) – motile invertebrate counts
Fucus (Northern Rockweed) – percent cover
Fucus (Northern Rockweed) – motile invertebrate counts
Pelvetiopsis (Dwarf Rockweed) – percent cover
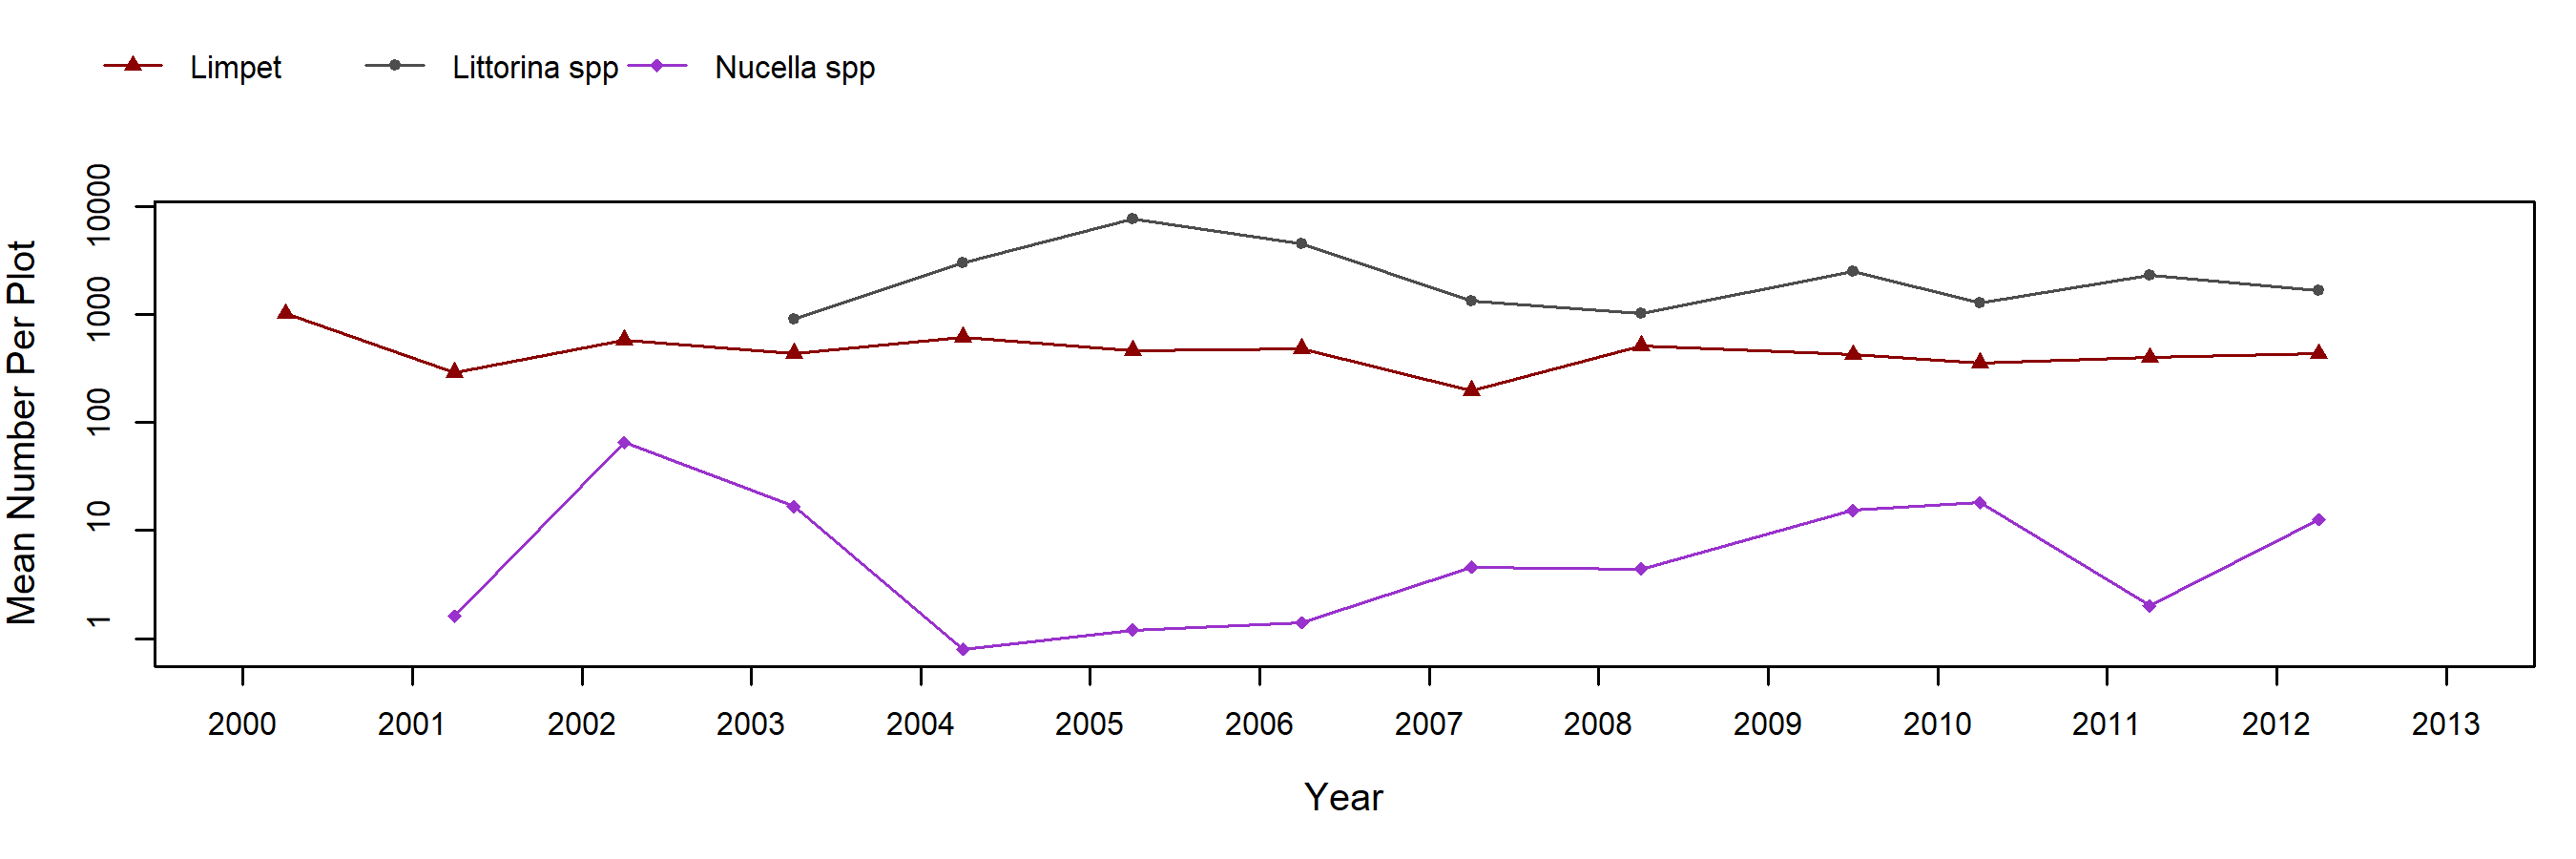
Pelvetiopsis (Dwarf Rockweed) – motile invertebrate counts
Endocladia (Turfweed) – percent cover
Endocladia (Turfweed) – motile invertebrate counts
Transects

Below are the trends observed for each Transect target species at this site. Long-Term trend graphs also include any species that reached a minimum of 25% cover during any single point in time within a given target species assemblage. Breaks in trend lines represent missed sampling events.
Phyllospadix (Surfgrass)
Species Counts and Sizes

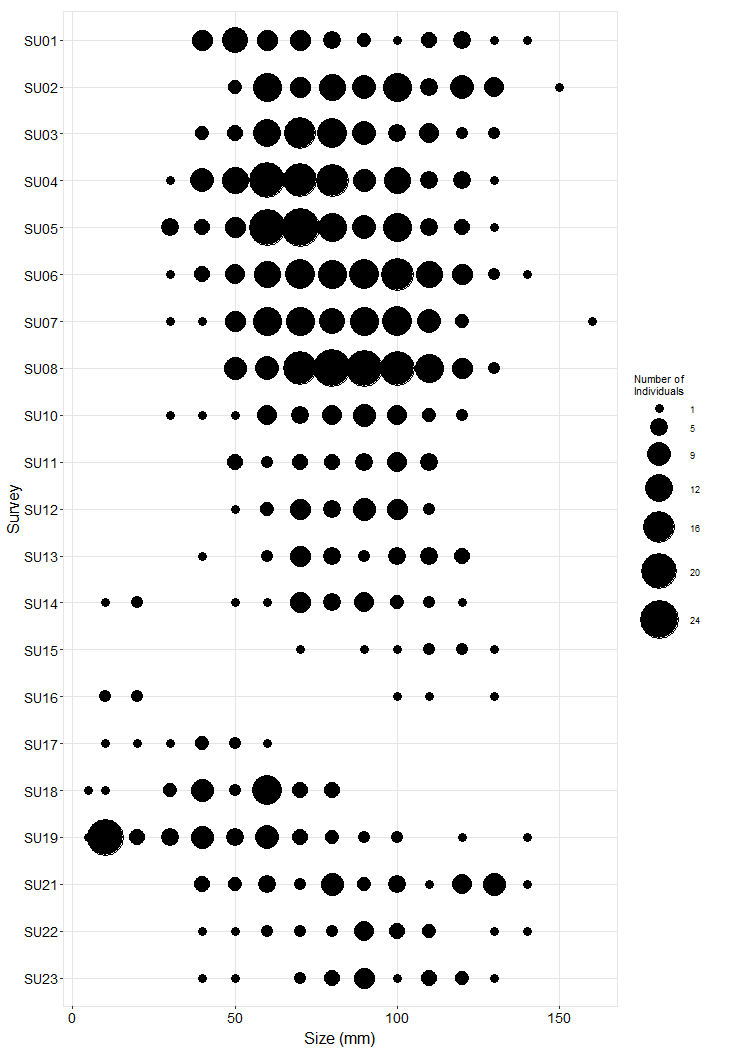
Species Counts and Sizes (where recorded) for Pisaster are shown below for this site. At some sites, other sea star species and Katharina are counted in addition to Pisaster. The sum of all individuals across all plots is displayed. Note that data gaps are represented by breaks in long-term count trend lines, but are not shown in size plots.
Pisaster ochraceus (Ochre Star) – counts
Pisaster ochraceus (Ochre Star) – sizes