Carpinteria Long-Term trends | MARINe
Carpinteria Long-Term trends
See below for trend graphs
In order to standardize species resolution across all MARINe groups, and over time, some species (typically rare) were lumped for graphical presentation of Long-Term monitoring data. See lumped categories for definitions (some variation occurs between methods and over time). Due to funding constraints, semi-annual sampling at this site was reduced to annual sampling (Fall only) beginning in 2019.
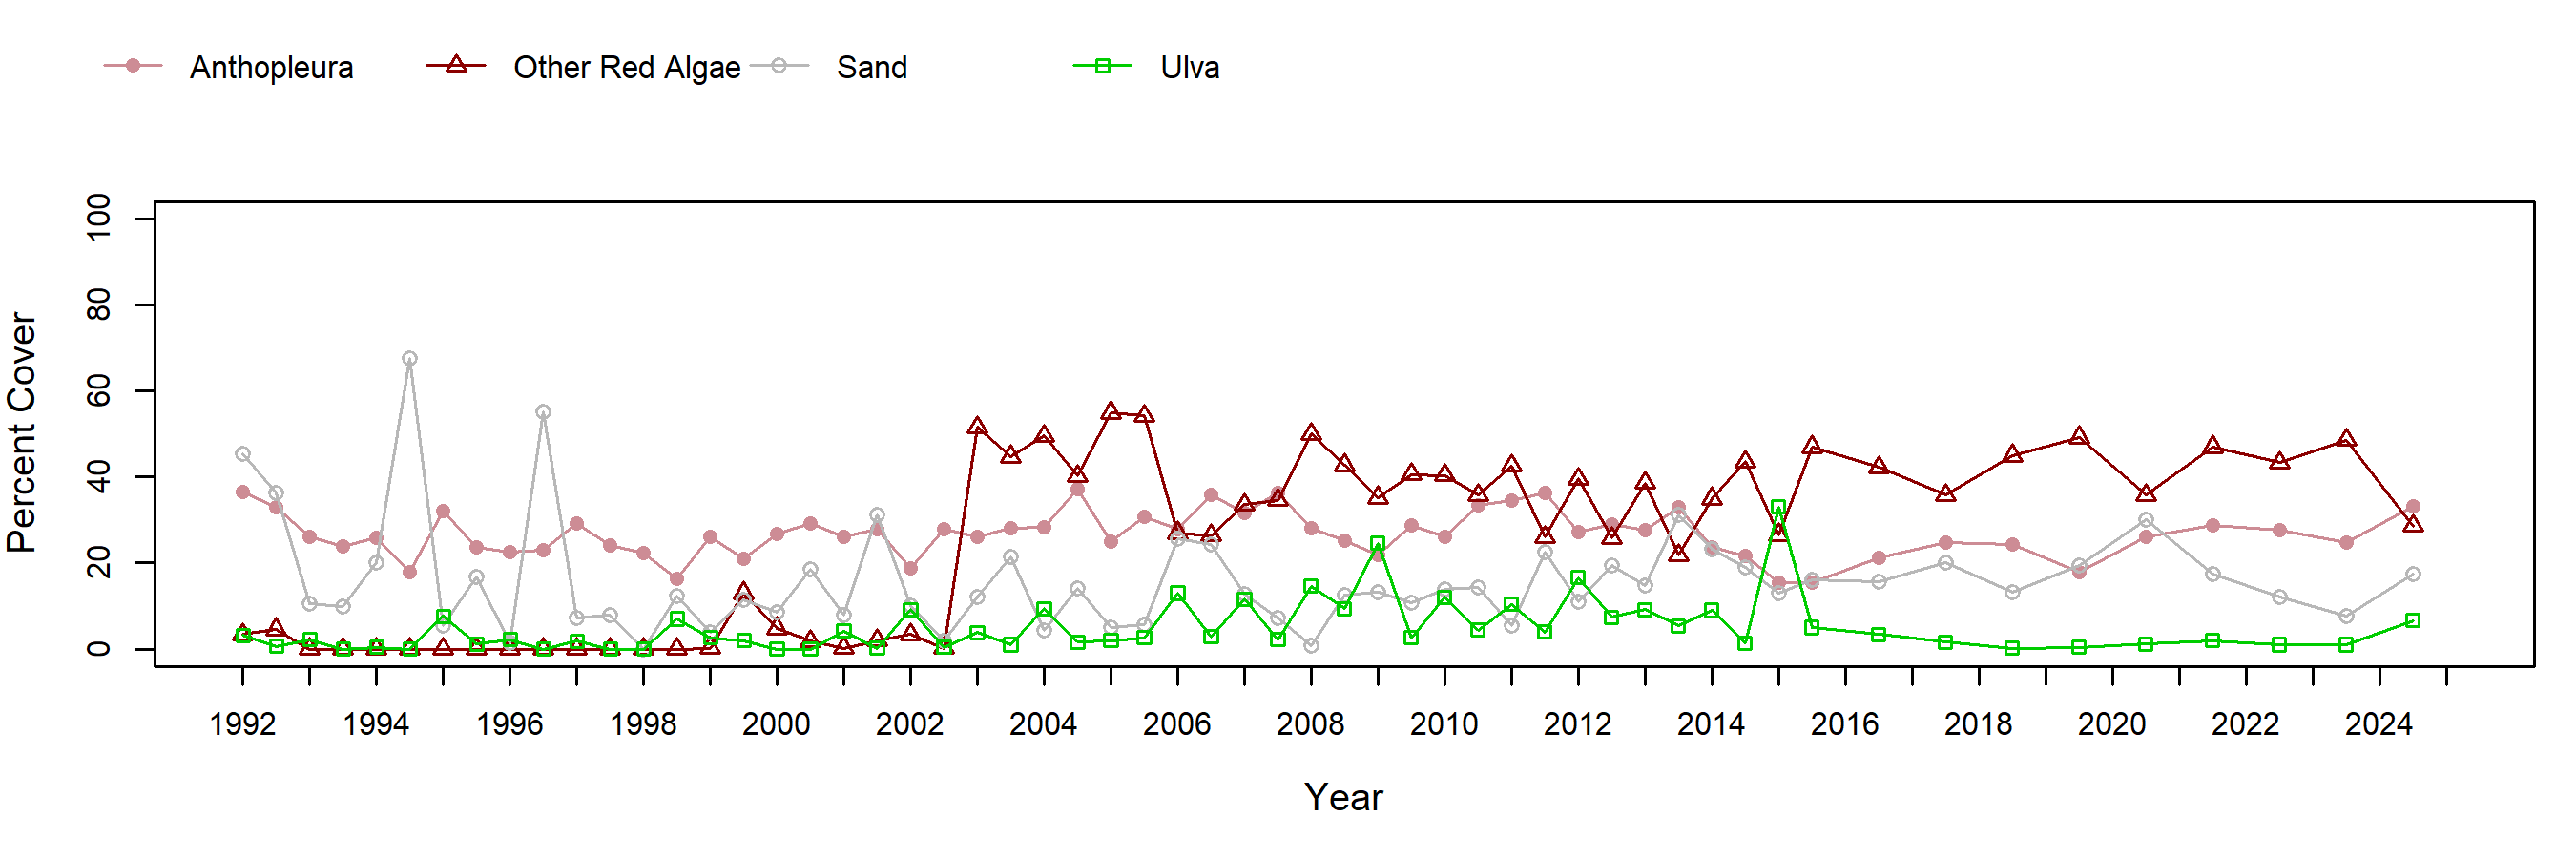
The anemone plots at Carpinteria consist primarily of the solitary anemone, Anthopleura sola rather than the colonial anemone Anthopleura elegantissima (note that these were considered a single species prior to the past several years and they are not distinguished in our sampling methods). Cover of Anthopleura has been exceptionally consistent over time, with a long-term average of roughly 30% plus or minus 10%. “Other Red Algae” is a lumped category of fleshy red alga that is dominated by filamentous reds at this particular site. For the initial decade of our studies the percent cover of these red algae in the anemone plots remained very low. However, in the Spring of 2003, coincident with higher sand inundation, percent cover increased to 50% and has since remained relatively consistent, oscillating between 30 and 50% cover. This shift to a higher presence does not appear to have influenced the presence of anemones which continue to occupy roughly 30% of the space within the plots. Fluctuations in the ephemeral green algae Ulva can be seen in the data with slightly elevated presence between 2004 and 2016, however returning to near zero for the most recent three years.
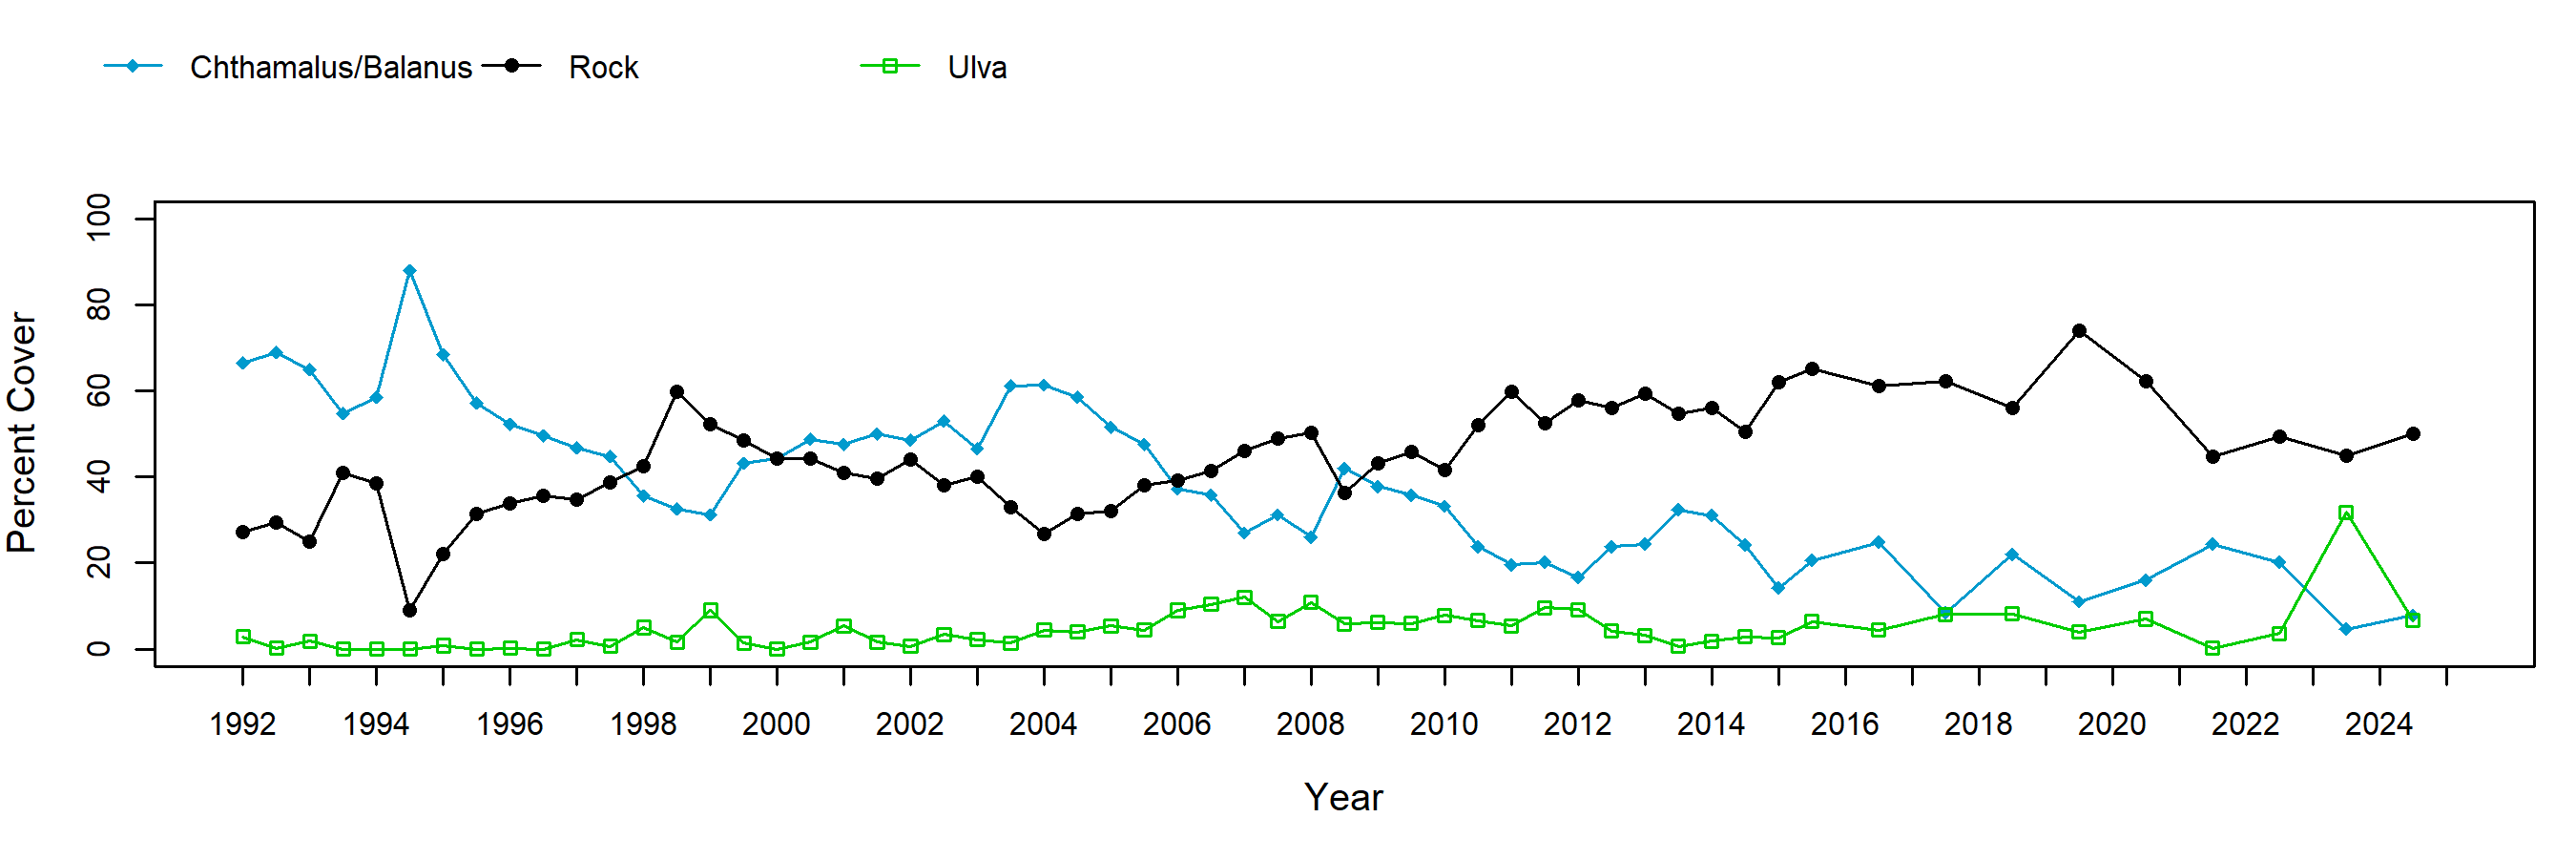
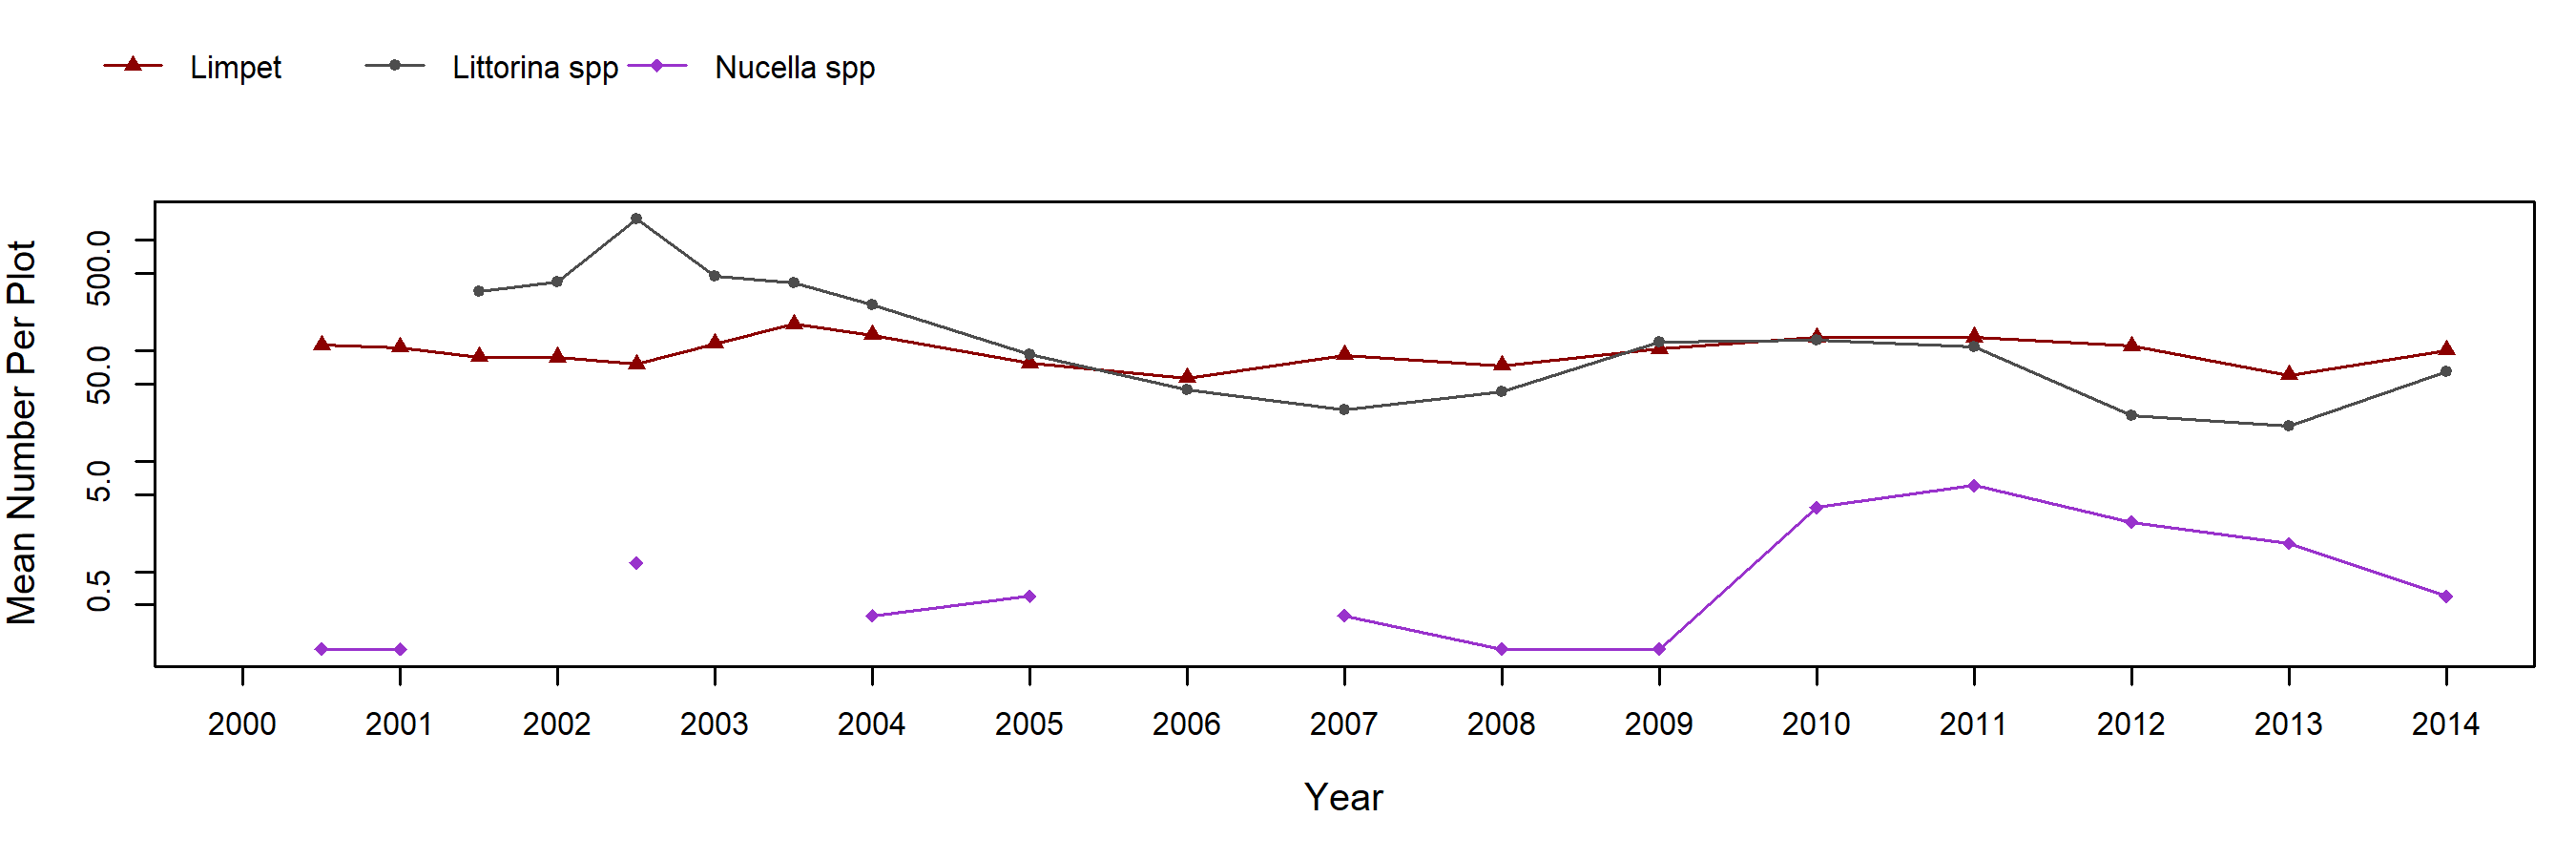
The barnacle plots at this site consist of a mixture of Chthamalus dalli/fissus (note that species were not distinguished until 2001) and Balanus glandula with the former dominating some plots and a more even mixture in others. Unlike some other monitoring sites, most of these barnacle plots are located atop rock outcrops and, with one exception, are not subject to periodic sand scour and/or burial. Thus they have not experienced dramatic fluctuations in barnacle cover as a whole, though one plot is subjected to regular scour and is nearly always covered by ephemeral Ulva with little barnacle cover. The plots experienced a strong recruitment pulse in 1994 resulting in a mean barnacle cover around 90%. This was followed by a gradual decline to less than 40% cover through 1998, an increase to 60% by 2004, and a decline to below 20% by 2012. In the absence of any significant recruitment event being observed, barnacle cover has continued to generally decline at this site, dropping below 20% cover in 2019. Motile invertebrate counts at this site began seasonally in the fall of 2000 and were changed to annual sampling in 2004. Within the barnacle plots, limpets are abundant and have fluctuated between 50 and 200 individuals per plot on average. Littorines are also abundant and have varied widely throughout the years from around 1000 individuals per plot in 2002 to very few in 2007 and in 2012-2013. Presently the numbers of both limpets and littorines are in the range of 50-100 individuals per plot. Motile invertebrate counts in barnacle plots were discontinued in 2015.
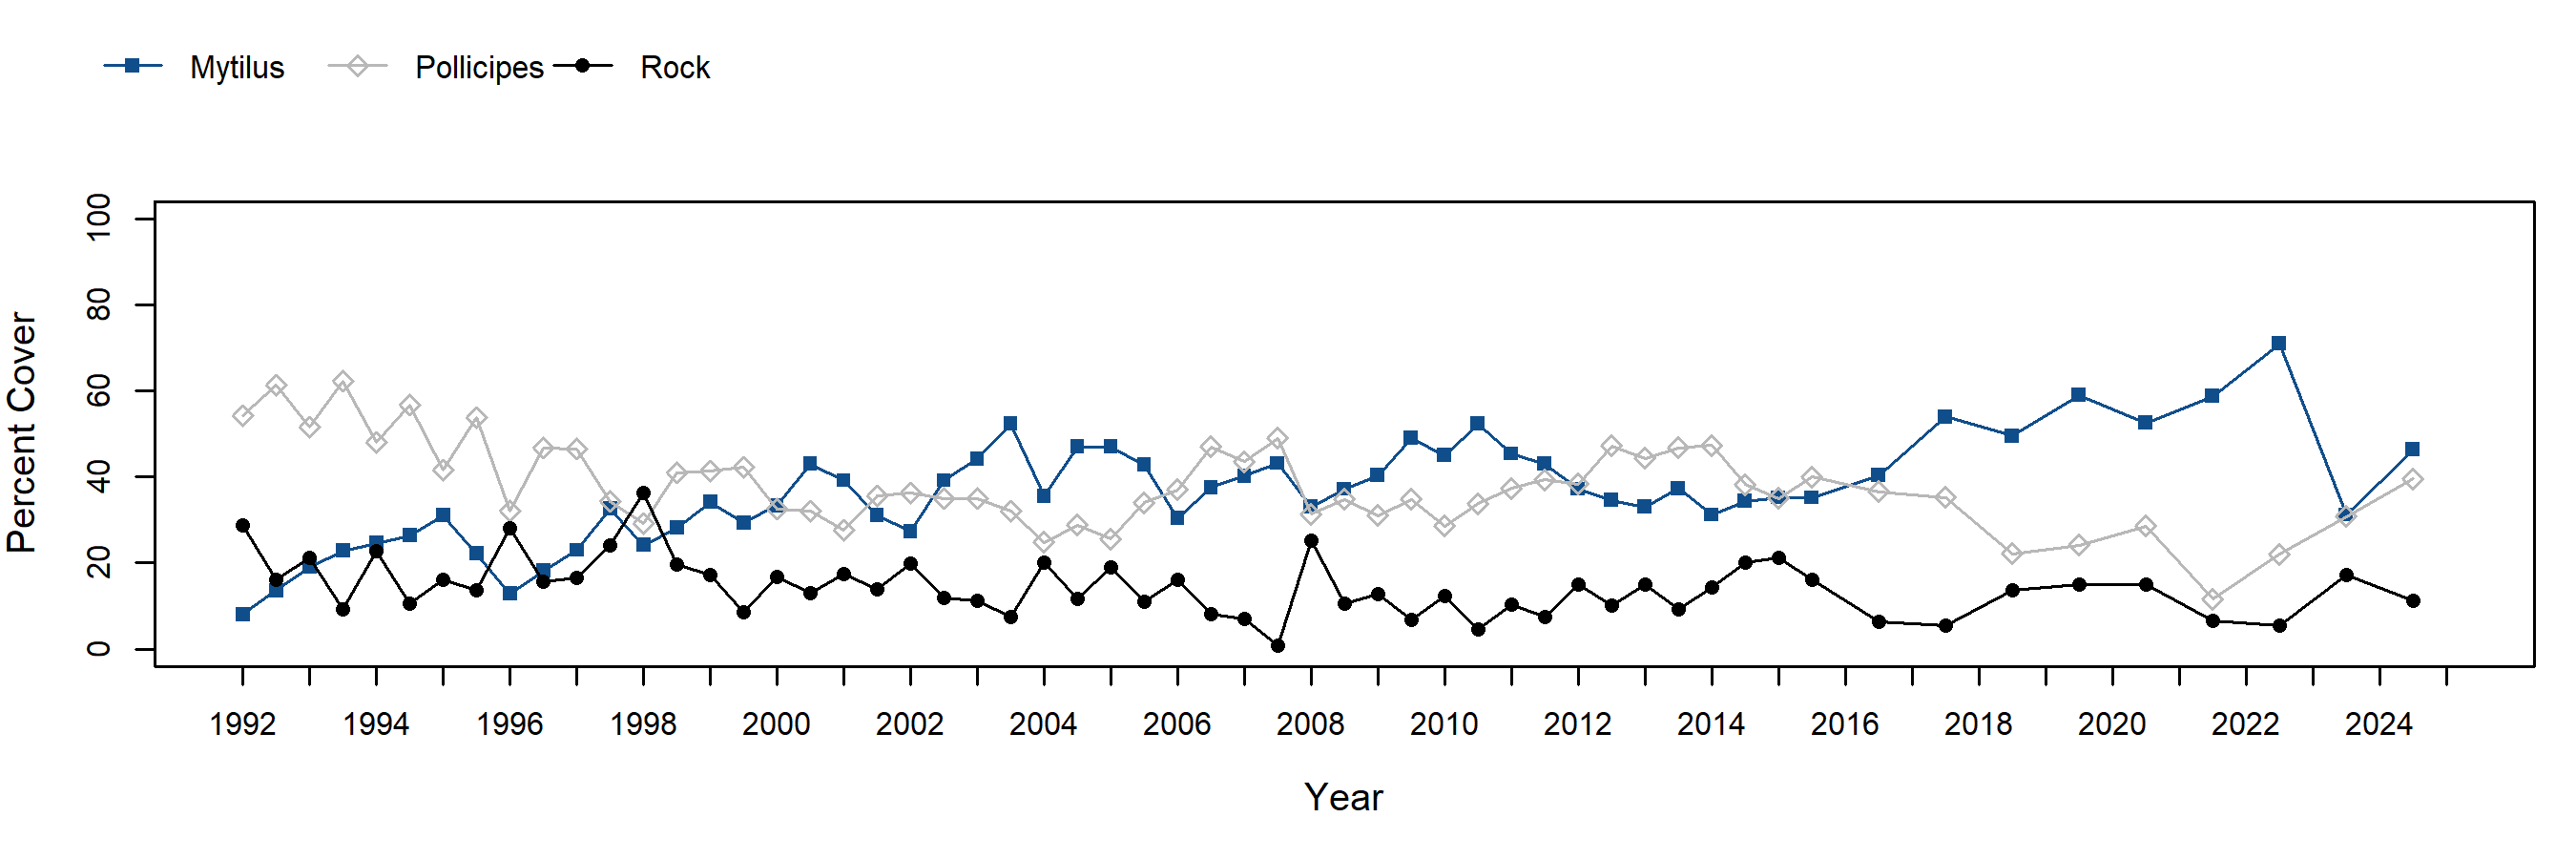
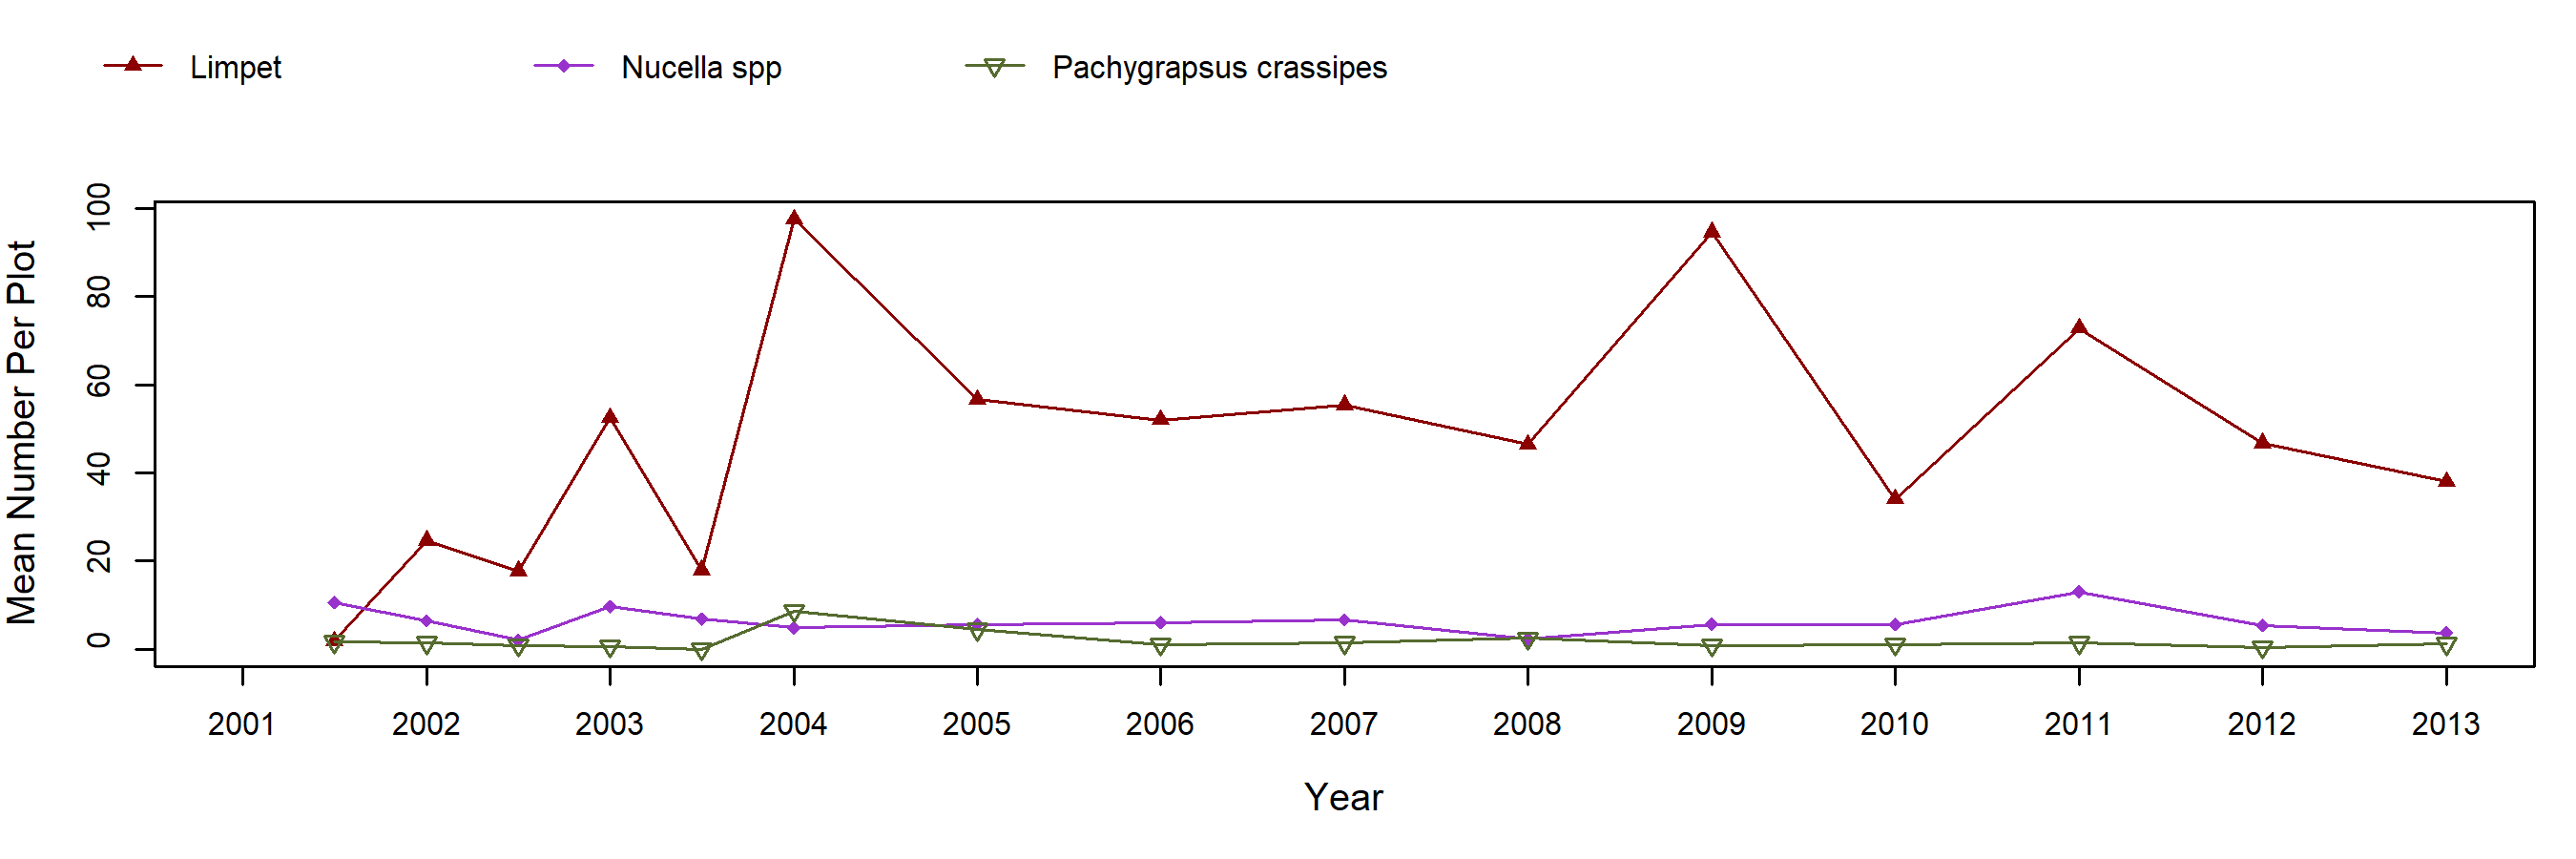
The Pollicipes plots at this site started out in 1992 with abundant Pollicipes cover (~60%) compared to mussel cover (~10%). Throughout the years, there has been a gradual convergence and then reversal in the relative cover of these two species. In recent years mussel cover has risen to 60% while Pollicipes cover has dropped to near 20%. During the survey years with biannual sampling, Pollicipes has shown seasonal variation (lower in spring, higher in fall) with the inverse pattern reflected in bare rock. Motile invertebrate counts within the Pollicipes plots show the regular occurrence of whelk snails (Nucella spp.) and shore crabs (Pachygrapsus crassipes) in the range of 5-10 individuals per plot on average. Limpets are generally more abundant but have fluctuated wildly from just a few to nearly 100 individuals per plot on average. Motile invertebrate counts in Pollicpes plots were discontinued in 2014.
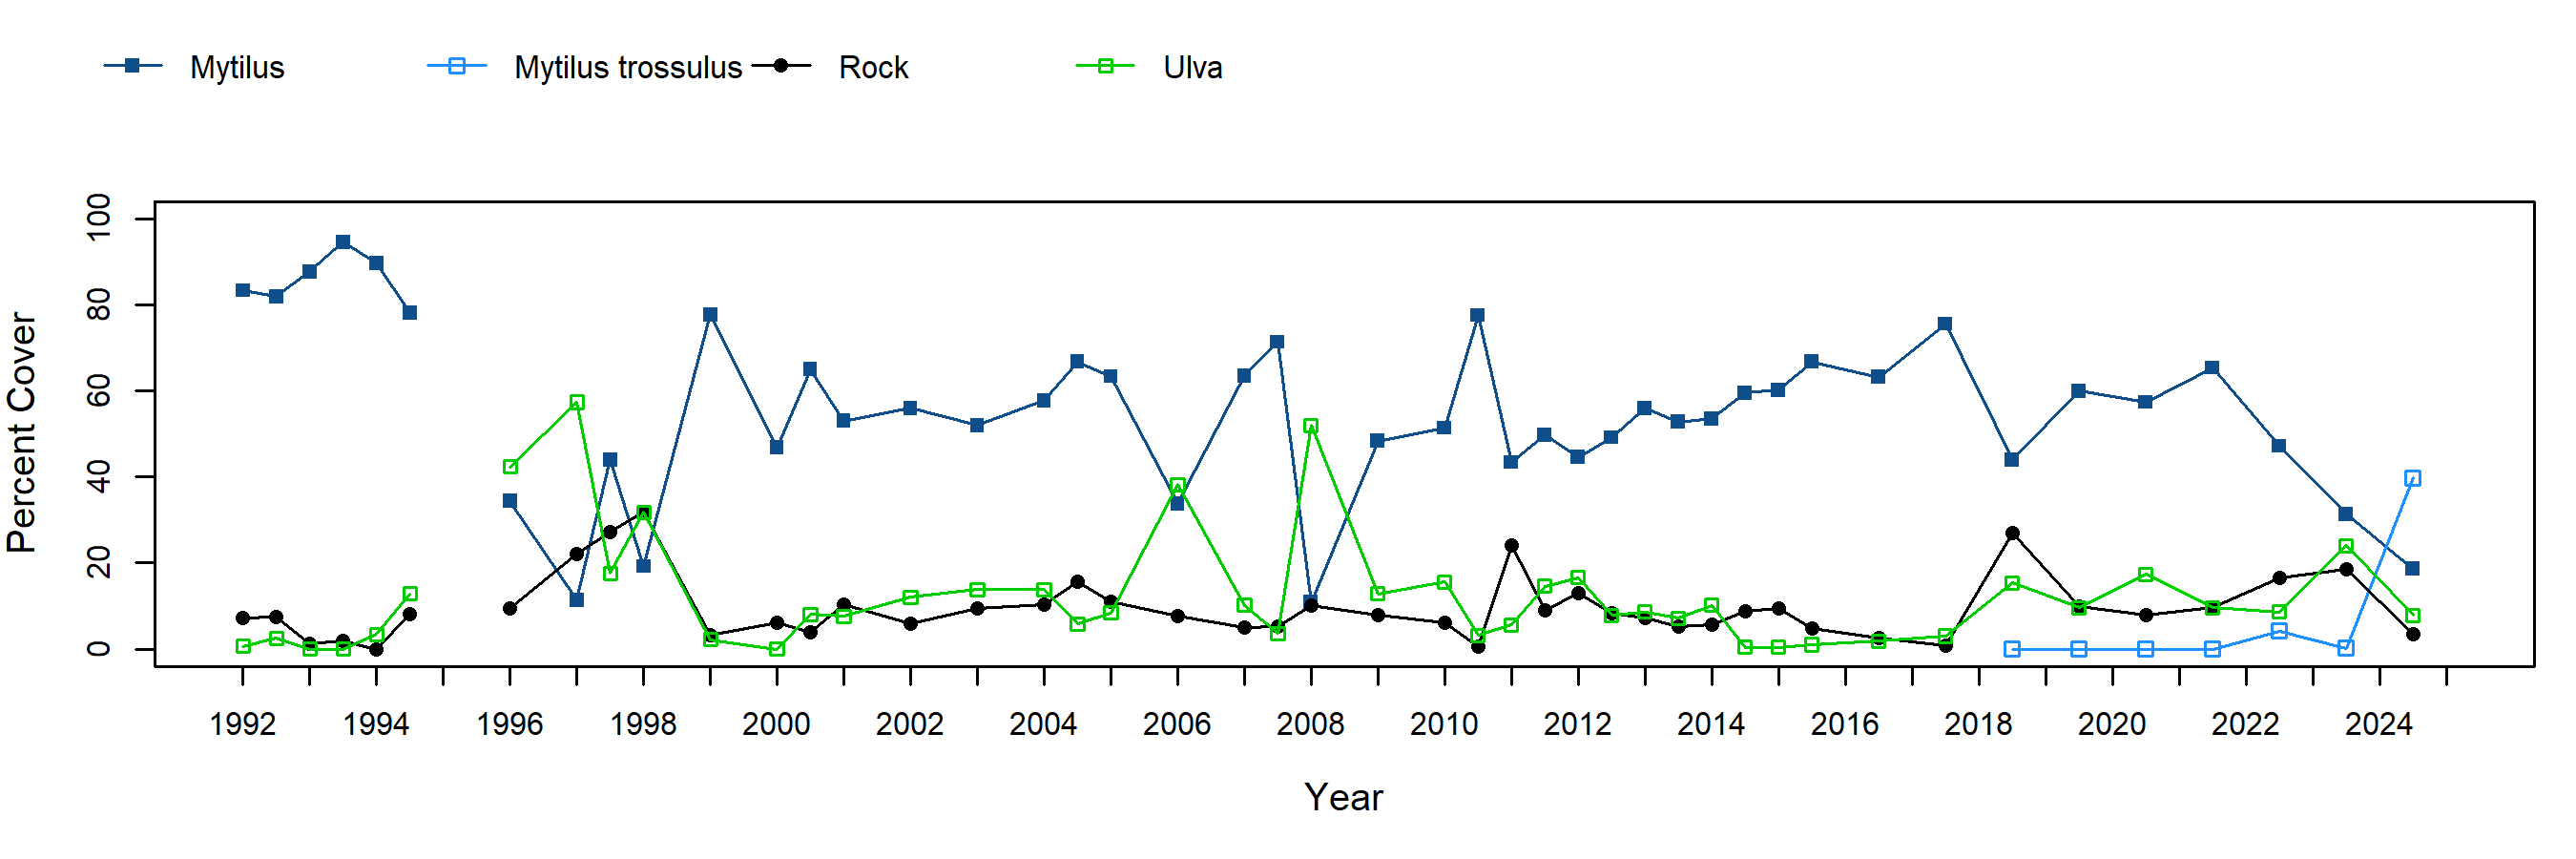
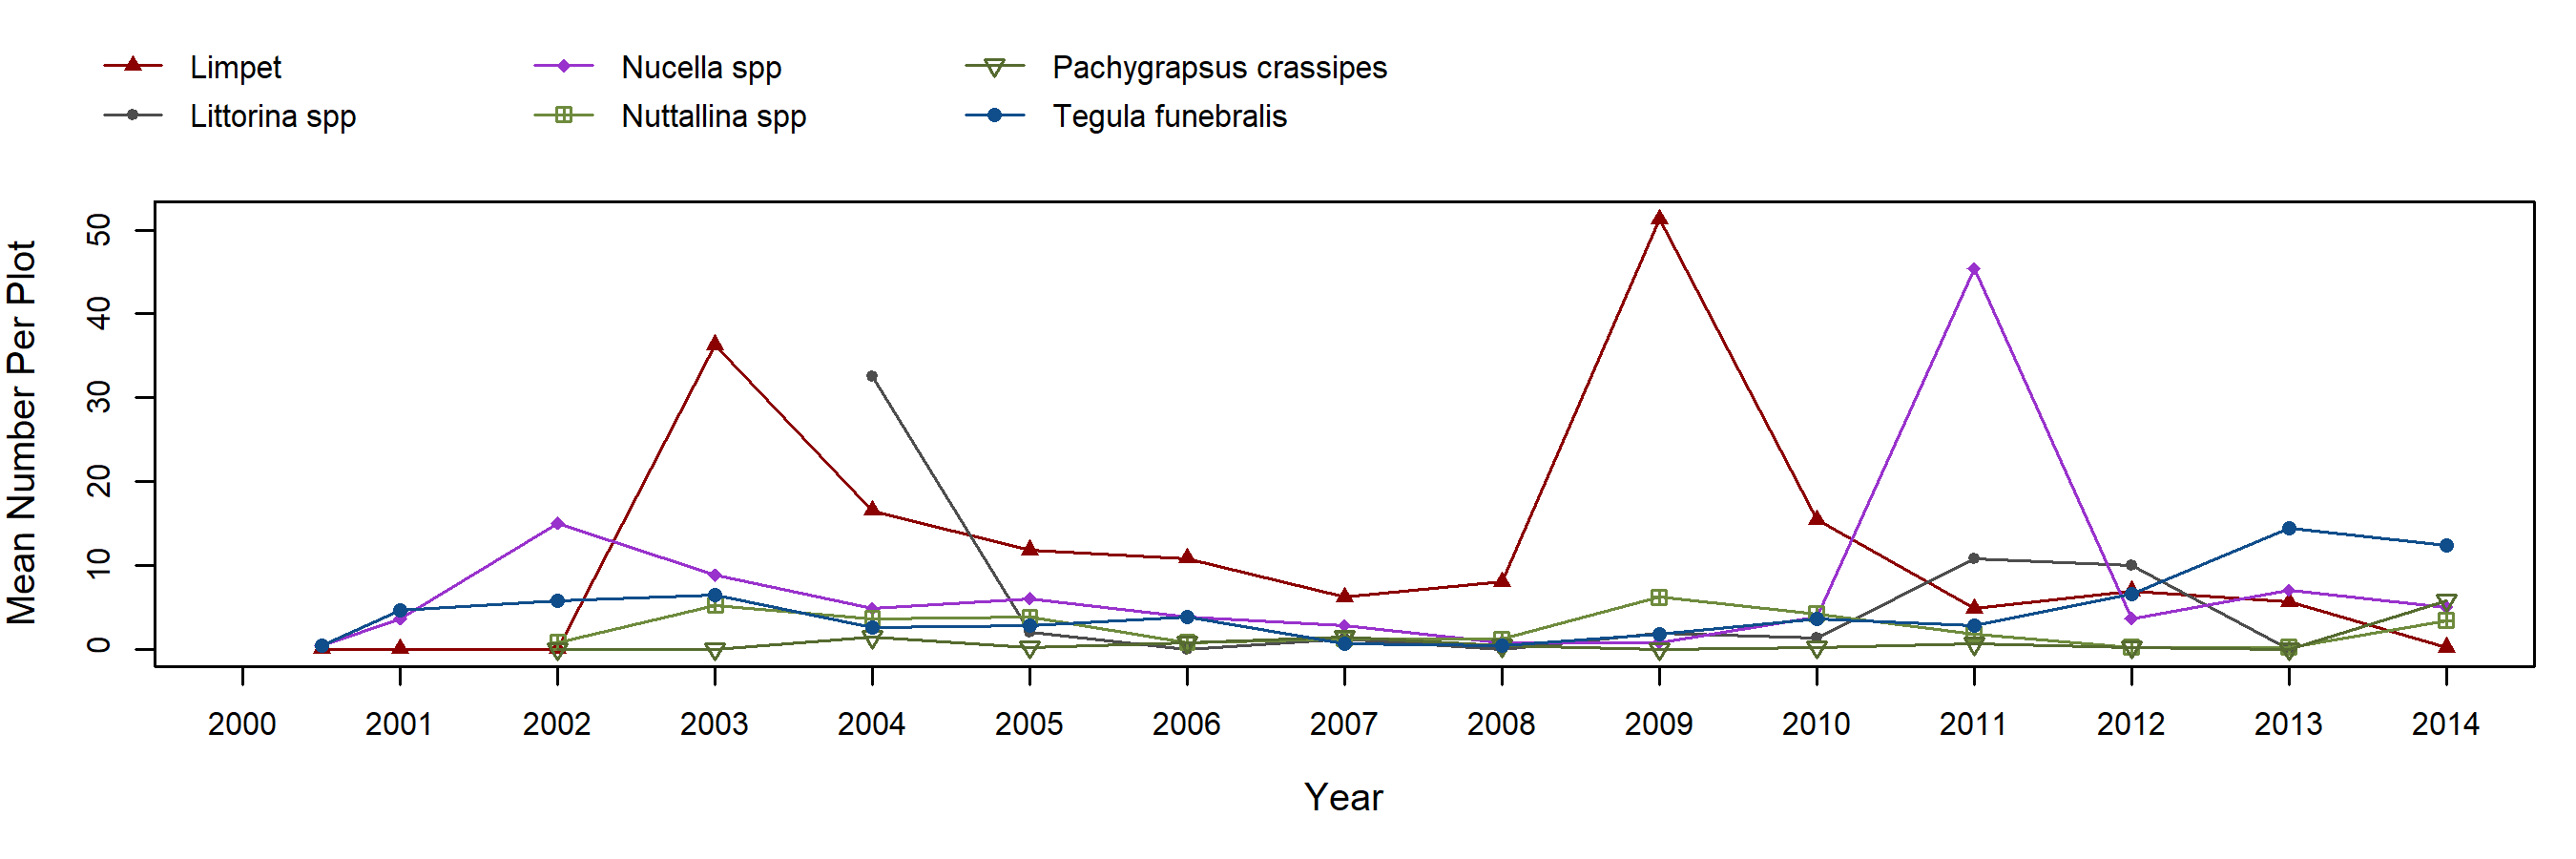
The Mussel plots at Carpinteria have been highly variable throughout the years ranging from over 90% mean cover of Mytlius to nearly zero. Mussel cover has been more consistent over the past few years hovering around 50%. Periods of mussel decline were caused by extensive mussel bed breakouts that are in turn the result of frequent episodes of pounding surf on the outer reef at this site. Pulses in cover of the ephemeral alga Ulva spp. have occurred in the wake of these mussel breakouts. Data gaps are caused by the presence of harbor seals on this portion of the site which, when present, prevent access to the plots. A significant number of dead mussels were observed in the winter of 2018 during work at this site for a different project. It was uncharacteristically clear and hot during the daytime king tides and mussels were observed in the process of overheating and dying. Significant breakout and reduction of the bed was observed the following Fall sample with a nearly 40% reduction in cover. Roughly half of this loss was then recovered by 2019 with significant mussel recruitment filling in portions of the beds. Motile invertebrate sampling shows that chitons (Nuttalina spp.) and snails (Nucella spp. and Tegula funebralis) are regular occupants of these mussel plots, along with littorines, which were more common in the spring of 2004, and limpets, which show two strong abundance peaks in fall of 2003 and fall of 2009. Motile invertebrate counts in mussel plots were discontinued in 2015.
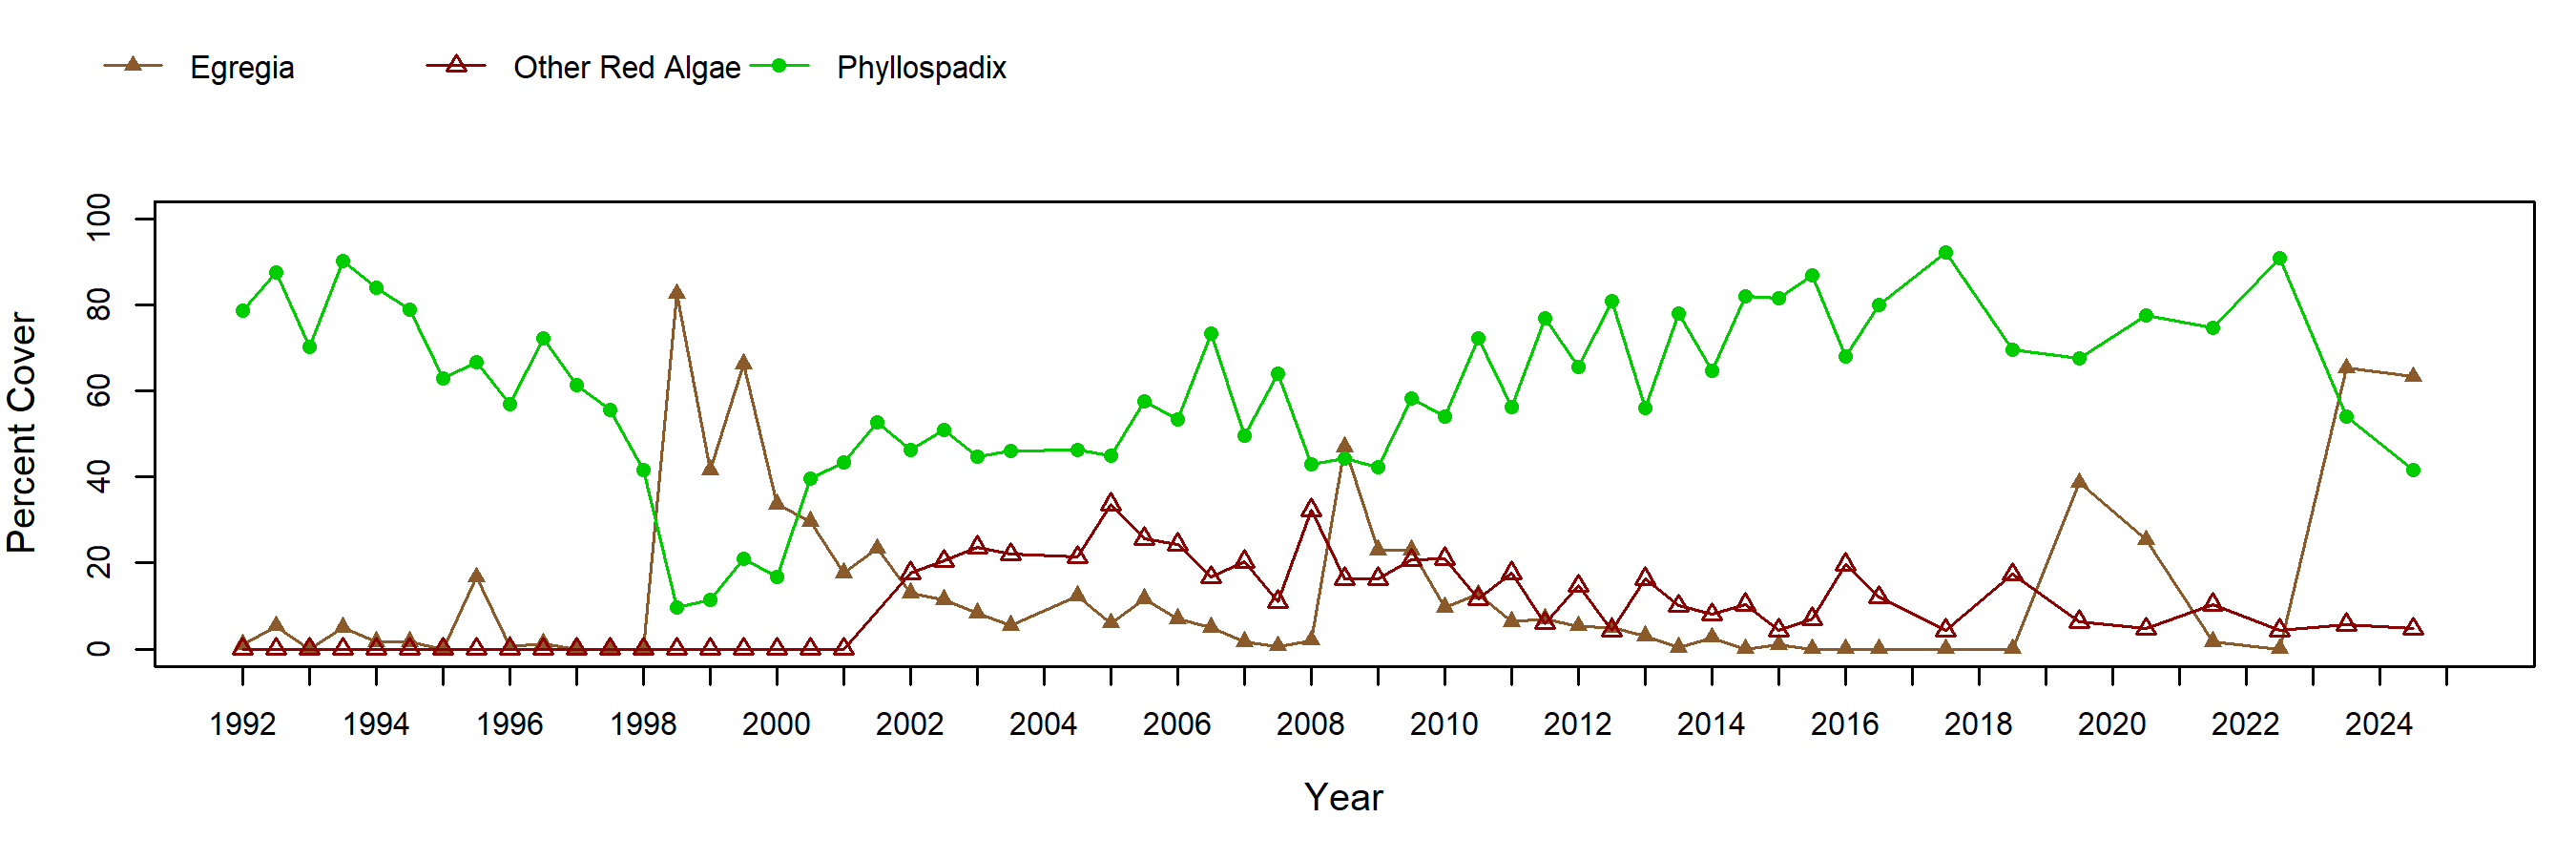
The mean cover of Surfgrass (Phyllospadix spp.) at this site gradually declined from initial 80-90% cover to near 10% over the first six years of monitoring. This particularly low cover was met by a corresponding increase in the presence of the kelp Egregia menziesii which dominated the site in the Fall of 1998. Since that low point, surfgrass cover gradually recovered, first to roughly 50% cover around 2009 and to historically high levels of 90% by 2017. The most recent surveys have shown a slight reduction to 70% cover coincident with increasing Egregia presence again (this pattern was also observed in 2008-09). Significant Egregia recruitment was observed throughout Southern California preceding each peak. Seasonal variation of surfgrass (lower in Spring, higher in Fall) can be seen in most years during which biannual sampling took place. There was a significant change in sampling methodology in 2000 which likely makes the apparent Phyllospadix decline of the late 1990's somewhat overblown. In the early years, samplers would record the topmost species encountered at the sampling point, but after 2000, in situations where fronds of Egregia lay atop a Phyllospadix understory, both species would be recorded for that sampling point. Thus, some portion of the apparent Phyllospadix decline of the late 1990's may be misleading as the increasing Egregia may have been merely covering over a healthy Phyllospadix understory. This is the case in 2008 where Egregia cover increased however most surfgrass was still present underneath the overlaying fronds.
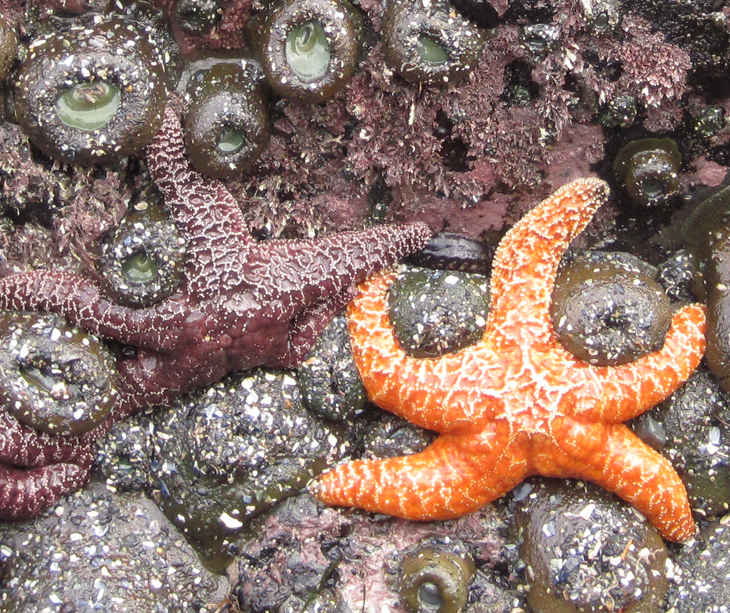
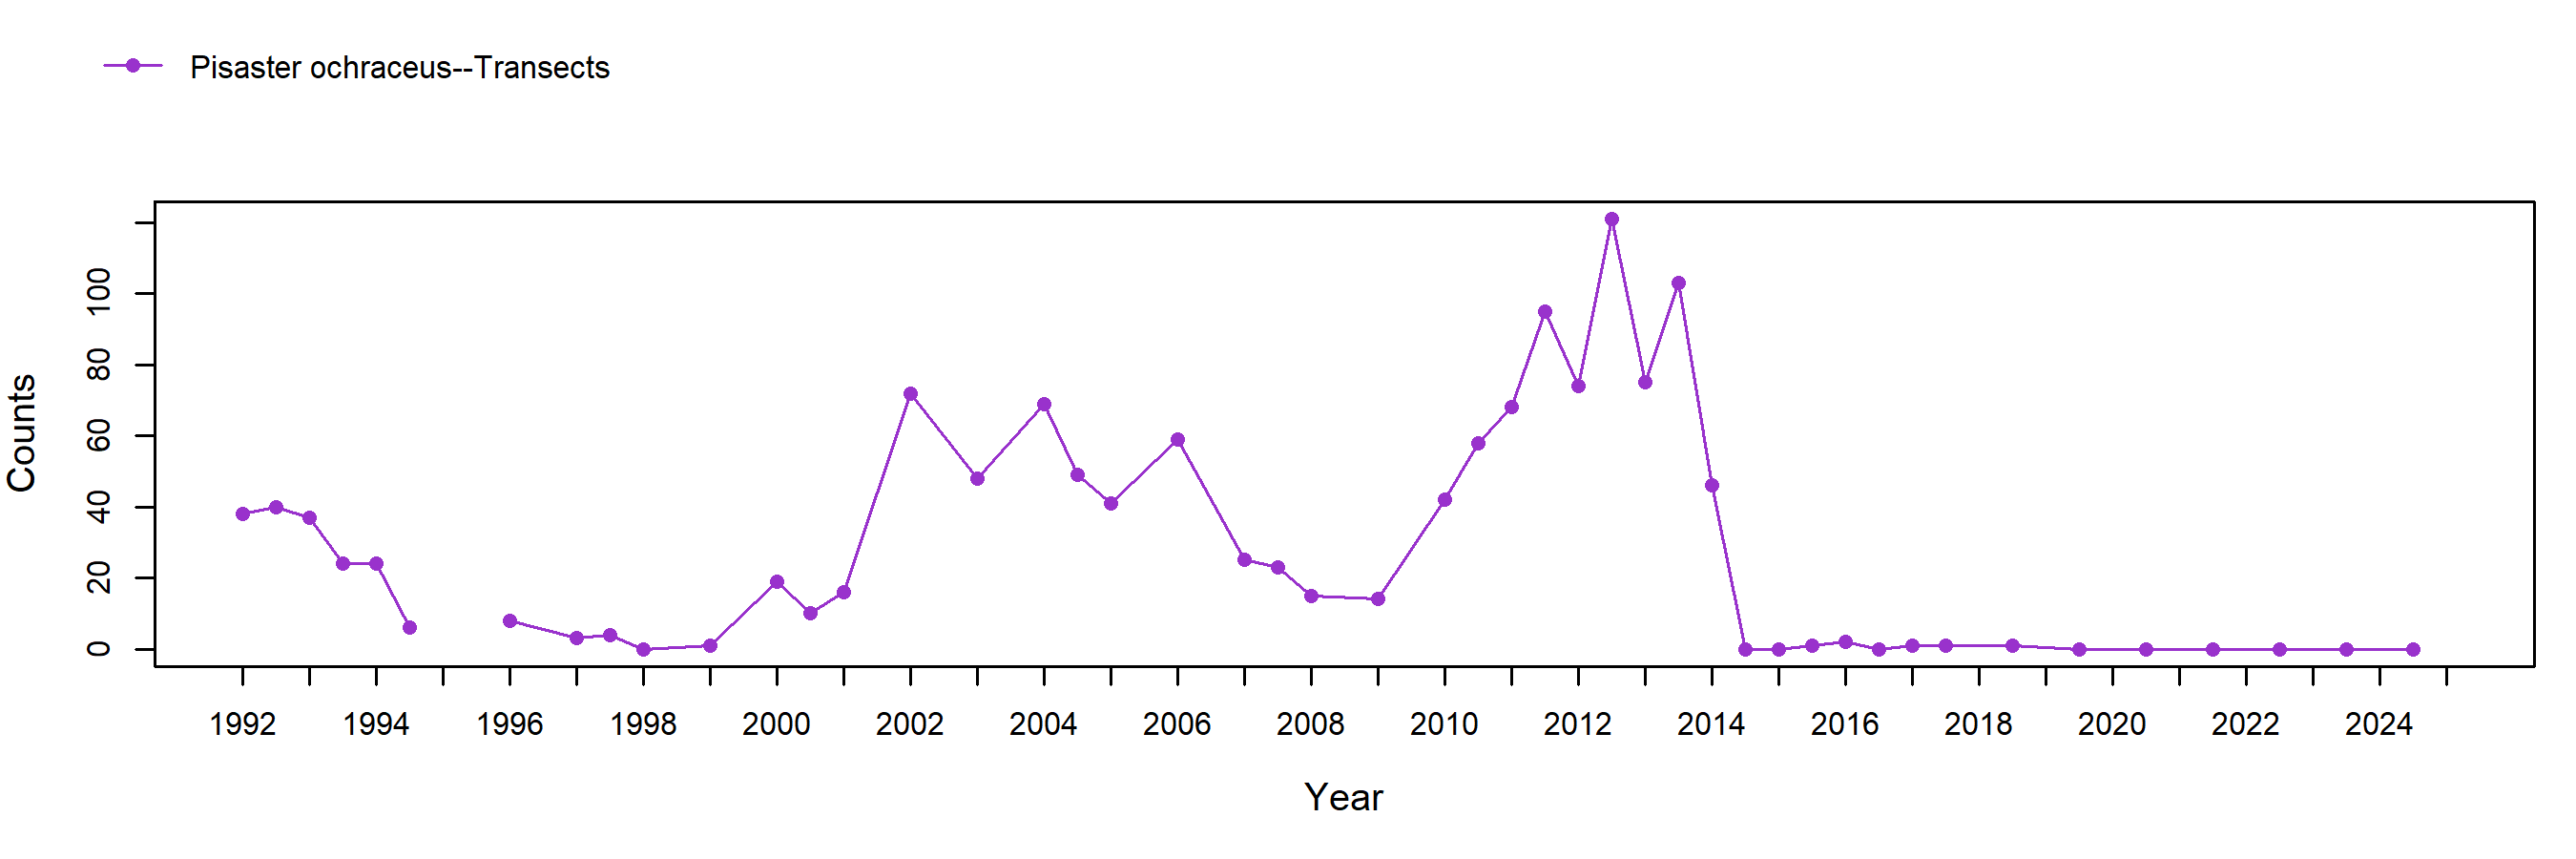
Seastar (Pisaster ochraceus) abundance within the original transect swaths has been variable at this site from over 70 stars counted and measured to just a few. Seastar numbers were particularly low from 1994 through 1999 followed by a period of higher numbers from 2002 to 2006. Then after another decline, seastar numbers started to increase in 2009 to a high of over 100 stars in the fall of 2012, shortly before the first observations of seastar wasting disease in 2013. Seastar sizes have been recorded since fall 2000. Large recruitment pulses occurred in the spring of 2002 and again in the spring of 2011. The growth of these cohorts through time can be seen in the trend graphs A pulse of larger stars occurred in 2010, likely a result of movement from subtidal individuals or from the outermost mussel beds which occur on ridges just offshore from our sample transects. Given these observations, it seems that the population of seastars at Carpinteria is supported both by recruitment and by migration of existing stars in and out of the contiguous subtidal. Seastar wasting disease struck this site in early 2014. During an initial site visit in late February, a large number of stars (46) were counted in the transects, one of which was clearly diseased. Hazardous conditions prevented us from completing the sampling that day but general observations at the site determined that more diseased stars were present and that a large number of seemingly stressed stars were found detached or loosely attached on the inner reef flats where they do not regularly occur. When we returned to the site a month later in late March, no stars could be found in any of the transects and just five stars, including one diseased star, could be found in a supplemental sitewide search. Decimation of the population from nearly 100 individuals in our sample area of only 30 m2 (on December 3, 2013) to near zero at the entire site (on March 28, 2014) occurred in less than 115 days. During the following sampling event in fall 2014, no stars were found in any of the transects and just six stars were found sitewide. No more than two stars have been found in the transects since the crash.
Photo Plots
Below are the trends observed for each Photo Plot target species at this site. Long-Term percent cover trend graphs also include any species that reached a minimum of 25% cover during any single point in time within a given target species assemblage. Breaks in trend lines represent missed sampling events. For additional species observed that did not meet this 25% threshold, please use the Interactive Map.
For motile invertebrate Species Counts, a mean across all plots was calculated, and only those species with a value of at least 5 individuals for at least one sample are shown. Due to time constraints, motile invertebrate counts have not been done at most sites since 2012. For motile invertebrate size trend graphs by site, please use the Interactive Map.
Anthopleura (Anemones)
Chthamalus/Balanus (Acorn Barnacles) - percent cover
Chthamalus/Balanus (Acorn Barnacles) - motile invertebrate counts
Pollicipes (Goose Barnacle) - percent cover
Pollicipes (Goose Barnacle) - motile invertebrate counts
Mytilus (California Mussel) - percent cover
Mytilus (California Mussel) - motile invertebrate counts
Transects
Below are the trends observed for each Transect target species at this site. Long-Term trend graphs also include any species that reached a minimum of 25% cover during any single point in time within a given target species assemblage. Breaks in trend lines represent missed sampling events.
Phyllospadix (Surfgrass)
Species Counts and Sizes
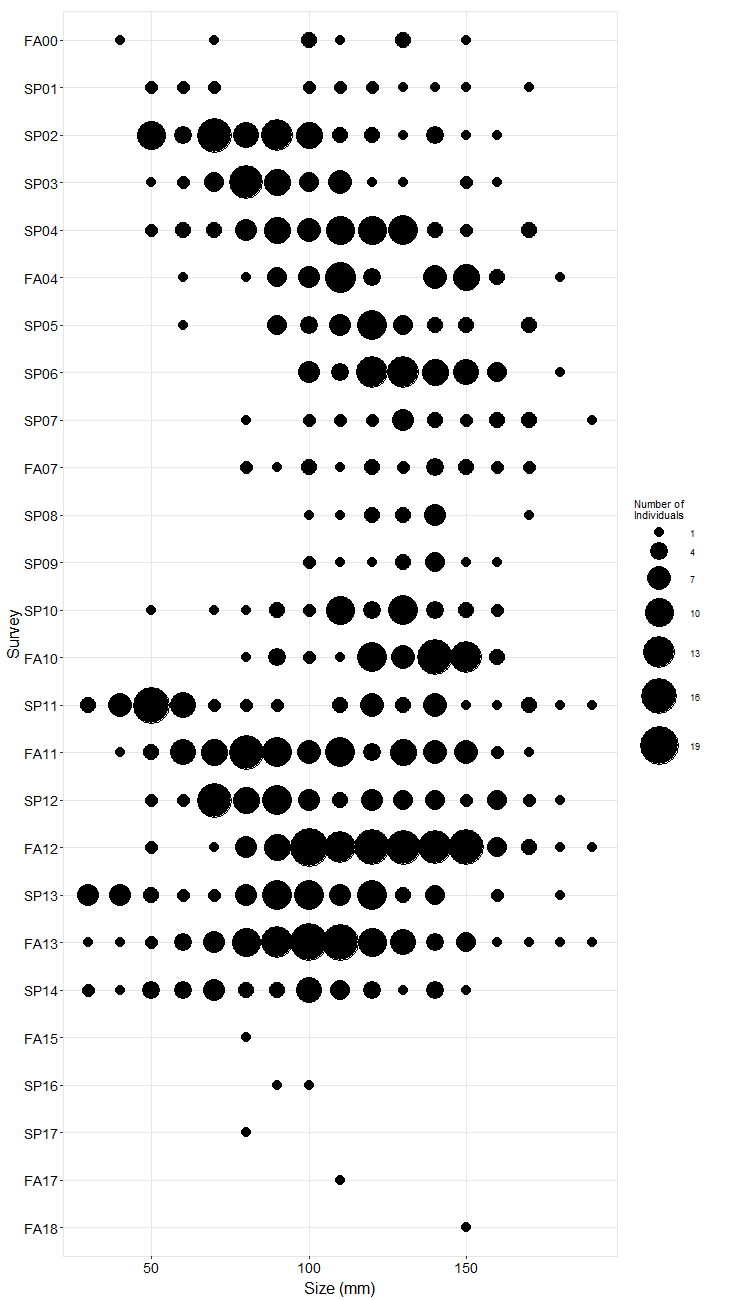
Species Counts and Sizes (where recorded) for Pisaster are shown below for this site. At some sites, other sea star species and Katharina are counted in addition to Pisaster. The sum of all individuals across all plots is displayed. Note that data gaps are represented by breaks in long-term count trend lines, but are not shown in size plots.
Pisaster (Ochre Star) - counts
Pisaster (Ochre Star) - sizes in Transects