Long-Term Monitoring Trend Graphs
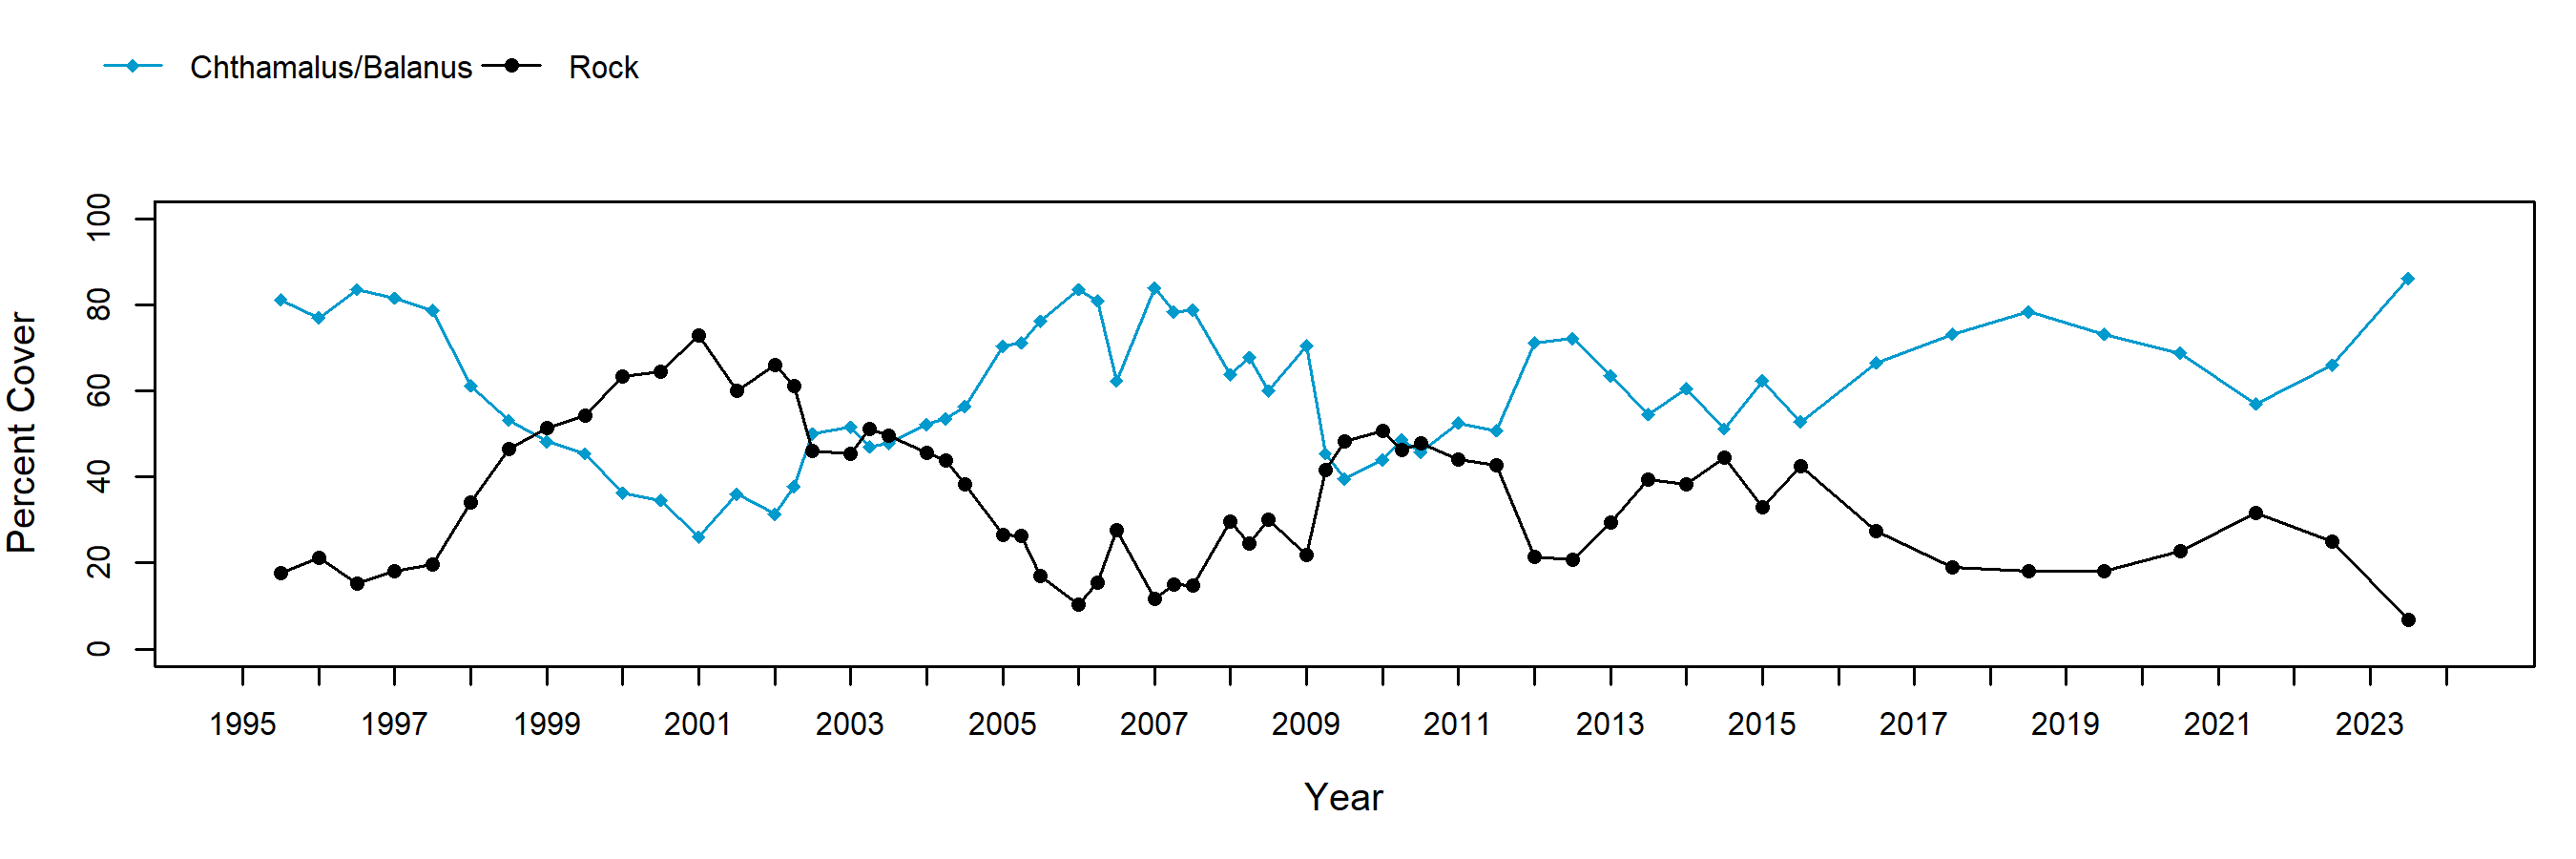
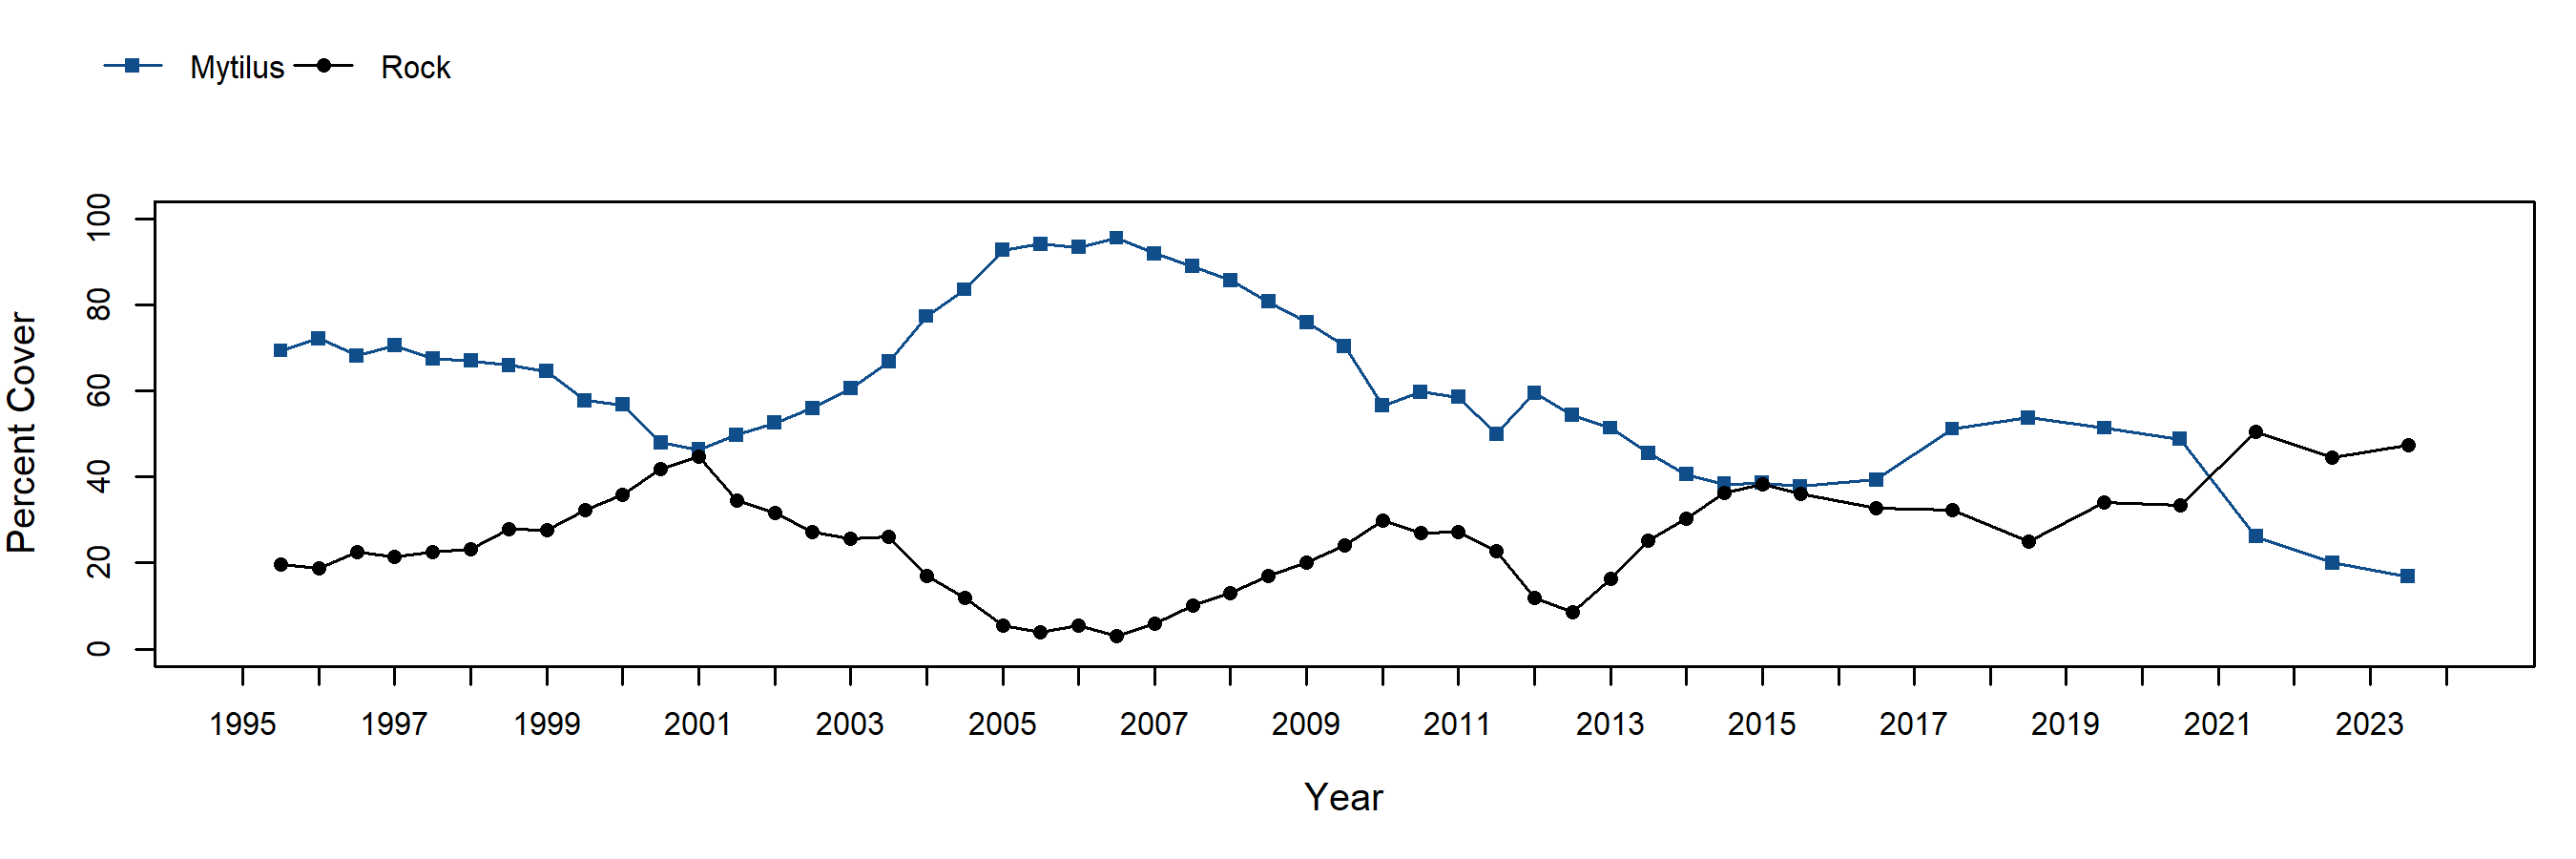
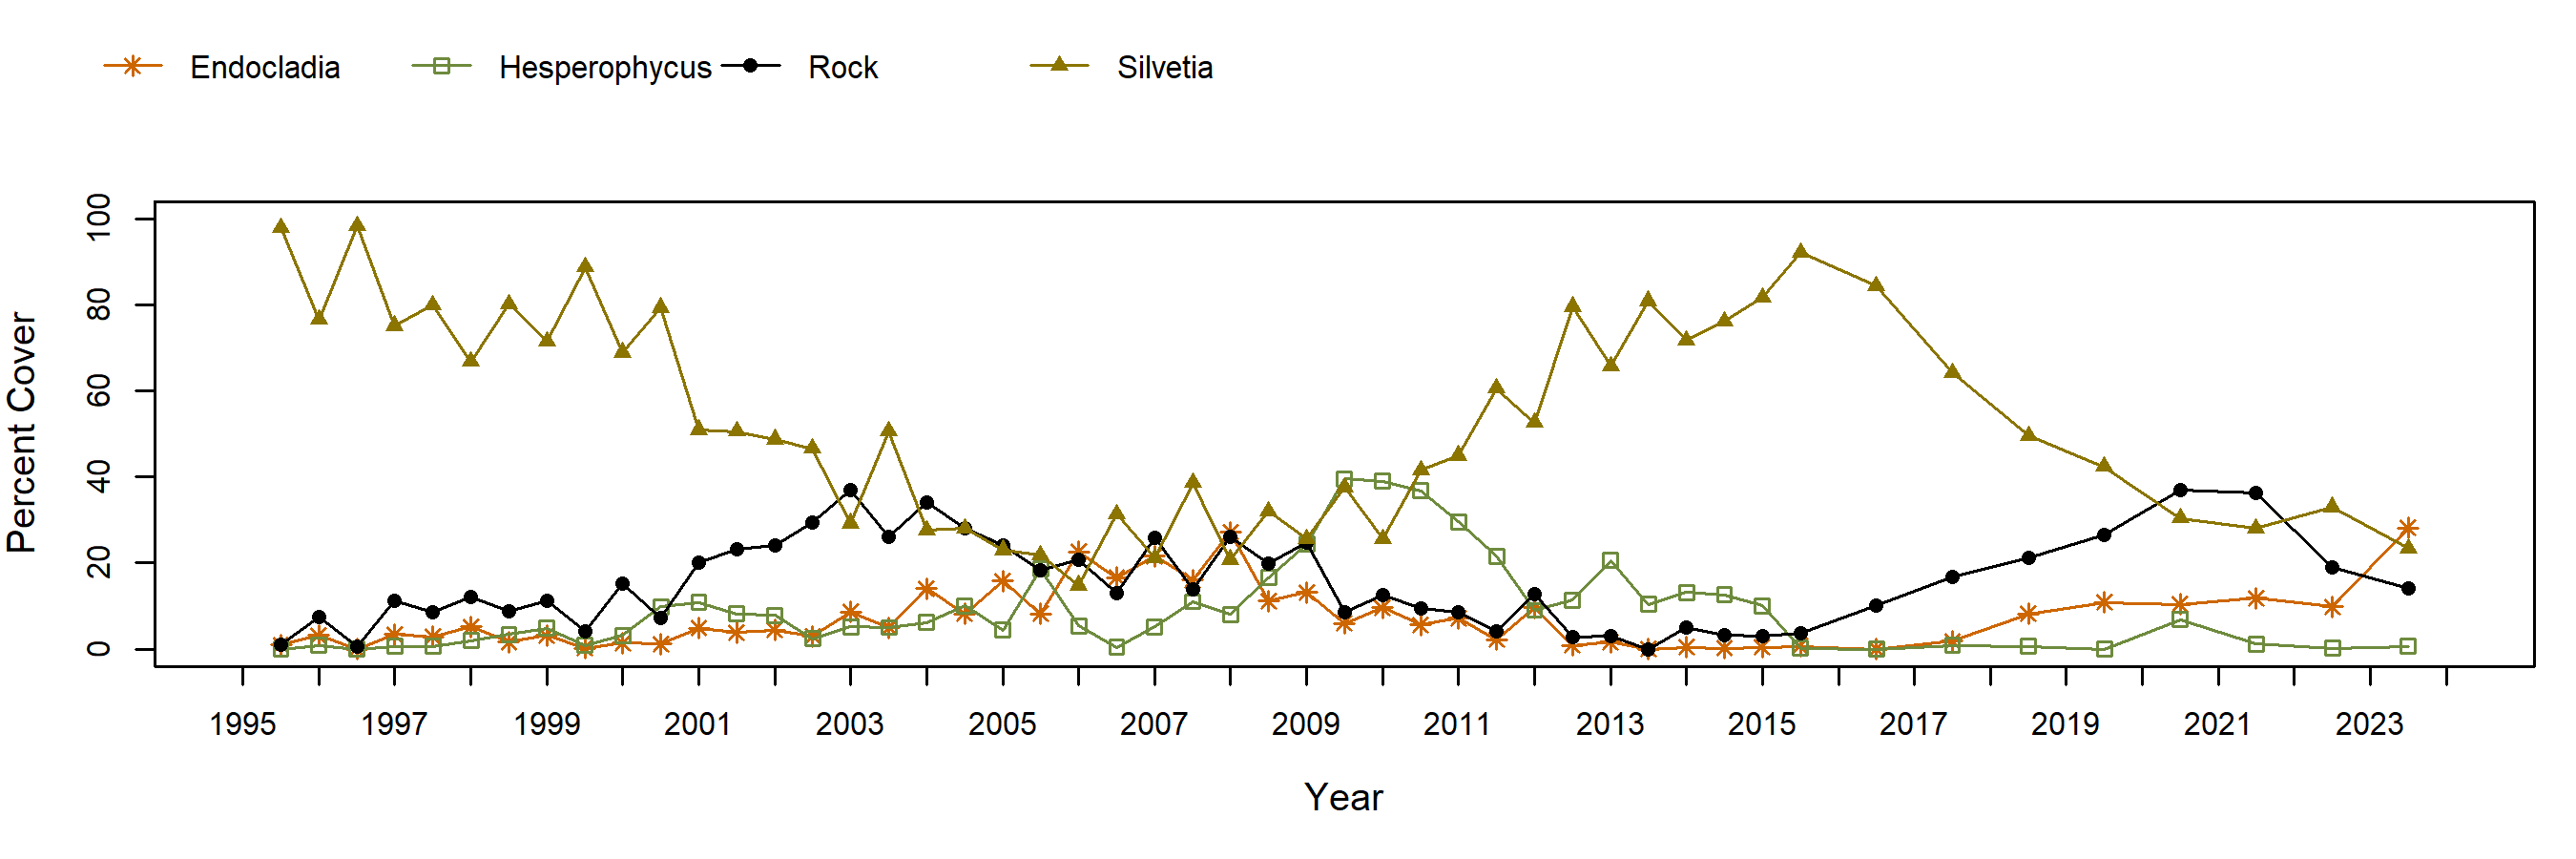
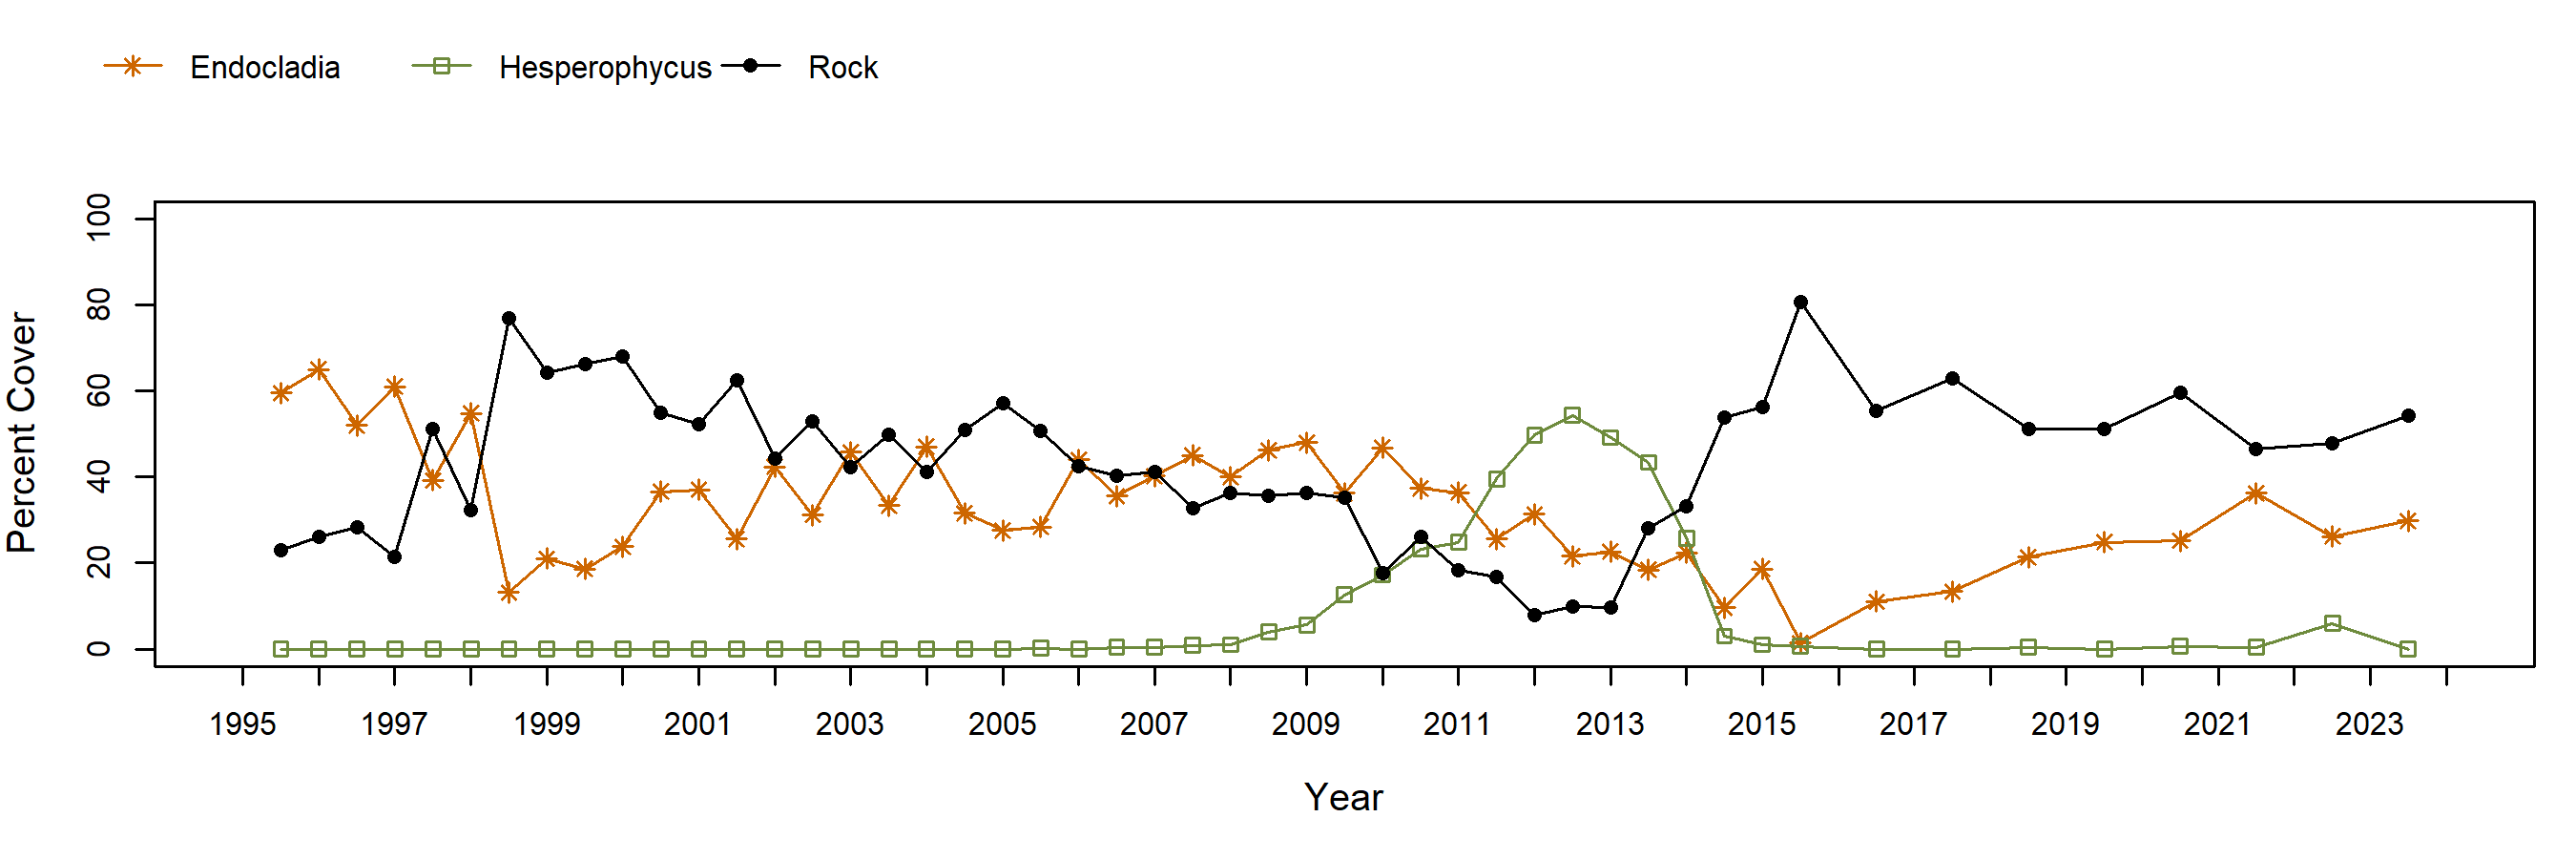
Cover of both barnacles and mussels in their target plots at Cayucos varied inversely with rock cover, indicating that bare space was generally not colonized by other species. Abundance of the upper-shore rockweed, Hesperophycus, was generally low in its target plots throughout the 30 year monitoring period, with brief spikes in cover in 1995 and again in 2012/13. Silvetia cover was quite high during the first 5 years at Cayucos but experienced a substantial decline between 2001-2009. Beginning in 2010, cover began to increase and peaked at around 80% in 2015, followed by another steady decline. Semi-annual surveys that occurred between 1995-2015 captured the seasonality in cover of Silvetia, with lower values in spring vs. fall samples. This pattern is present at many sites and may be due to a combination of factors including seasonal growth cycles, physical removal by winter storms and desiccation from extreme low tides that occurred in the middle of the day in the spring (timing of low tide is cyclical, so low tides are not always mid-day in spring in this region). Endocladia cover in its’ target plots has been variable over time, but periods of decline have thus far been followed by recovery to near initial levels. Prior to Fall 2014, a dramatic decrease in both Hesperophycus and Endocladia occurred throughout these plots, which may have been a consequence of scouring or some other stress, since declines were coupled with an increase in cover of bare rock.
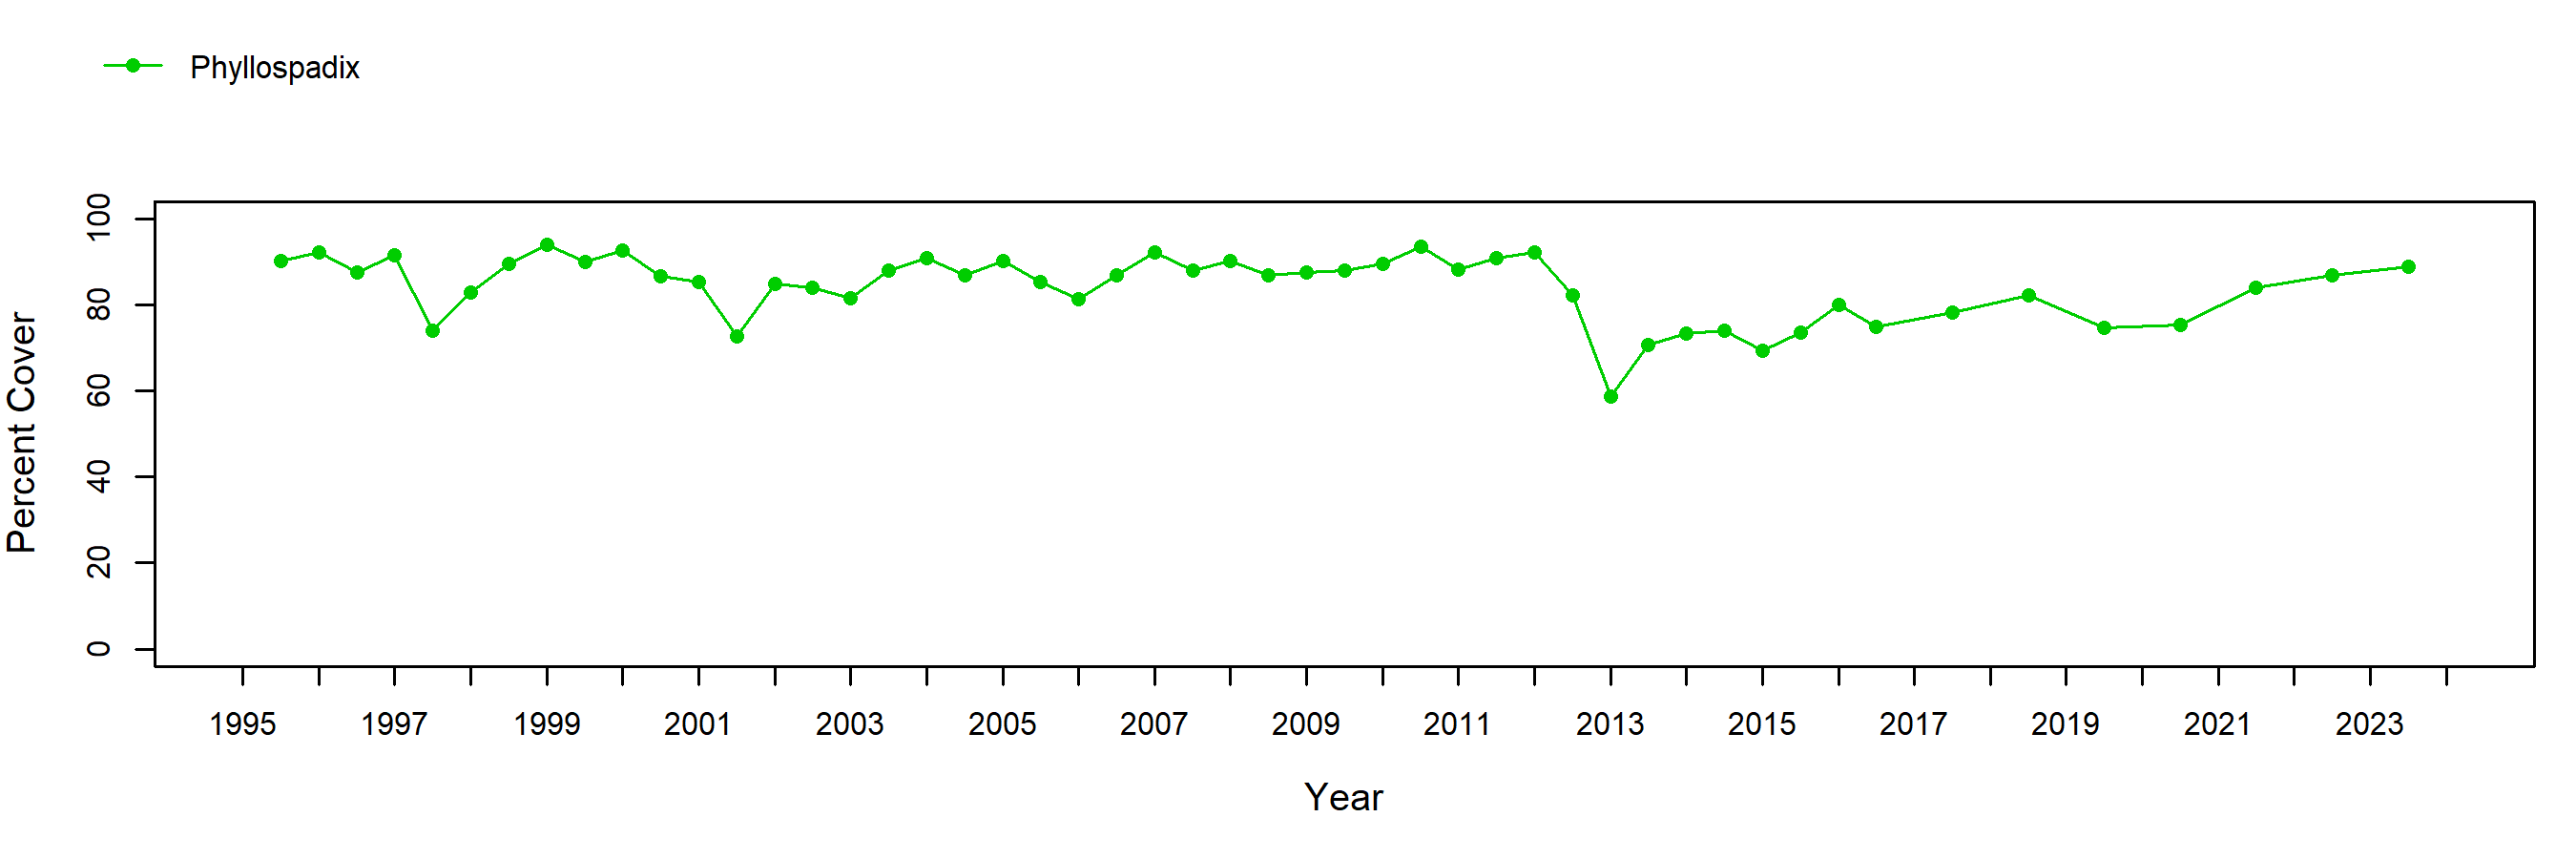
Surfgrass cover at Cayucos was consistently high over time, with only slight dips during the 1997/98 El Niño event, and again in 2001 and 2013. The lack of a seasonal pattern in surfgrass cover at Cayucos is likely due to the location of the transects at this site in large pools, which reduces the amount of stress experienced by the plants due to air exposure, and perhaps also abrasion.
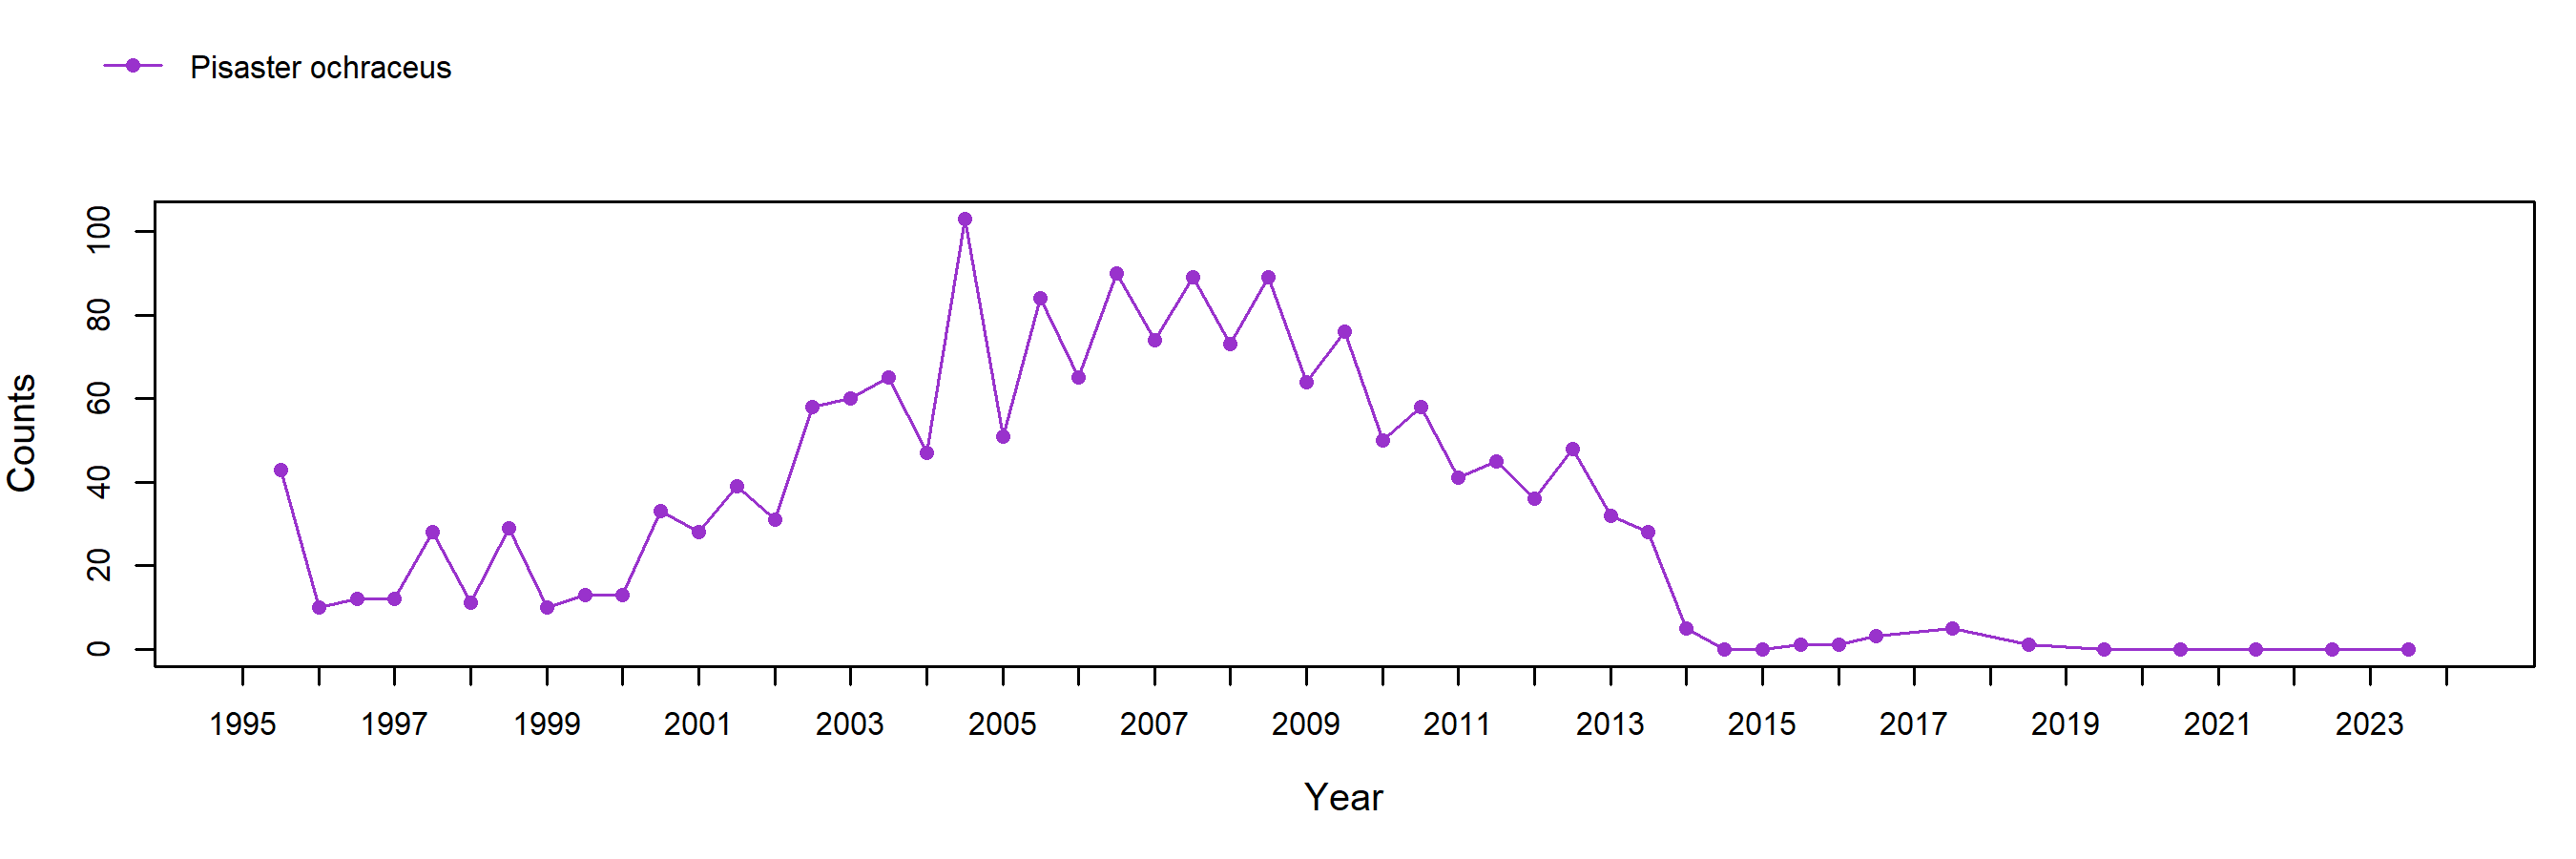
Pisaster numbers were highly variable at Cayucos, but plummeted in 2014 due to sea star wasting syndrome and had not recovered as of 2024. Very few small stars (< 50 mm radius) have been counted over time at this site, suggesting that recruitment is limited and recovery could be slow.
In order to standardize species resolution across all MARINe groups and over time, some species (typically rare) were lumped for graphical presentation of Long-Term monitoring data. See lumped categories for definitions (some variation occurs between methods and over time).
If you experience any barriers accessing the trend graphs below, please contact (pacificr@ucsc.edu) for help.
Photo Plots

Below are the trends observed for each Photo Plot target species at this site. Long-Term percent cover trend graphs also include any species that reached a minimum of 25% cover during any single point in time within a given target species assemblage. Breaks in trend lines represent missed sampling events. For additional species observed that did not meet this 25% threshold, please use the Graphing Tool.
Chthamalus/Balanus (Acorn Barnacles) – percent cover
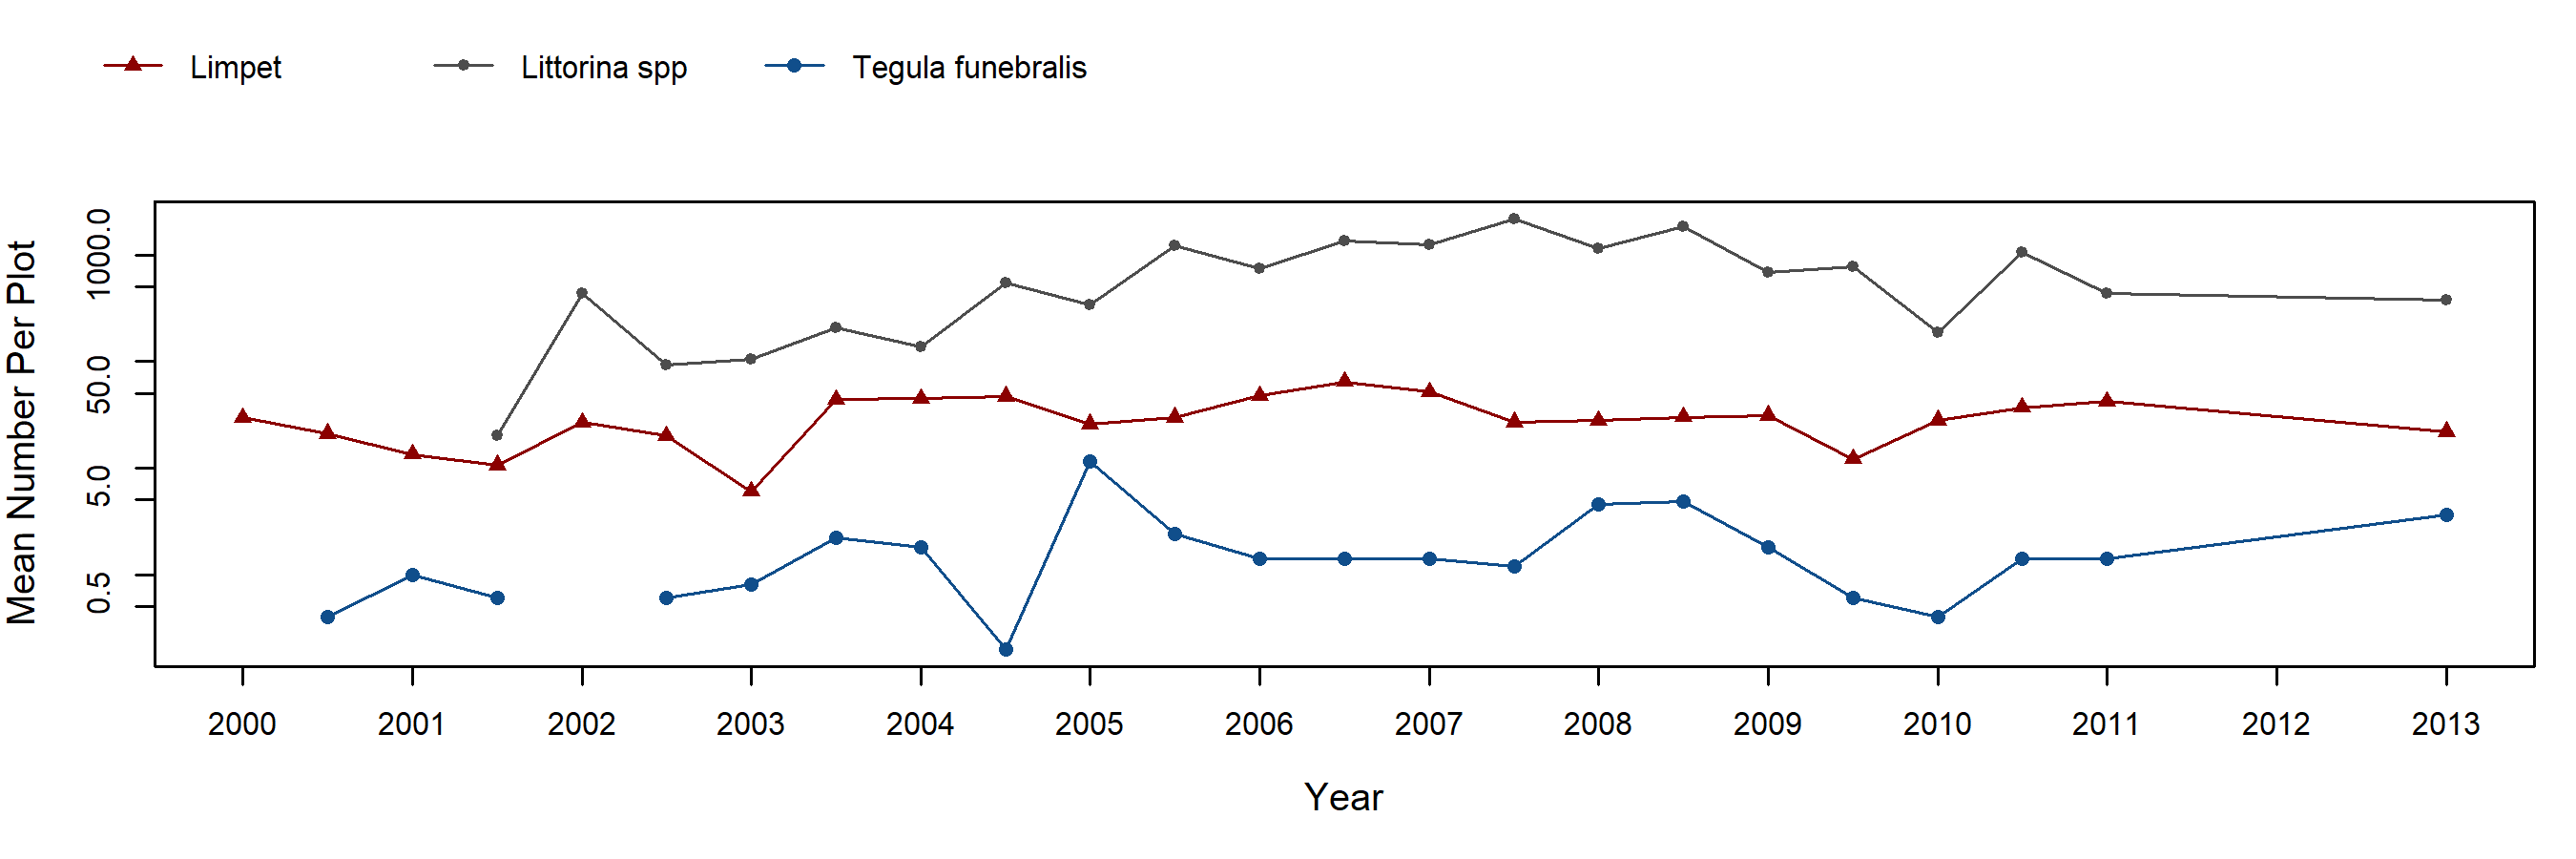
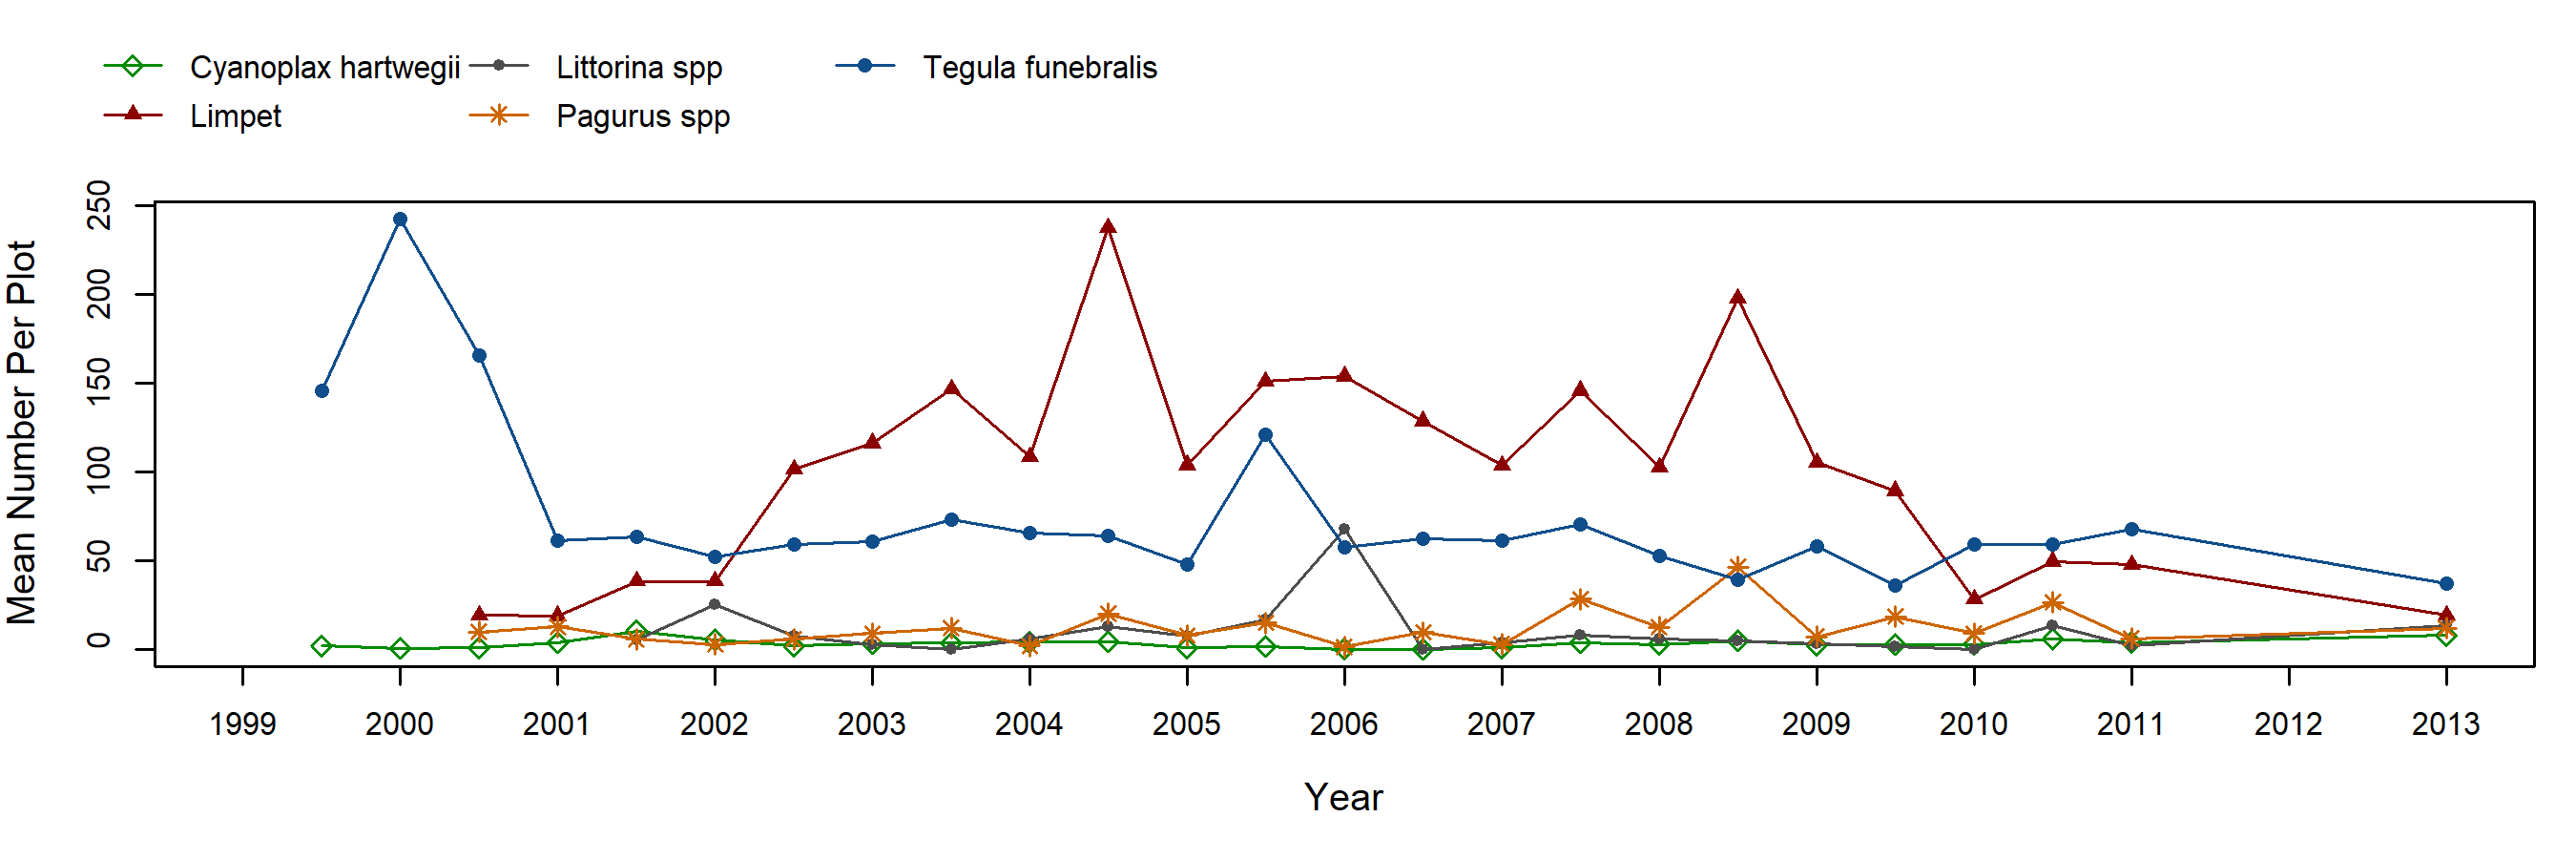
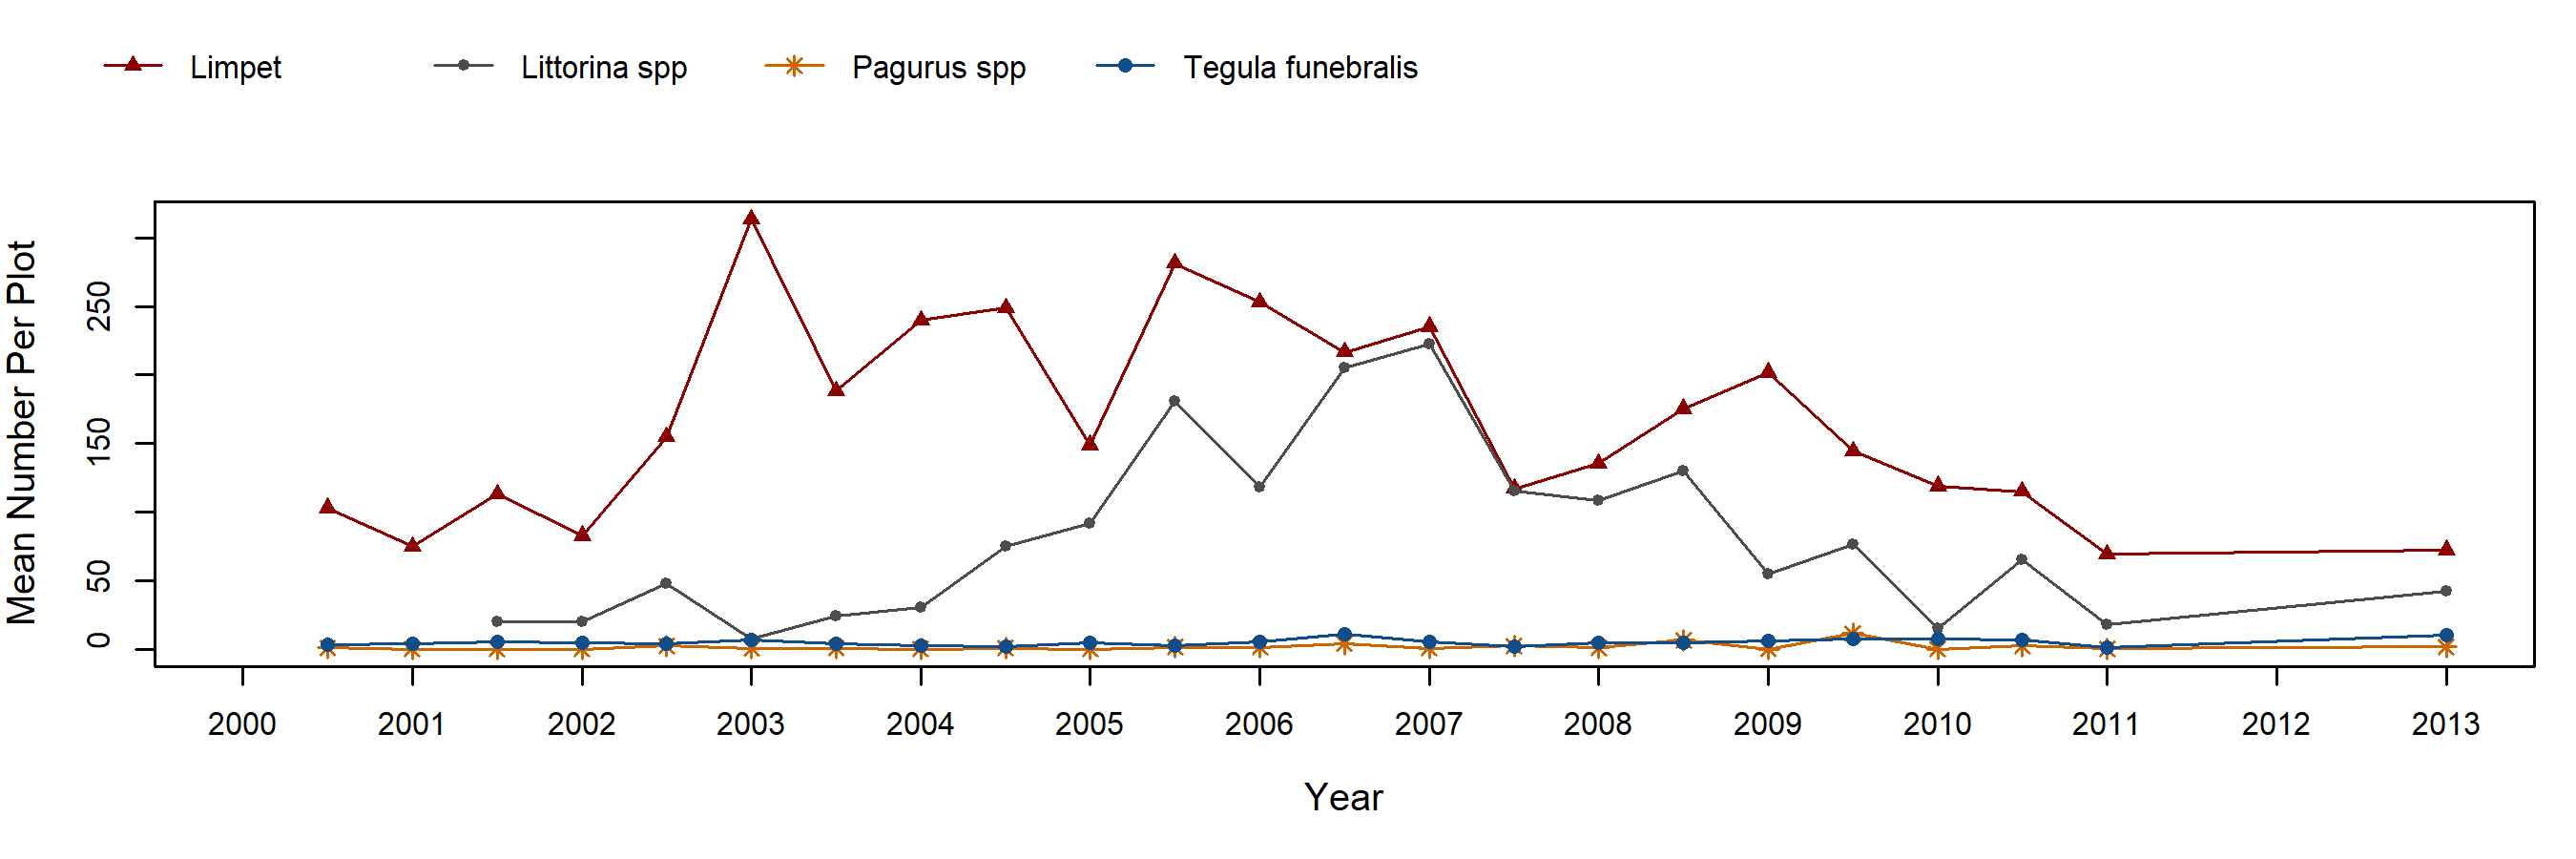
Chthamalus/Balanus (Acorn Barnacles) – motile invertebrate counts
Mytilus (California Mussel) – percent cover
Mytilus (California Mussel) – motile invertebrate counts
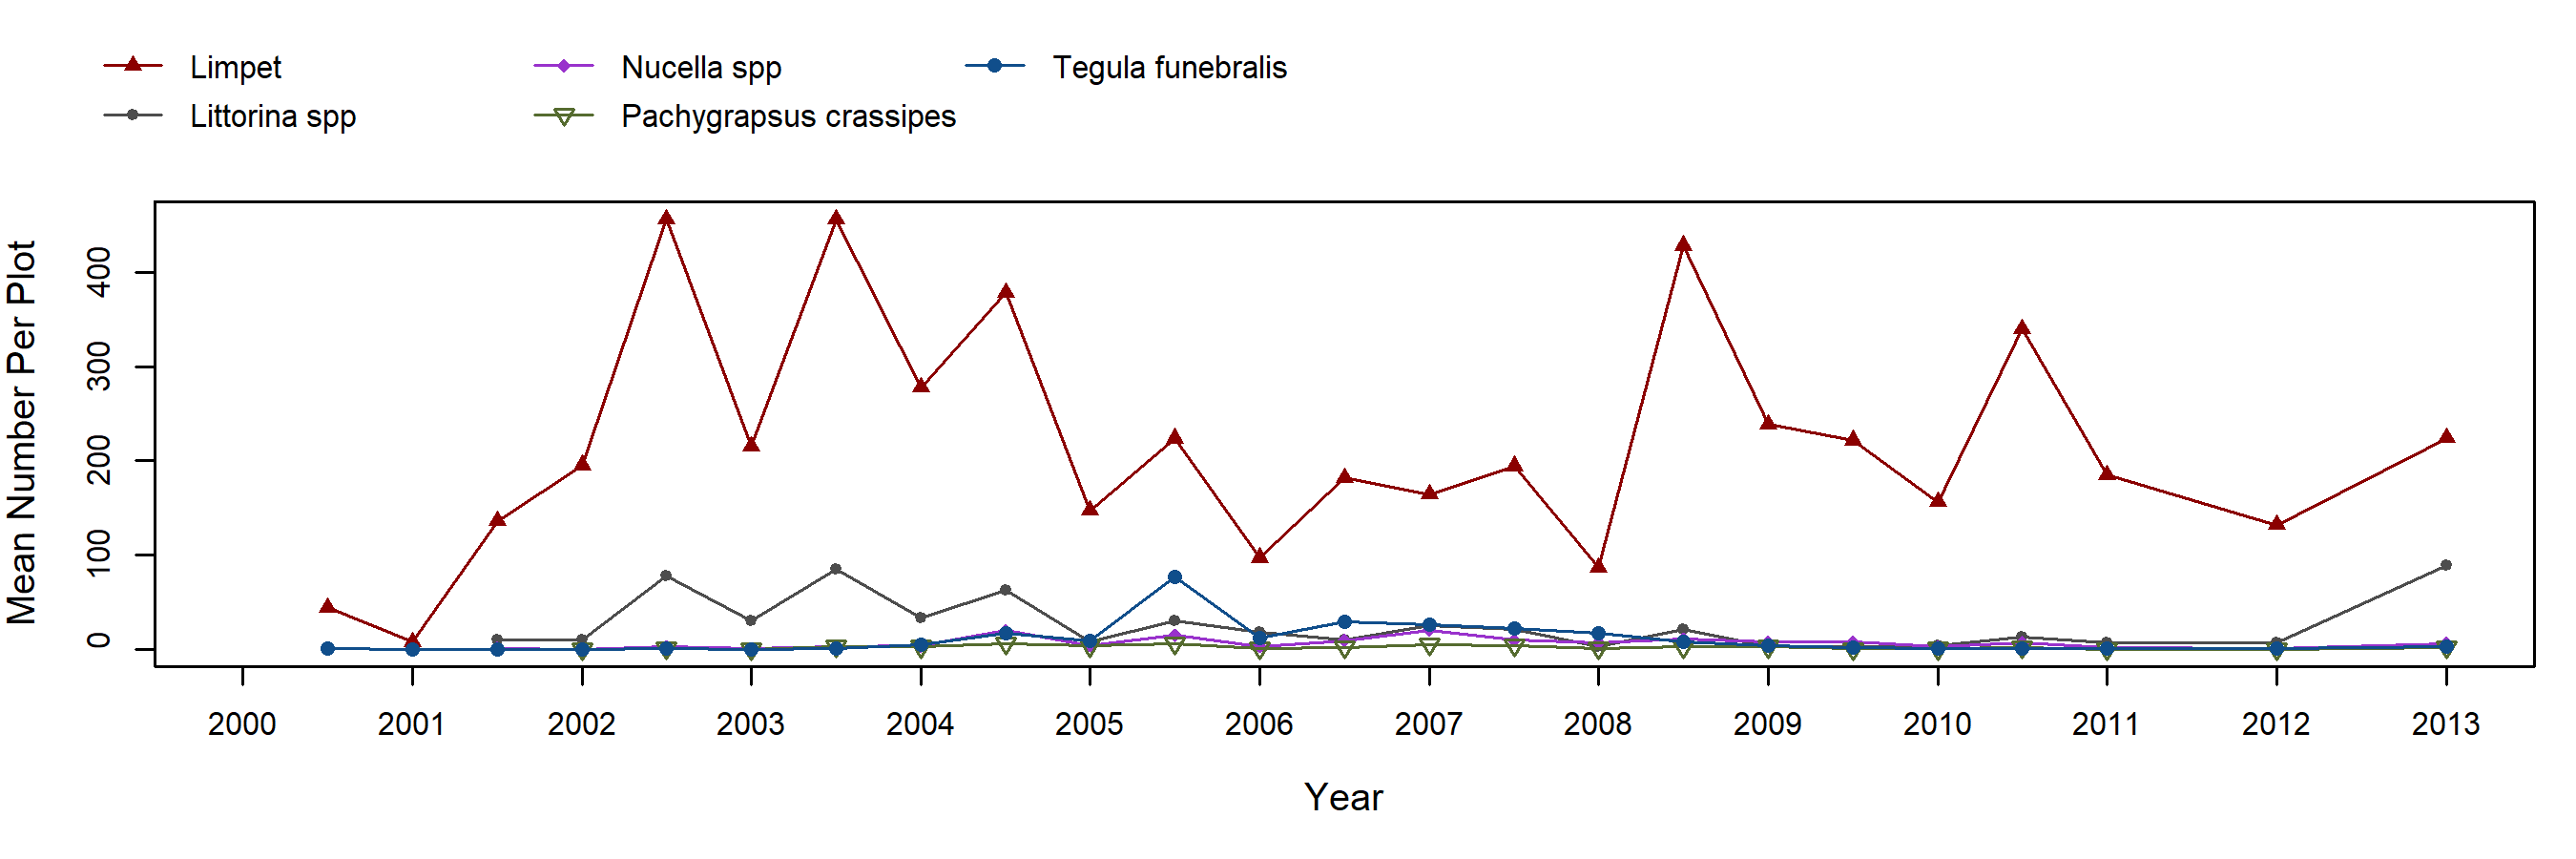
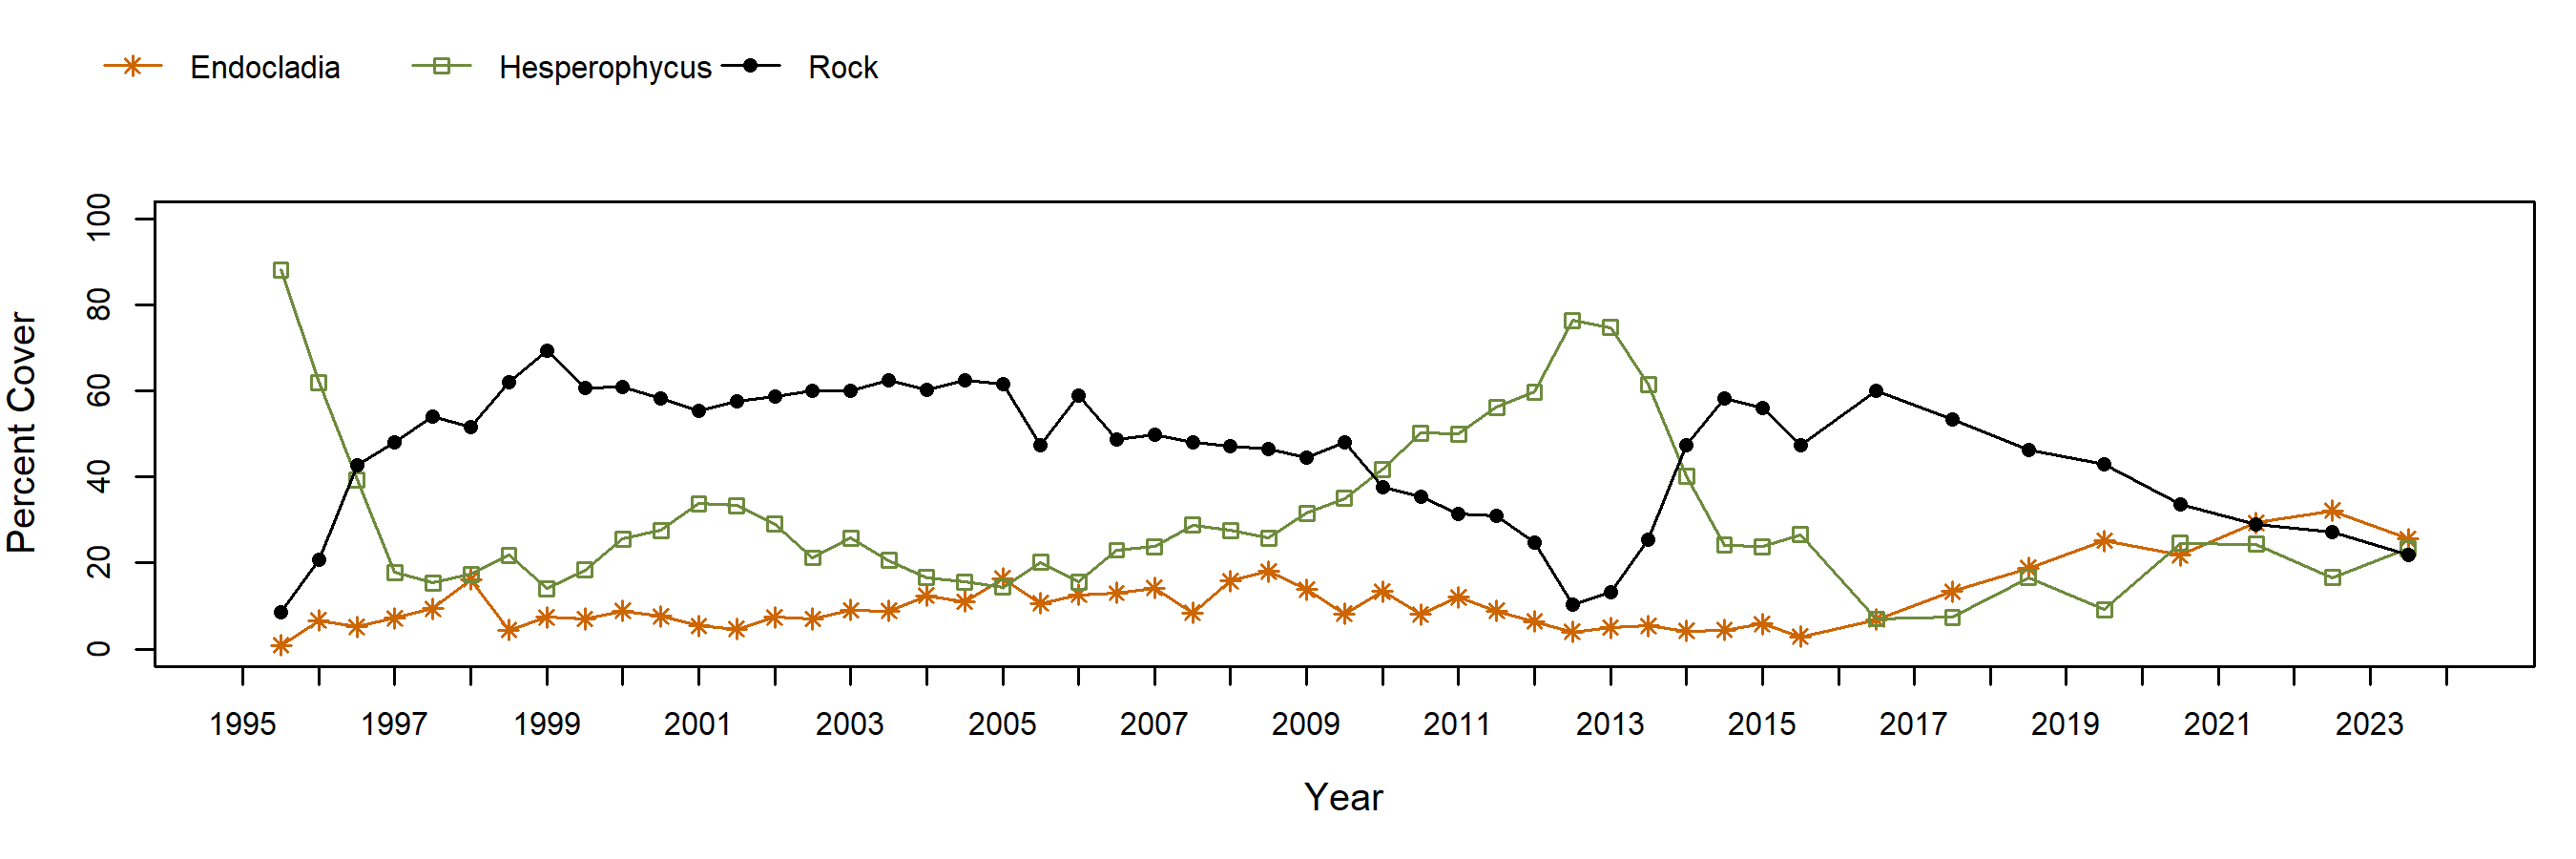
Hesperophycus (Olive Rockweed) – percent cover
Hesperophycus (Olive Rockweed) – motile invertebrate counts
Silvetia (Golden Rockweed) – percent cover
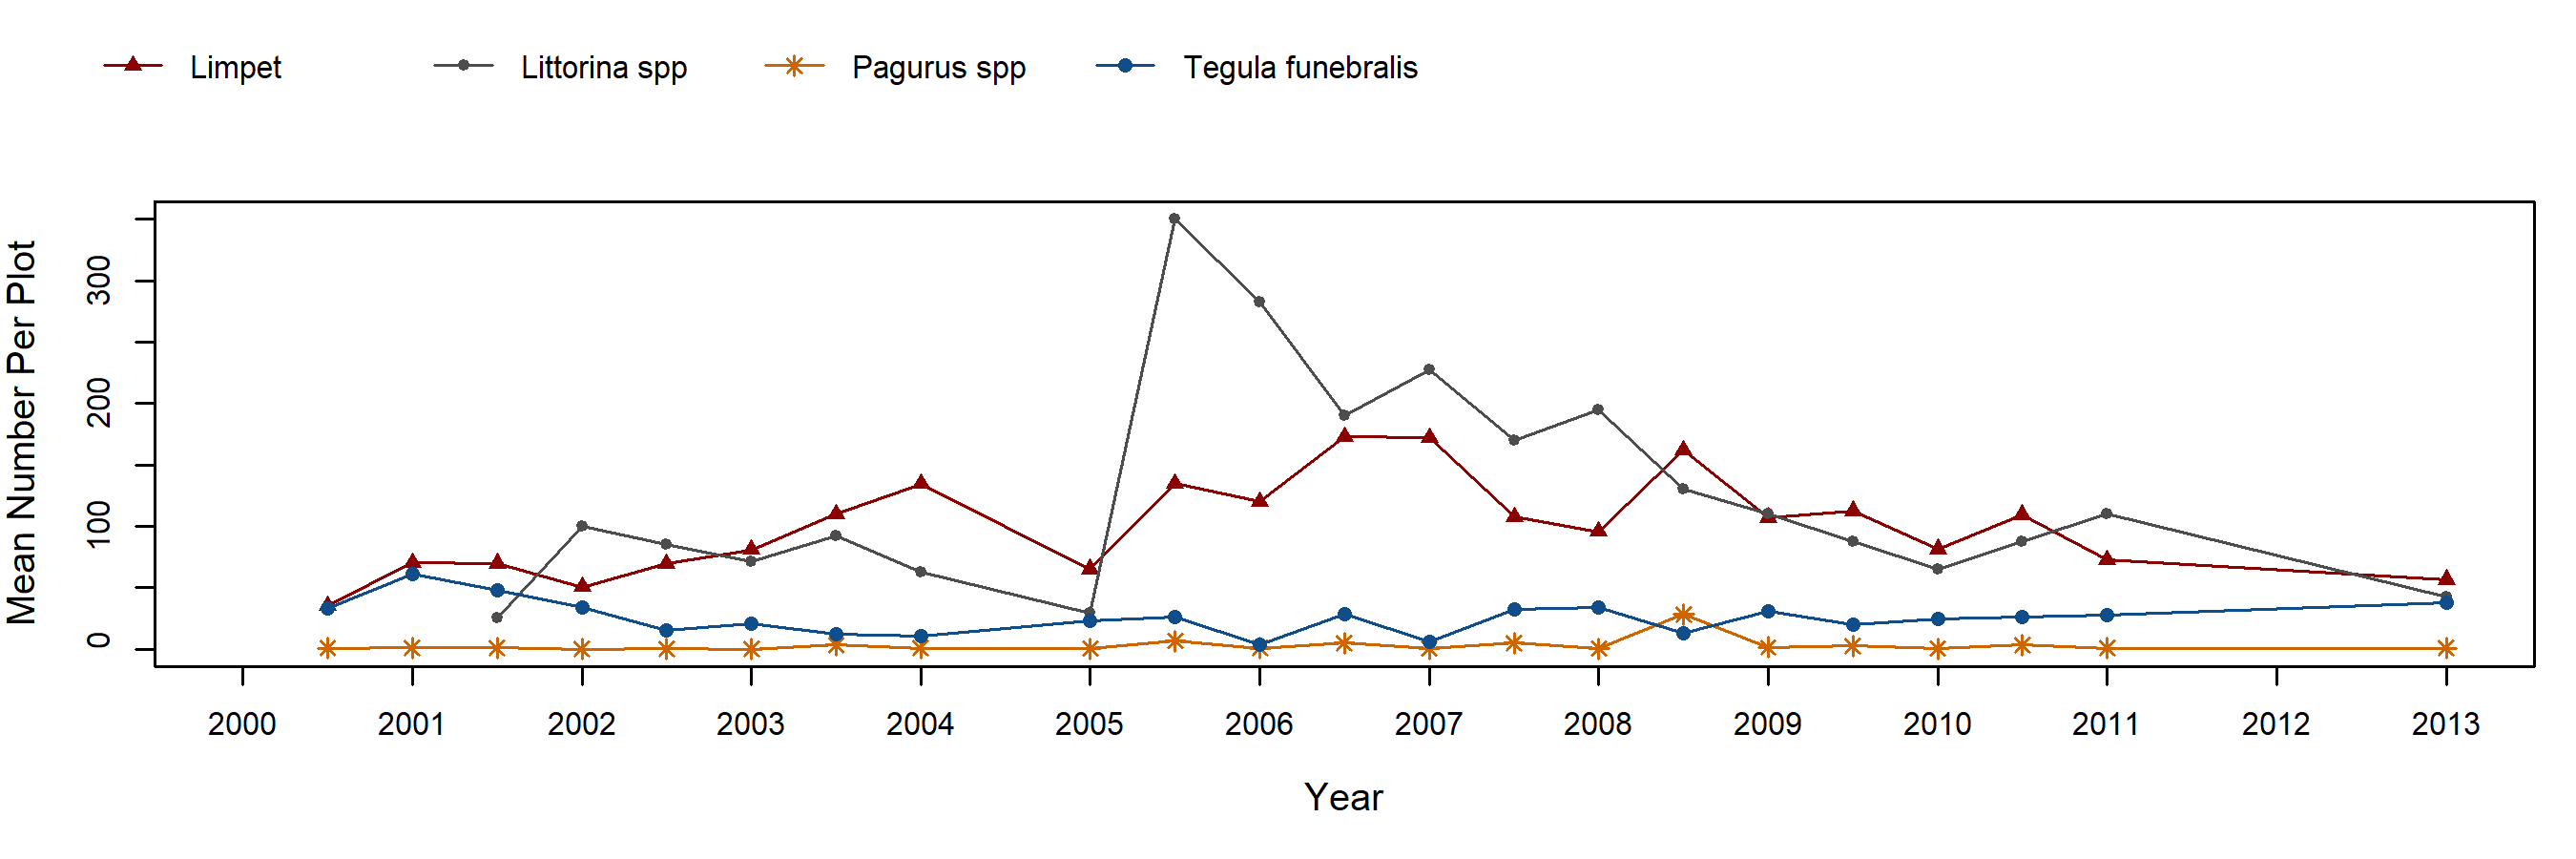
Silvetia (Golden Rockweed) – motile invertebrate counts
Endocladia (Turfweed) – percent cover
Endocladia (Turfweed) – motile invertebrate counts
Transects

Below are the trends observed for each Transect target species at this site. Long-Term trend graphs also include any species that reached a minimum of 25% cover during any single point in time within a given target species assemblage. Breaks in trend lines represent missed sampling events.
Phyllospadix (Surfgrass)
Species Counts and Sizes

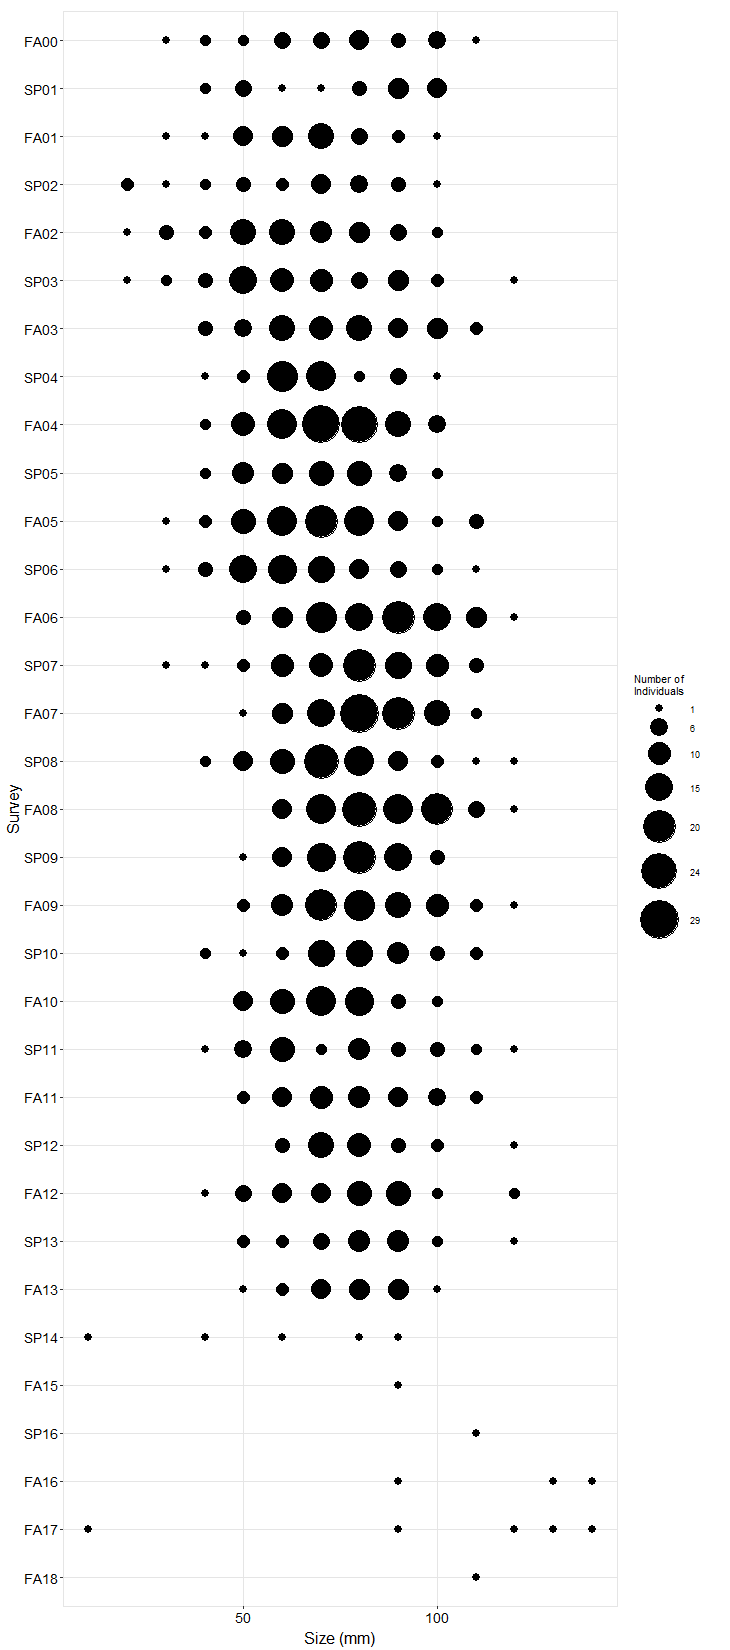
Species Counts and Sizes (where recorded) for Pisaster are shown below for this site. At some sites, other sea star species and Katharina are counted in addition to Pisaster. The sum of all individuals across all plots is displayed. Note that data gaps are represented by breaks in long-term count trend lines, but are not shown in size plots.
Pisaster ochraceus (Ochre Star) – counts
Pisaster ochraceus (Ochre Star) – sizes