Coal Oil Point Long-Term trends | MARINe

Coal Oil Point Long-Term trends

See below for trend graphs

In order to standardize species resolution across all MARINe groups, and over time, some species (typically rare) were lumped for graphical presentation of Long-Term monitoring data. See lumped categories for definitions (some variation occurs between methods and over time). Due to funding constraints, semi-annual sampling at this site was reduced to annual sampling (Fall only) beginning in 2019.

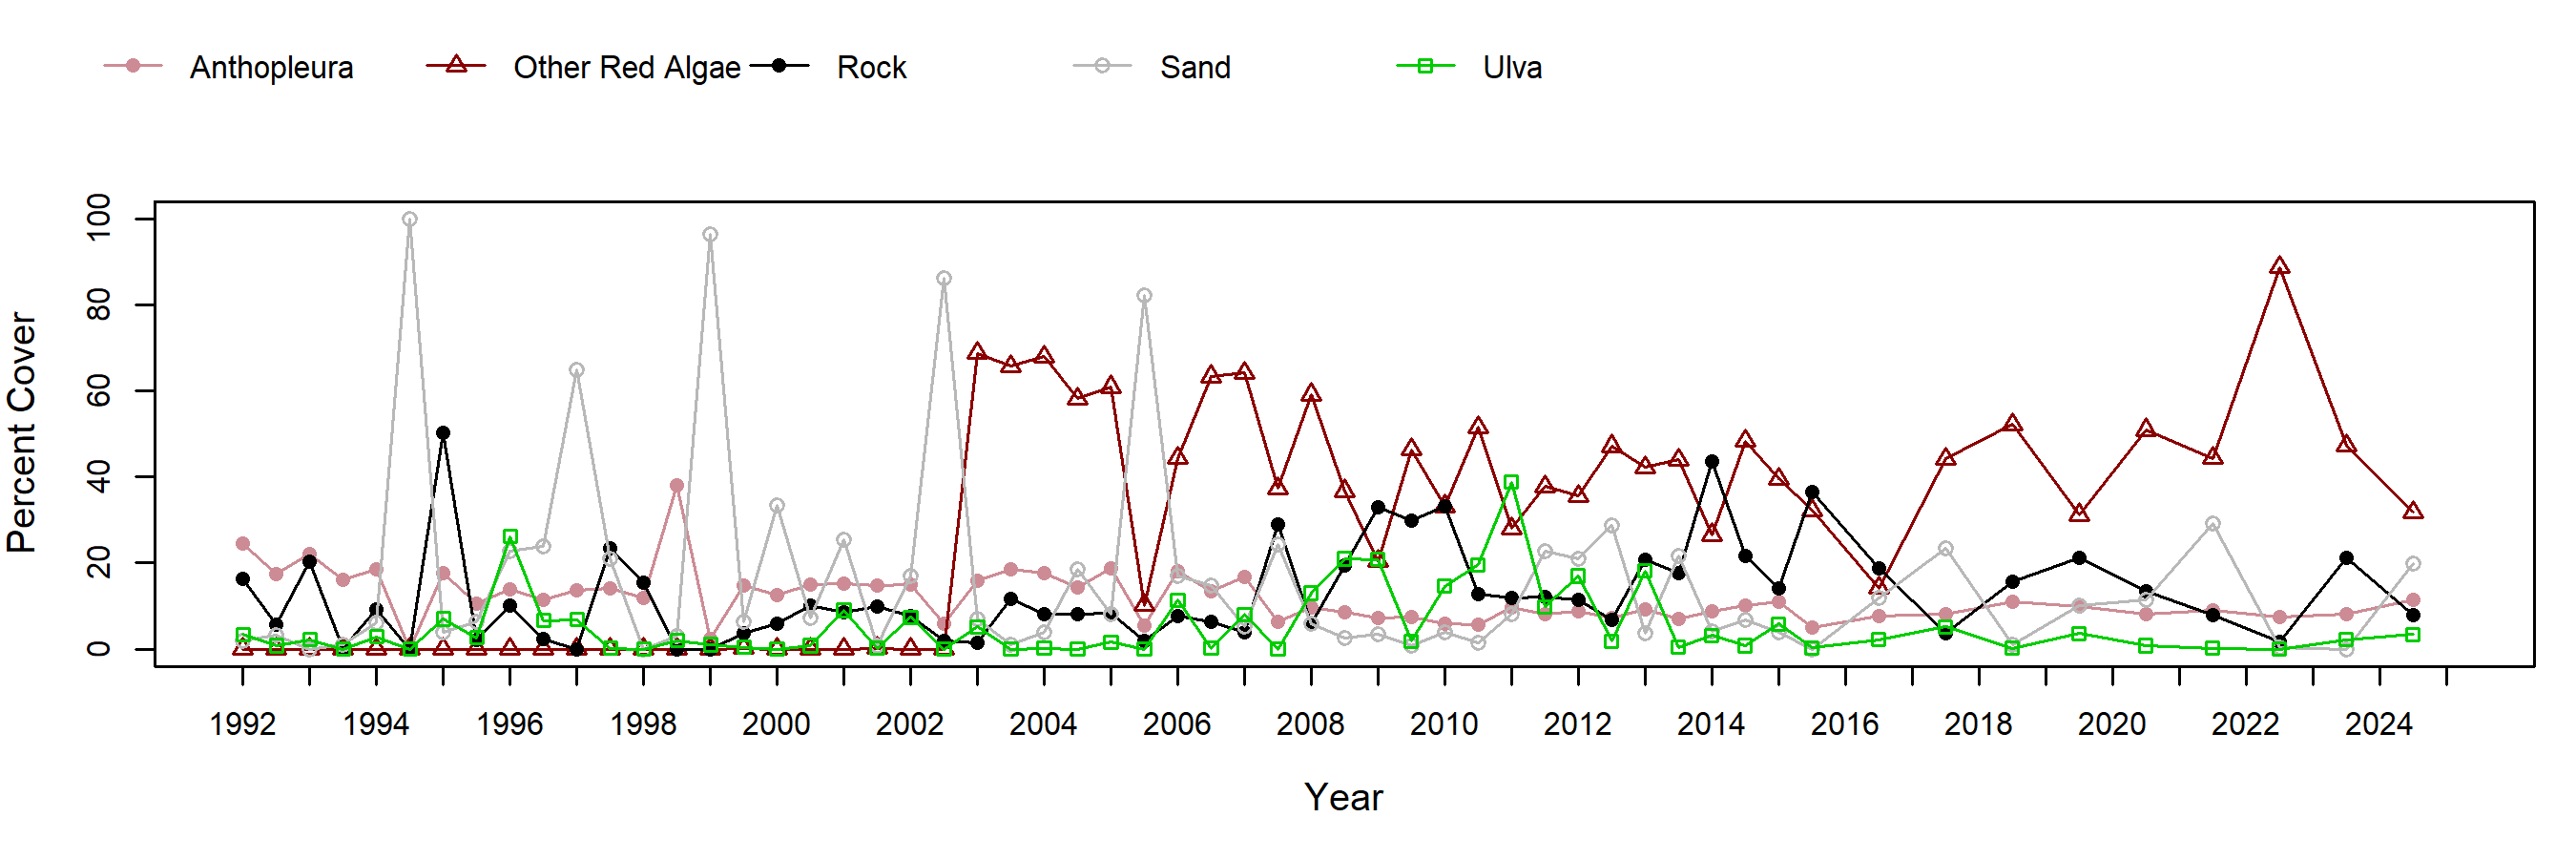
The anemone plots at Coal Oil Point consist primarily of the solitary anemone, Anthopleura sola rather than the colonial anemone Anthopleura elegantissima (note that these were considered a single species prior to the past several years and they are not distinguished in our sampling methods). Cover of Anthopleura gradually declined  from around 25% in 1992 to less than 10% in 2010, and has remained relatively consistent in the range of 10-15% since then. Surveys in 1994 and 1999 occurred during periods of near complete sand burial and recorded zero anemone cover, however it is more than likely that anemones survived the temporary cover given the consistency of cover over the years and research showing their ability to persist beneath sand. Aside from sand, the dominant taxa occupying these plots are species of filamentous red algae which have been lumped with a few other seldom-encountered species into the "other red algae" category. Red algae have fluctuated wildly and appear to be inversely correlated with sand inundation. Ulva, an ephemeral green algae, increased in cover between 2008 and 2013, but has declined again in recent years.

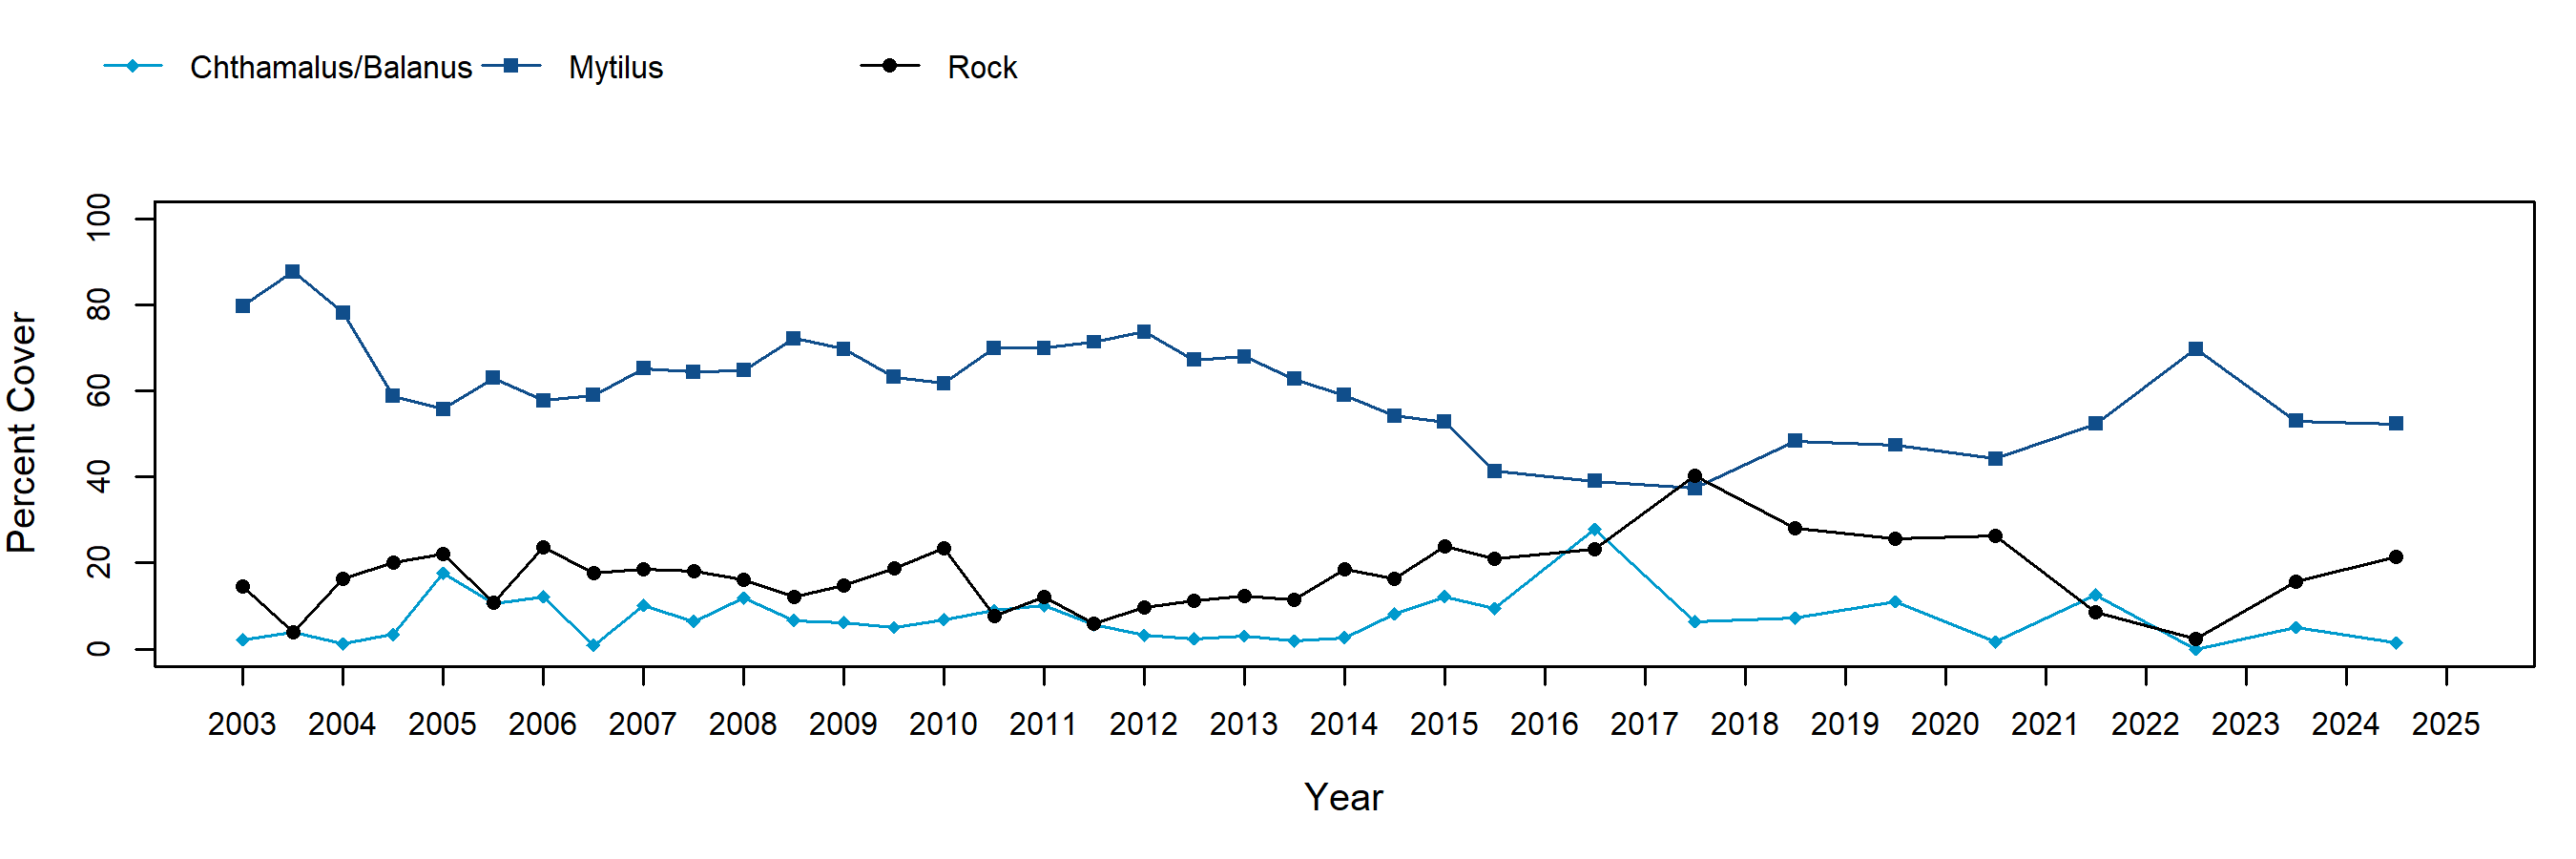
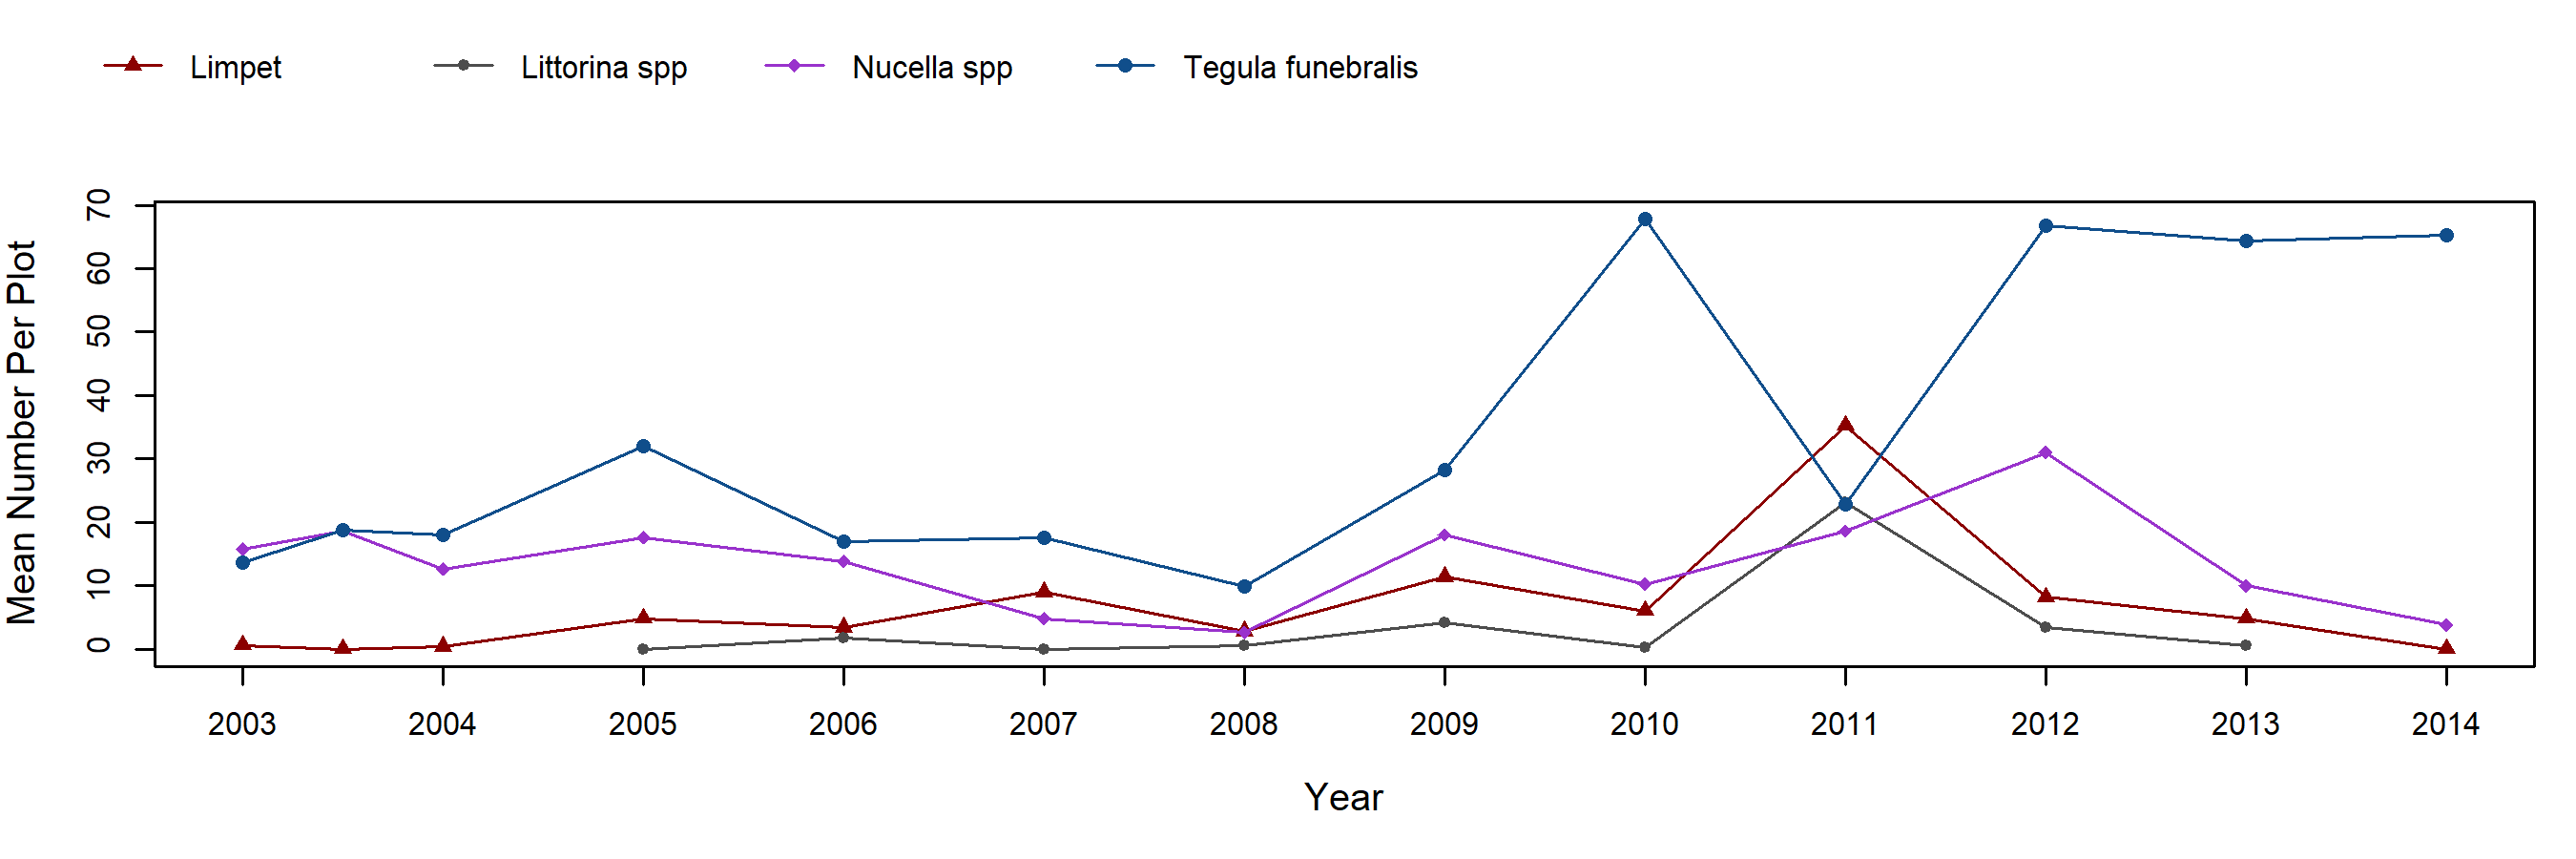
Mussel plots were added to this site in the fall of 2003. The mean cover of Mytilus declined initially from around 80% to around 60% by the fall of 2004. Much of the decline was the result of a single plot in which a mussel breakout gave way to an open patch of rock and barnacles that has persisted since that time. Mytilus cover remained stable at this new level until 2013 at which time cover began a gradual decline to a low of 40% by 2017. Recent surveys have shown a very modest increase and no significant recruitment has been observed in this area of the site, however the offshore mussel bed has built back significantly in 2018-2019. Annual motile invertebrate sampling has occurred in these plots since their inception (always in the spring, though with an additional sampling in the fall of 2003). Limpets along with Nucella spp. and Tegula funebralis snails have undergone slight fluctuations during this time, until the dramatic increase in Tegula in 2010. Motile invertebrate counts in mussel plots were discontinued in 2015. 

The mean cover of Surfgrass (Phyllospadix) fluctuated widely from 1992 to 2006 at Coal Oil Point indicating seasonal variation (lower in spring, higher in fall) along with intermittent periods of sand burial. Through those years, the average cover of Phyllospadix hovered around the 60% to 80% range. Dips below that level were the result of sand burial, rather than  rhizome loss, as indicated by the pairing of each drop with rebounds in cover the following survey. Even where leaves were lost, the plants would quickly regenerate from the rhizomes upon emergence from burial. This seasonal pattern was not observed from 2003 to 2005 where a steady increase was recorded. Seasonal variation returned in 2006, but then in 2007 the surfgrass population crashed in the absence of sand burial, and this time there was extensive rhizome loss as well. Mean surfgrass cover declined to almost zero by the spring of 2008, replaced by increased filamentous red algae and bare rock. Over the next decade, surfgrass has recovered steadily, reaching historical high levels again by 2019.

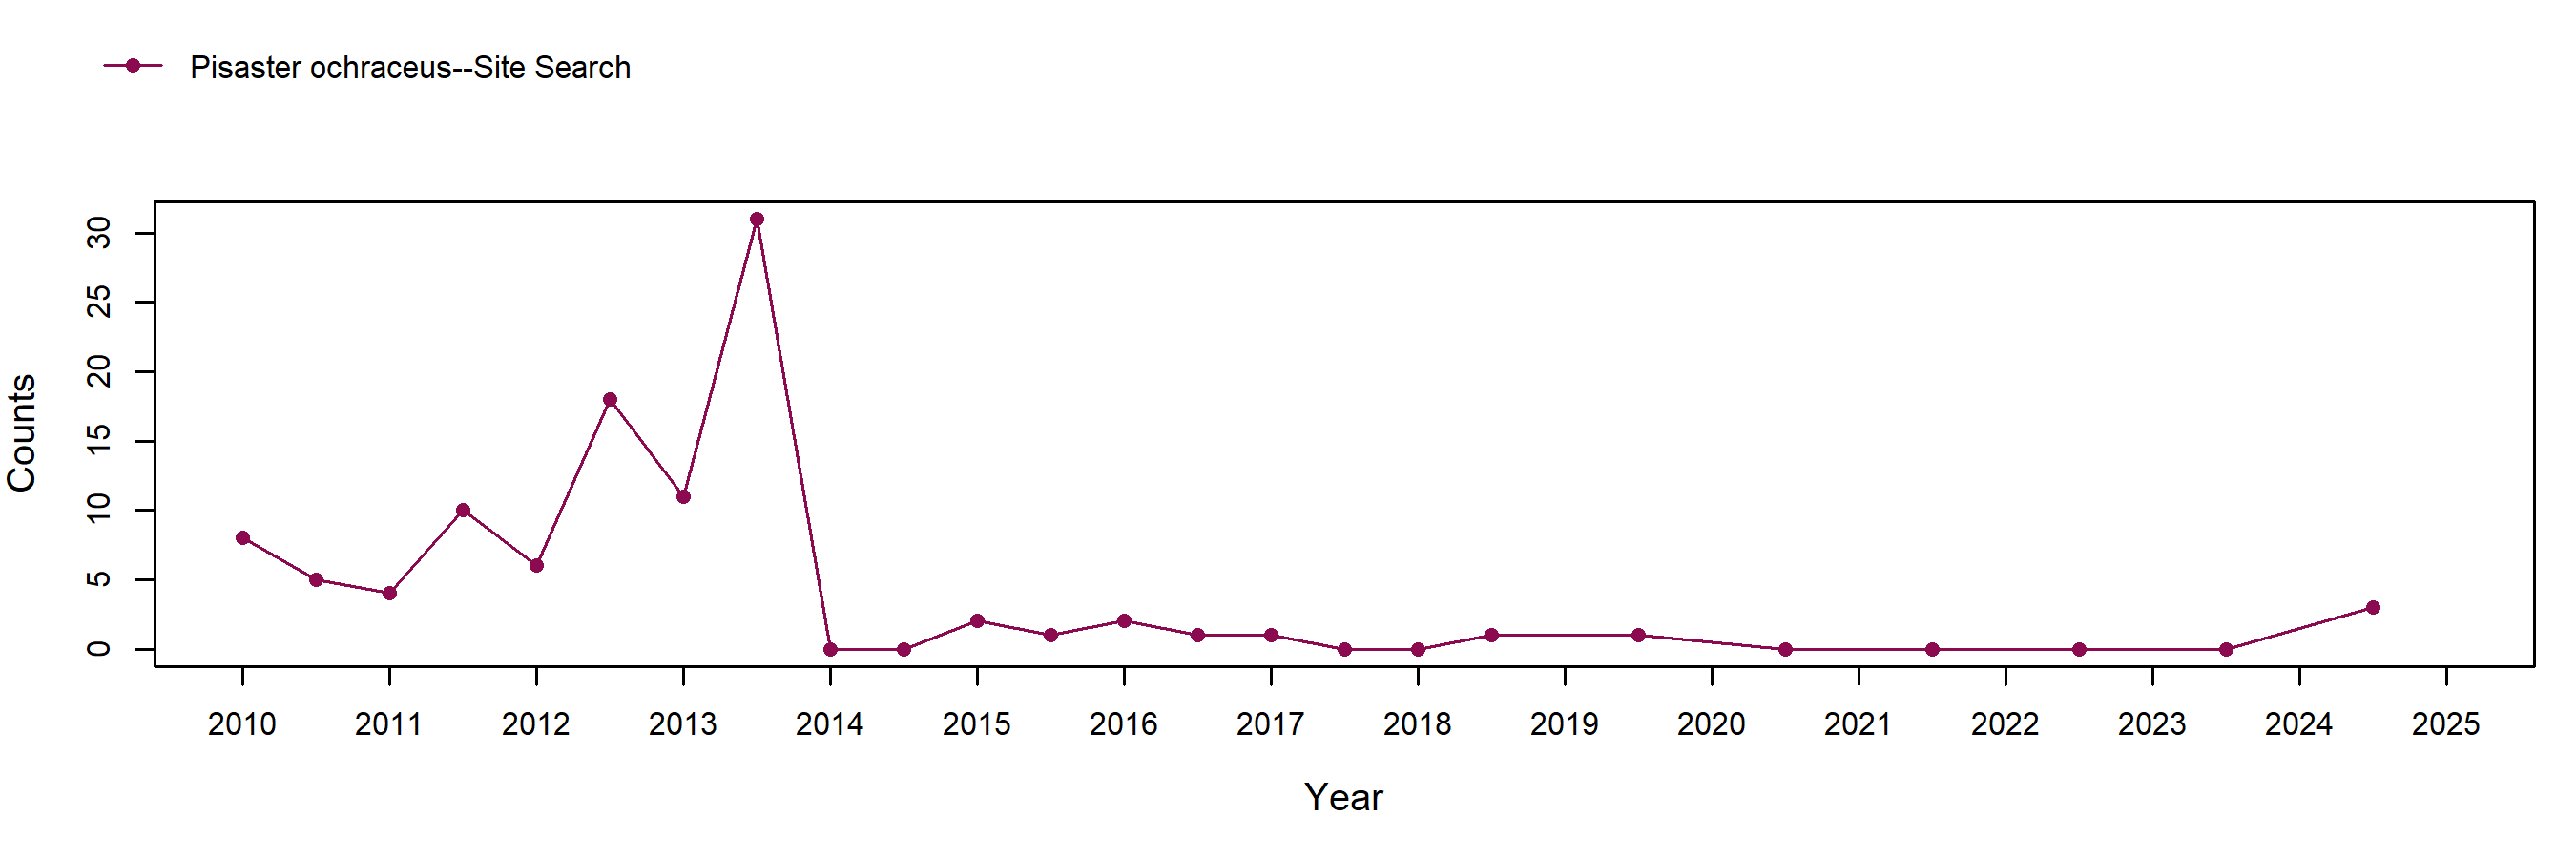
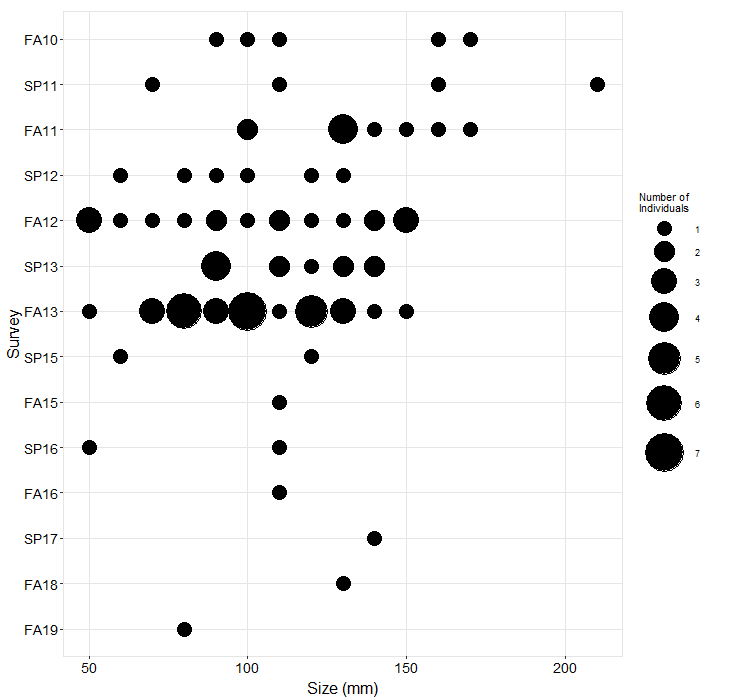
In the time since this site was established in 1992, the numbers of sea stars at Coal Oil Point has never been significantly high, especially compared to other nearby sites, likely because of the low relief nature of the sandstone/shale rocky point itself. Beginning in 2010, sitewide searches for sea stars have been performed each sampling event. Between 5-10 stars were found in each of the first five sampling seasons. Then over 15 stars were found in the fall of 2012 and in the fall of 2013, when the seastar wasting disease was starting to spread in Santa Barbara County, over 30 stars were found. One of those stars in fall 2013 was recorded as diseased as it contained a small, though questionable, lesion; all other stars appeared healthy. But then all the stars were gone by the next sampling event in spring 2014 and no stars were found in the sitewide search of fall 2014 either. In order to determine if sea stars were returning to a different part of the local area, two very large plots were added in the Fall of 2014 (irregular plots). These plots encompass all of the rocky areas upcoast ~300m and downcoast ~400m from our monitoring site. No more than 5 stars total have ever been found within these extremely large survey areas and most recently, only a single star was found between the sitewide and irregular plot surveys. Sea stars smaller than 50mm have never been recorded at this site on any survey to date indicating that the arrival of stars to this site is likely driven by movement of stars in and out of the subtidal, rather than by recruitment to the intertidal itself.

Photo Plots

Long-Term methods Photo Plot thumbnail

Below are the trends observed for each Photo Plot target species at this site. Long-Term percent cover trend graphs also include any species that reached a minimum of 25% cover during any single point in time within a given target species assemblage. Breaks in trend lines represent missed sampling events. For additional species observed that did not meet this 25% threshold, please use the Interactive Map.

For motile invertebrate Species Counts, a mean across all plots was calculated, and only those species with a value of at least 5 individuals for at least one sample are shown. Due to time constraints, motile invertebrate counts have not been done at most sites since 2012. For motile invertebrate size trend graphs by site, please use the Interactive Map.

Anthopleura (Anemones)

Coal Oil Point Anthopleura trend plot

 Mytilus (California Mussel) - percent cover

Coal Oil Point Mytilus trend plot

Mytilus (California Mussel) - motile invertebrate counts

Coal Oil Point Mytilus trend plot

Transects

Long-Term methods Transects thumbnail

Below are the trends observed for each Transect target species at this site. Long-Term trend graphs also include any species that reached a minimum of 25% cover during any single point in time within a given target species assemblage. Breaks in trend lines represent missed sampling events.

 Phyllospadix (Surfgrass)
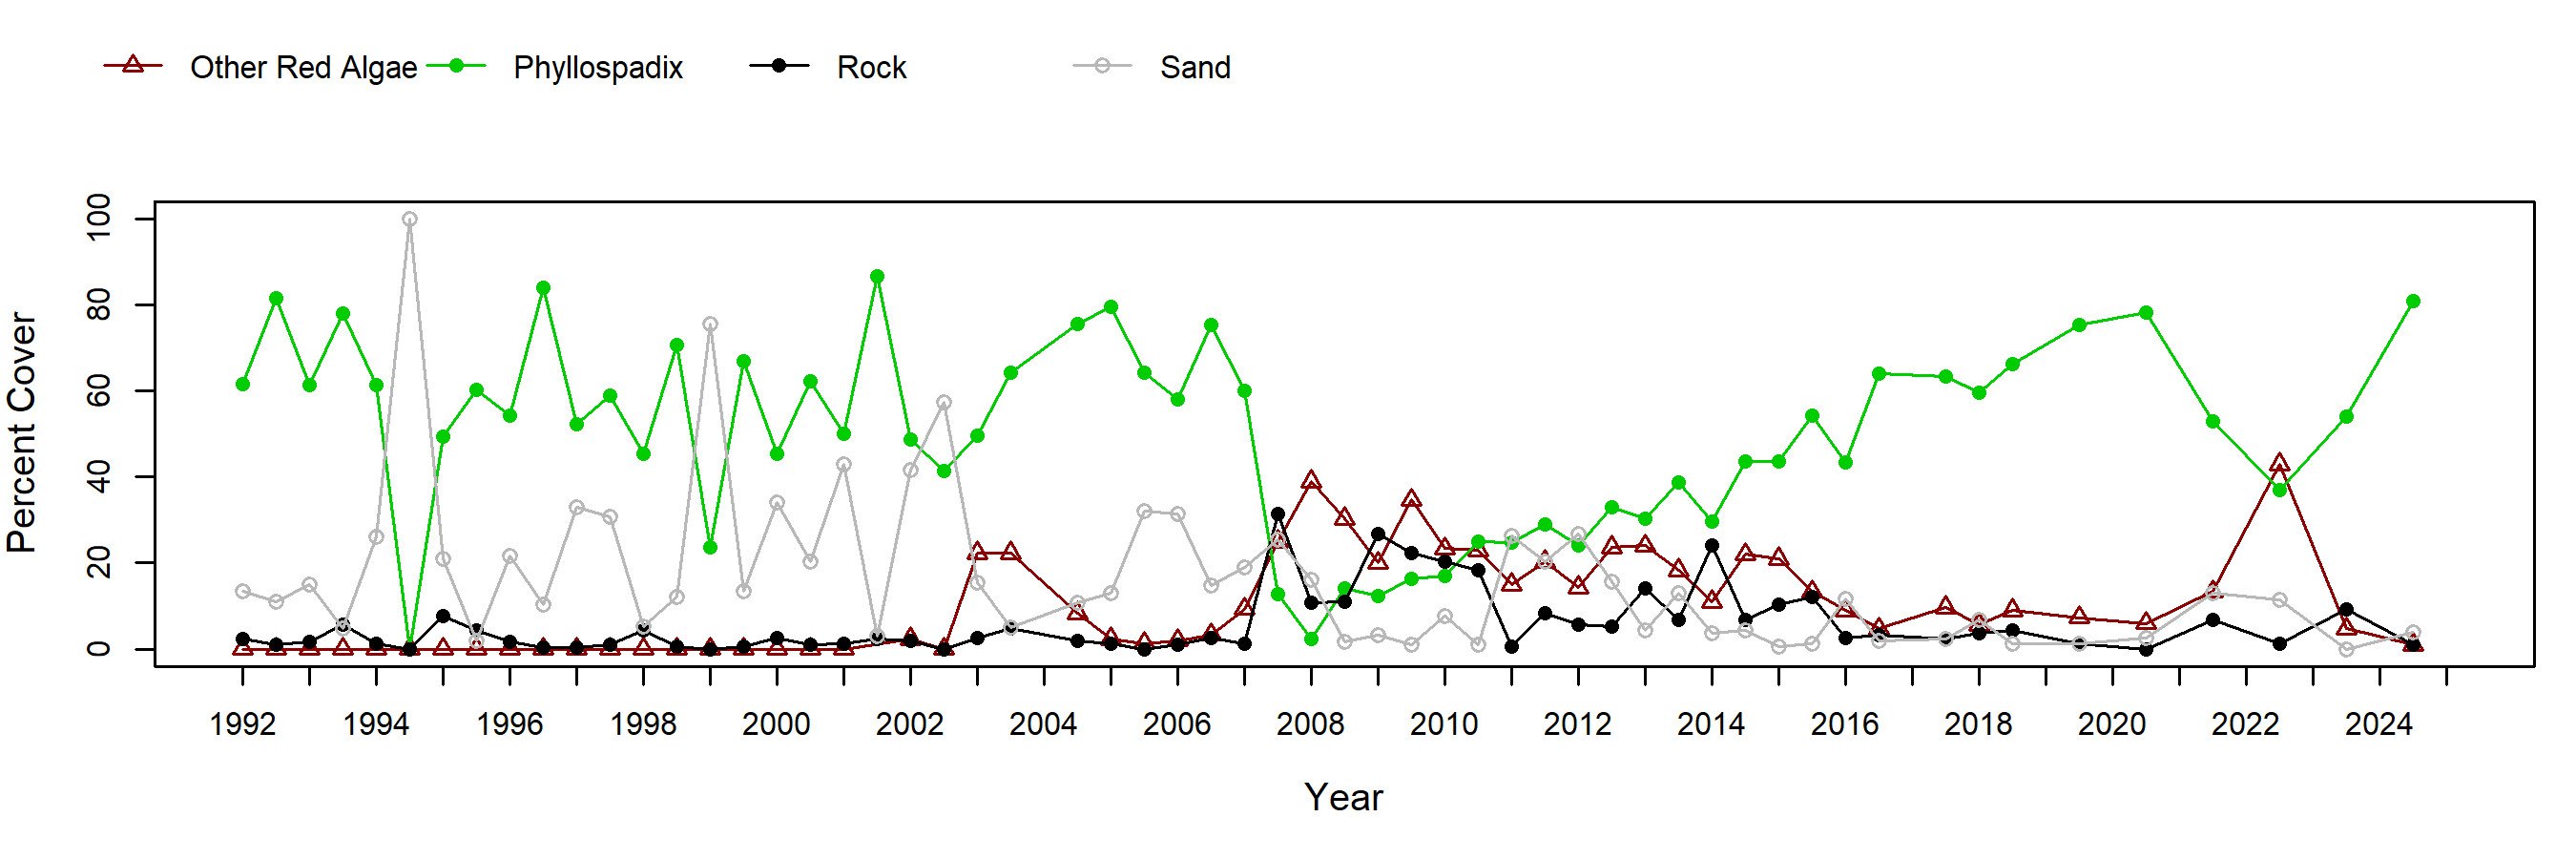
Coal Oil Point surfgrass trend plot

Species Counts and Sizes

Long-Term methods Counts thumbnail

Species Counts and Sizes (where recorded) for Pisaster are shown below for this site. At some sites, other sea star species and Katharina are counted in addition to Pisaster. The sum of all individuals across all plots is displayed. Note that data gaps are represented by breaks in long-term count trend lines, but are not shown in size plots.

 Pisaster (Ochre Star) - counts

Coal Oil Point Pisaster trend plot

Pisaster ochraceus (Ochre Star) - sizes

Coal Oil Point Pisaster size plot

See Also