
Crystal Cove Long-Term trends | MARINe
Crystal Cove Long-Term trends
See below for trend graphs
In order to standardize species resolution across all MARINe groups, and over time, some species (typically rare) were lumped for graphical presentation of long-term monitoring data. See lumped categories for definitions (some variation occurs between methods and over time). Due to funding constraints, semi-annual sampling of plots/transects was reduced to annual sampling beginning in 2016.
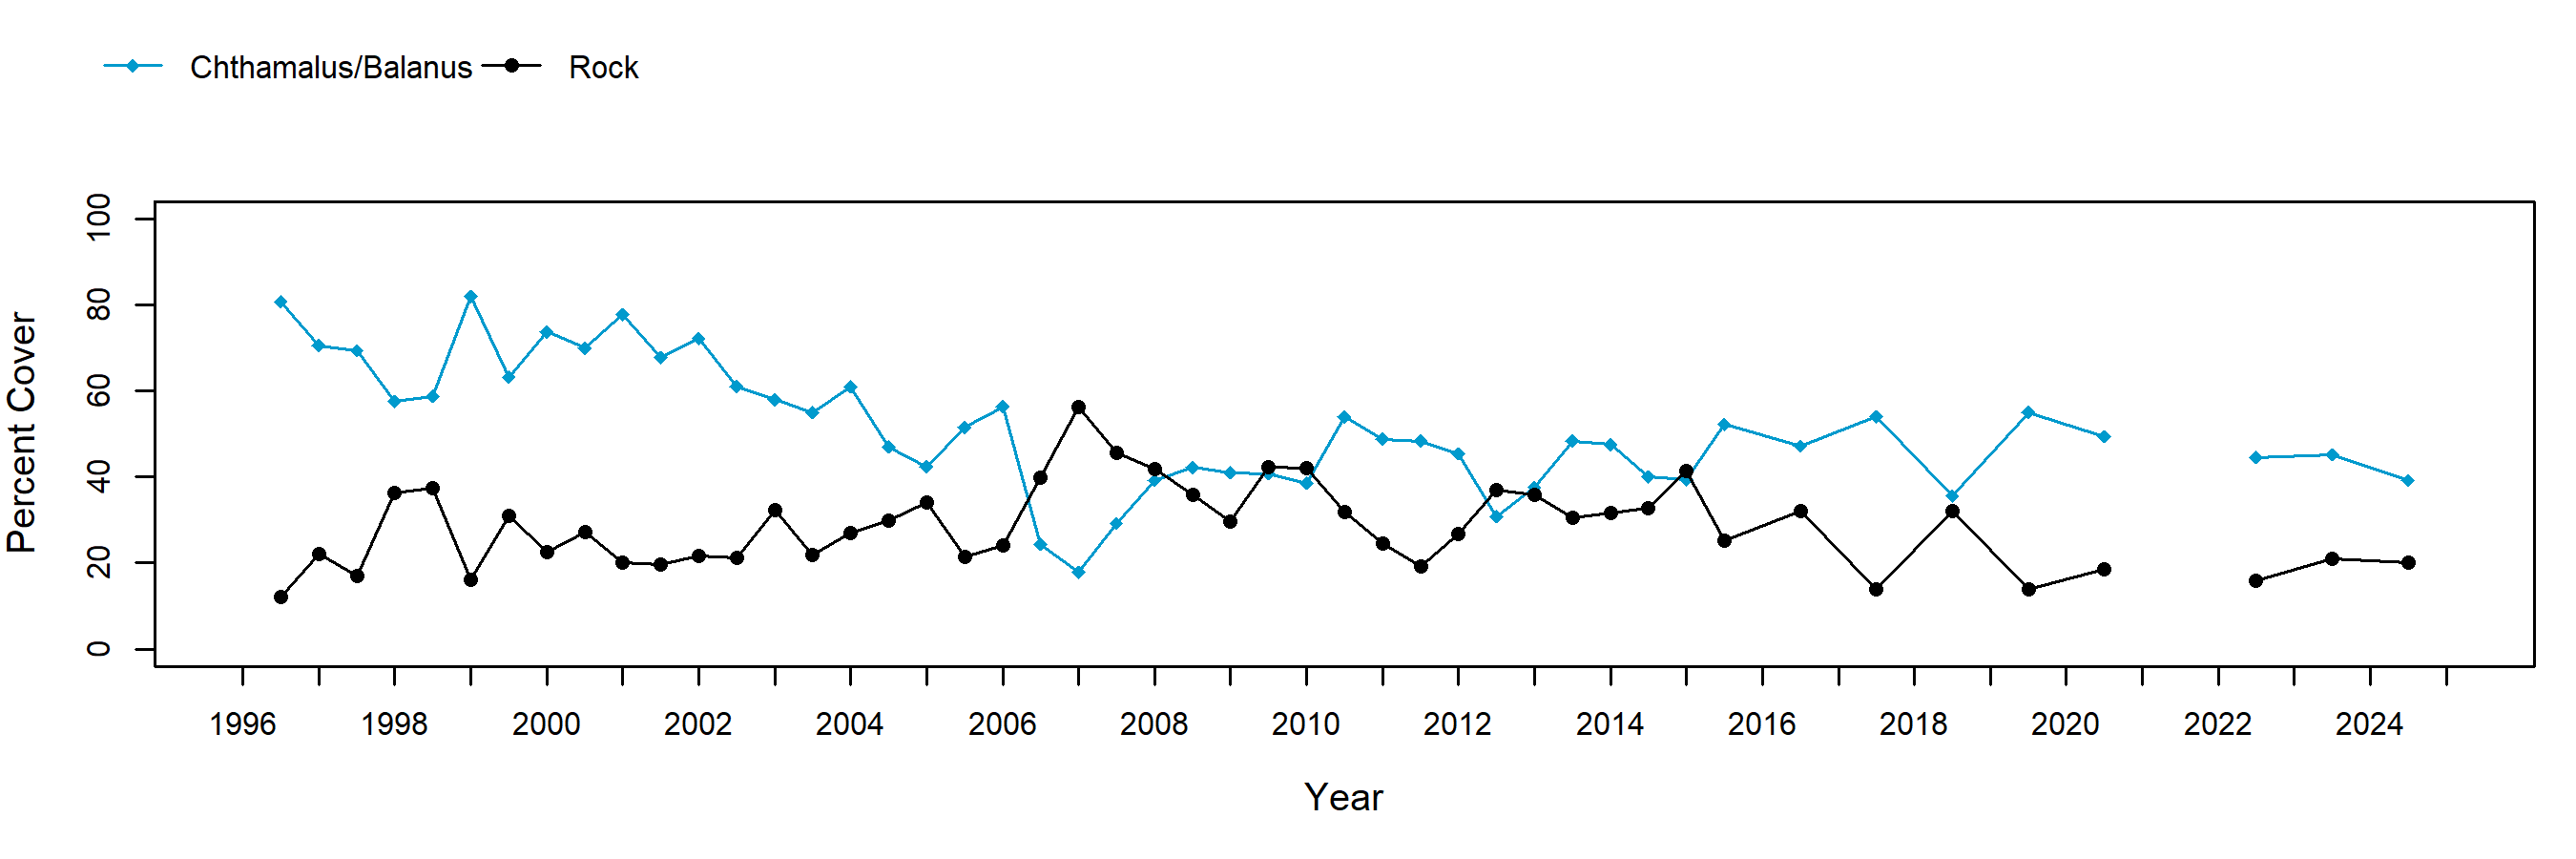
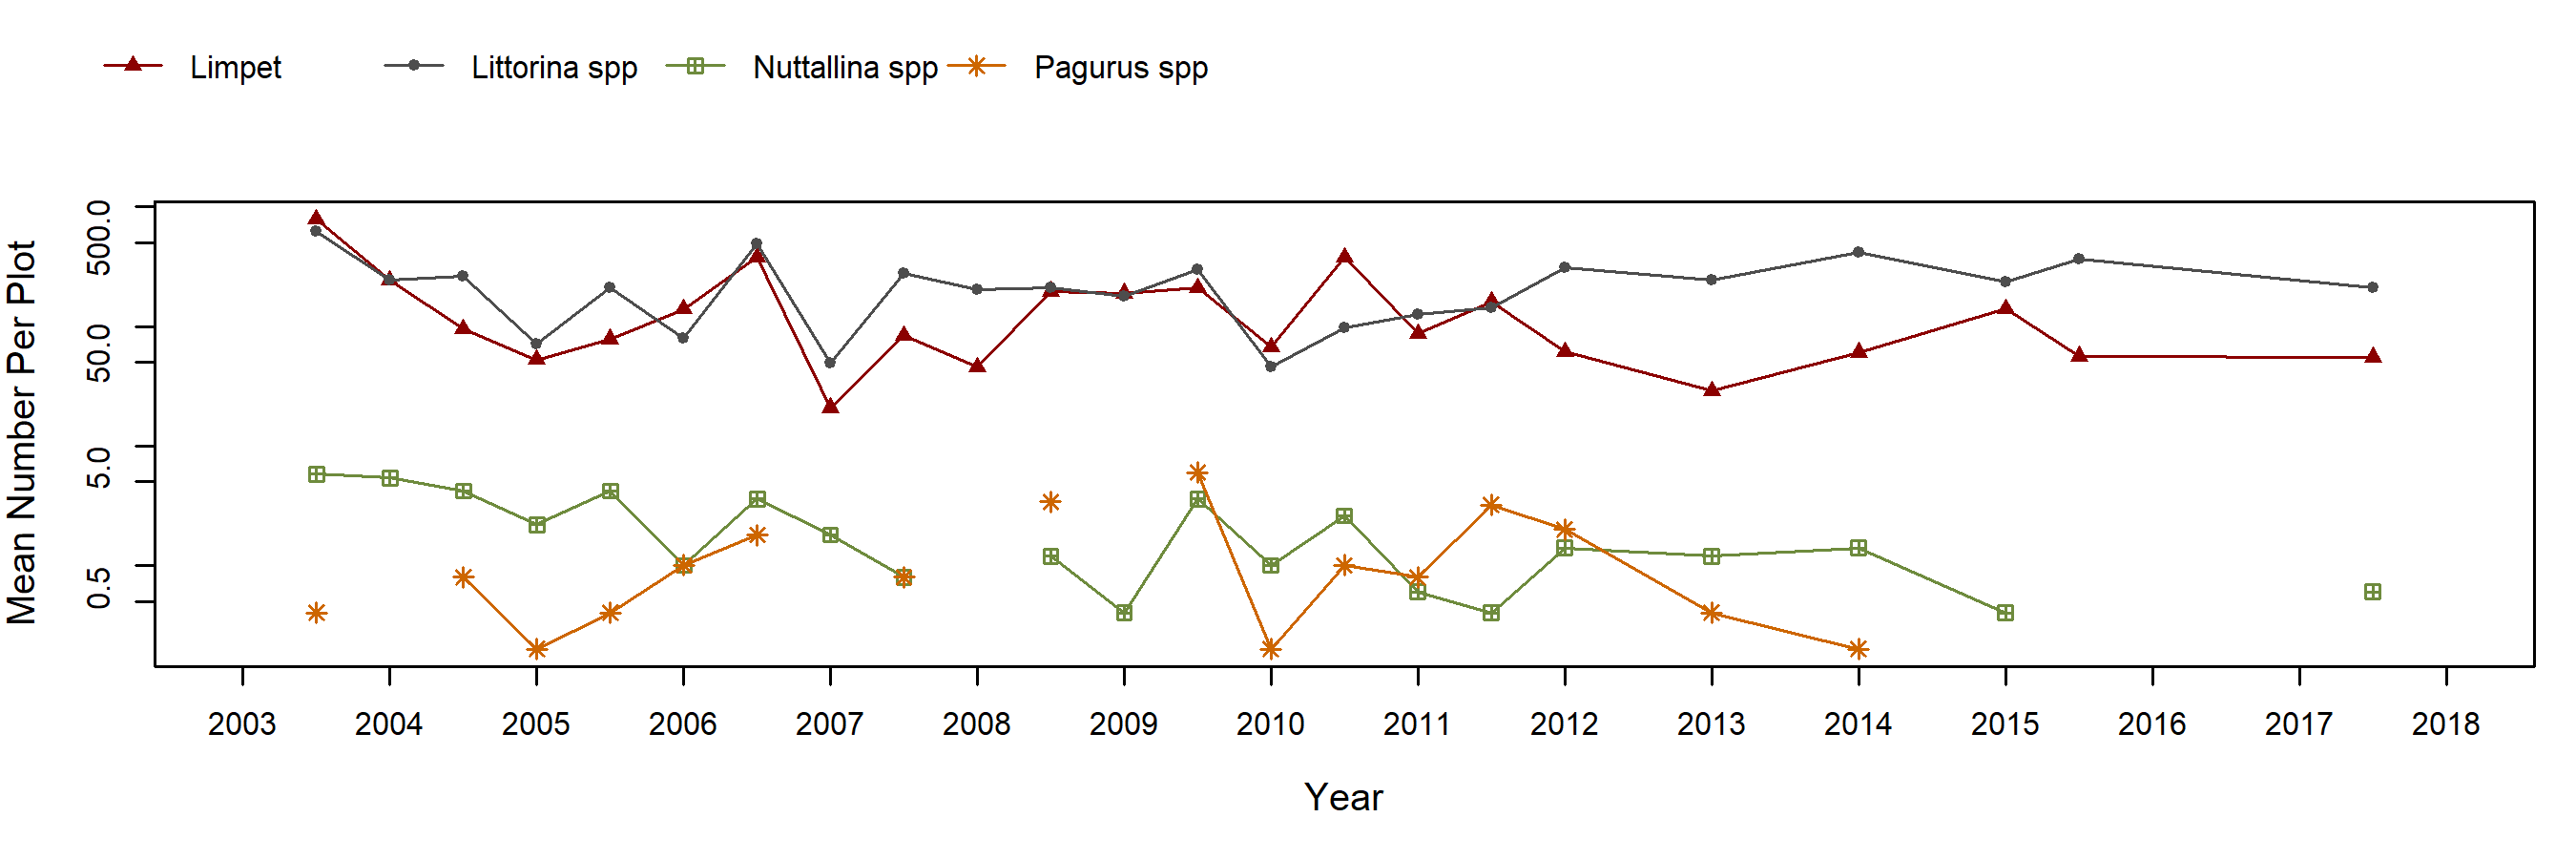
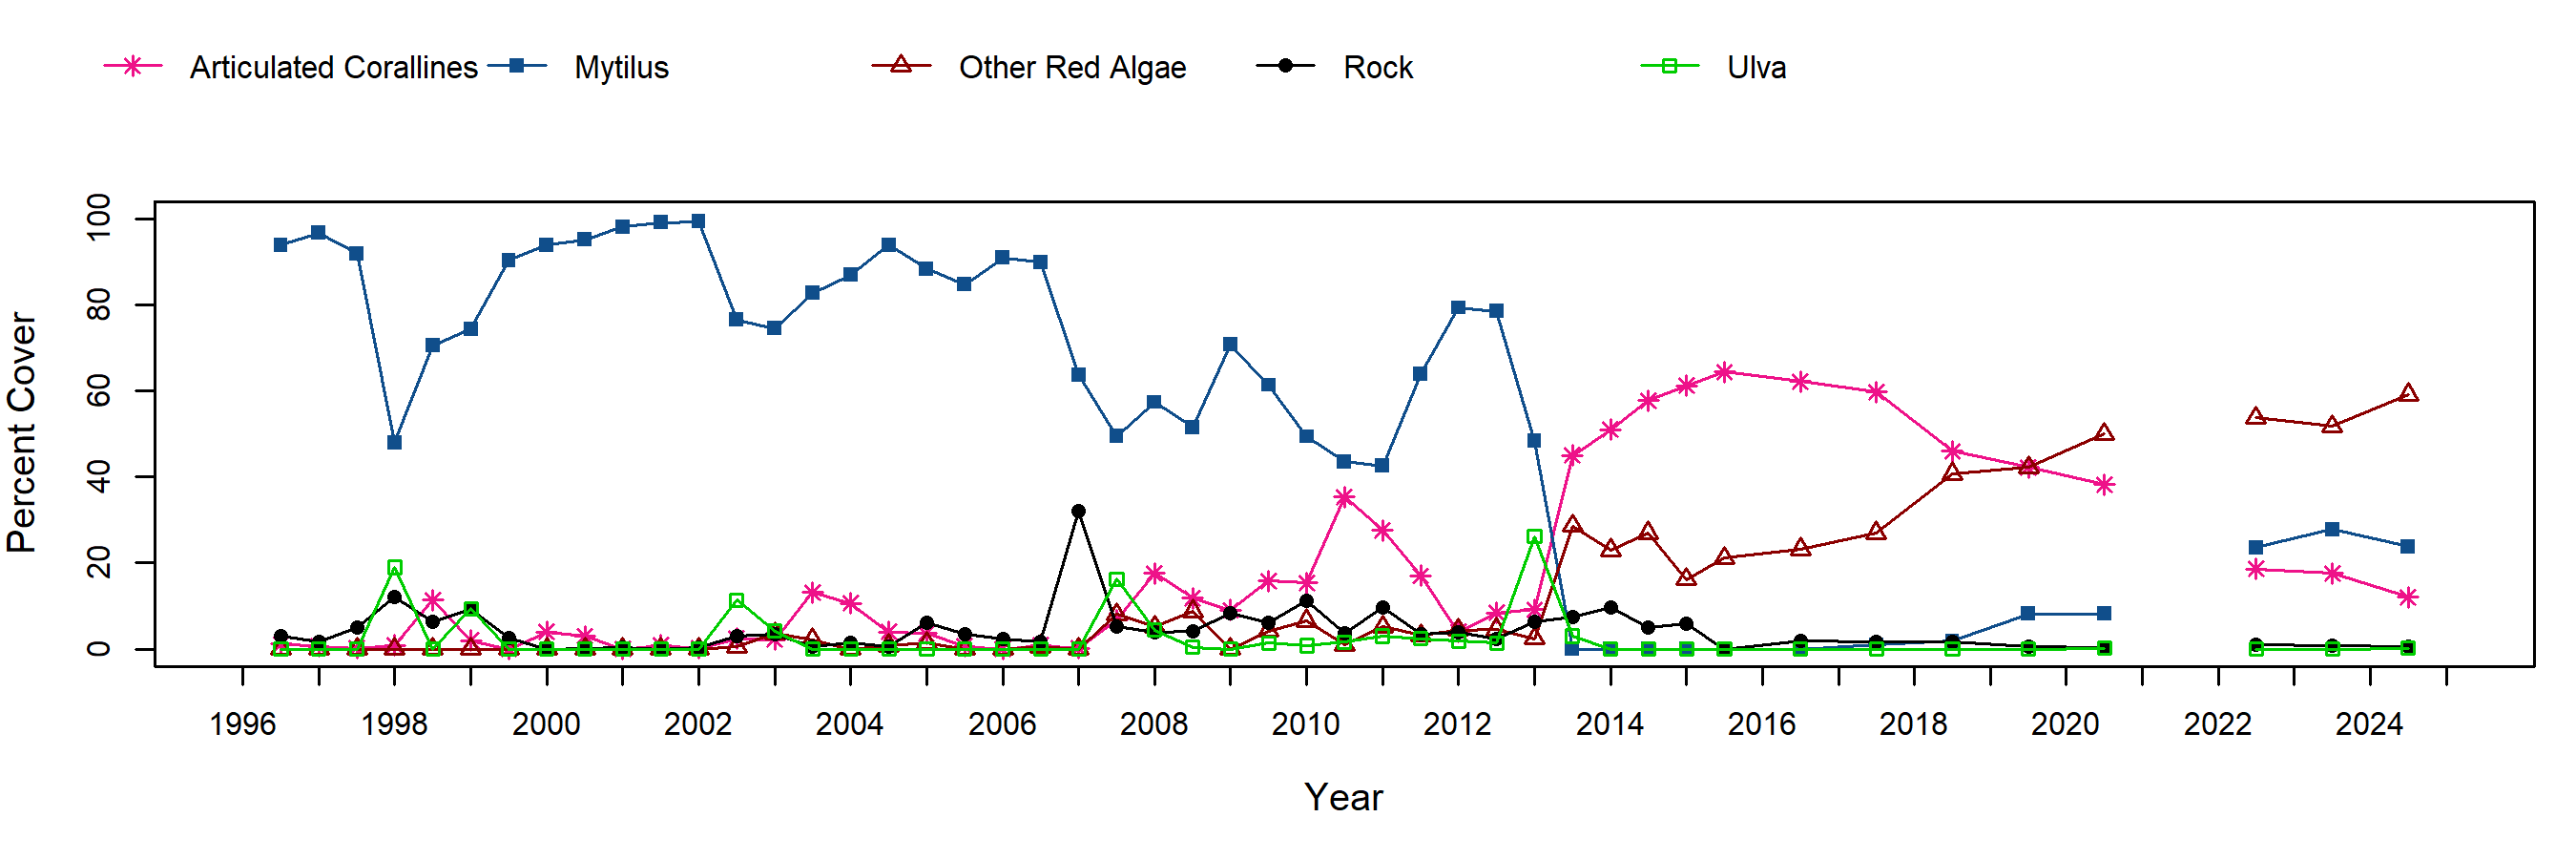
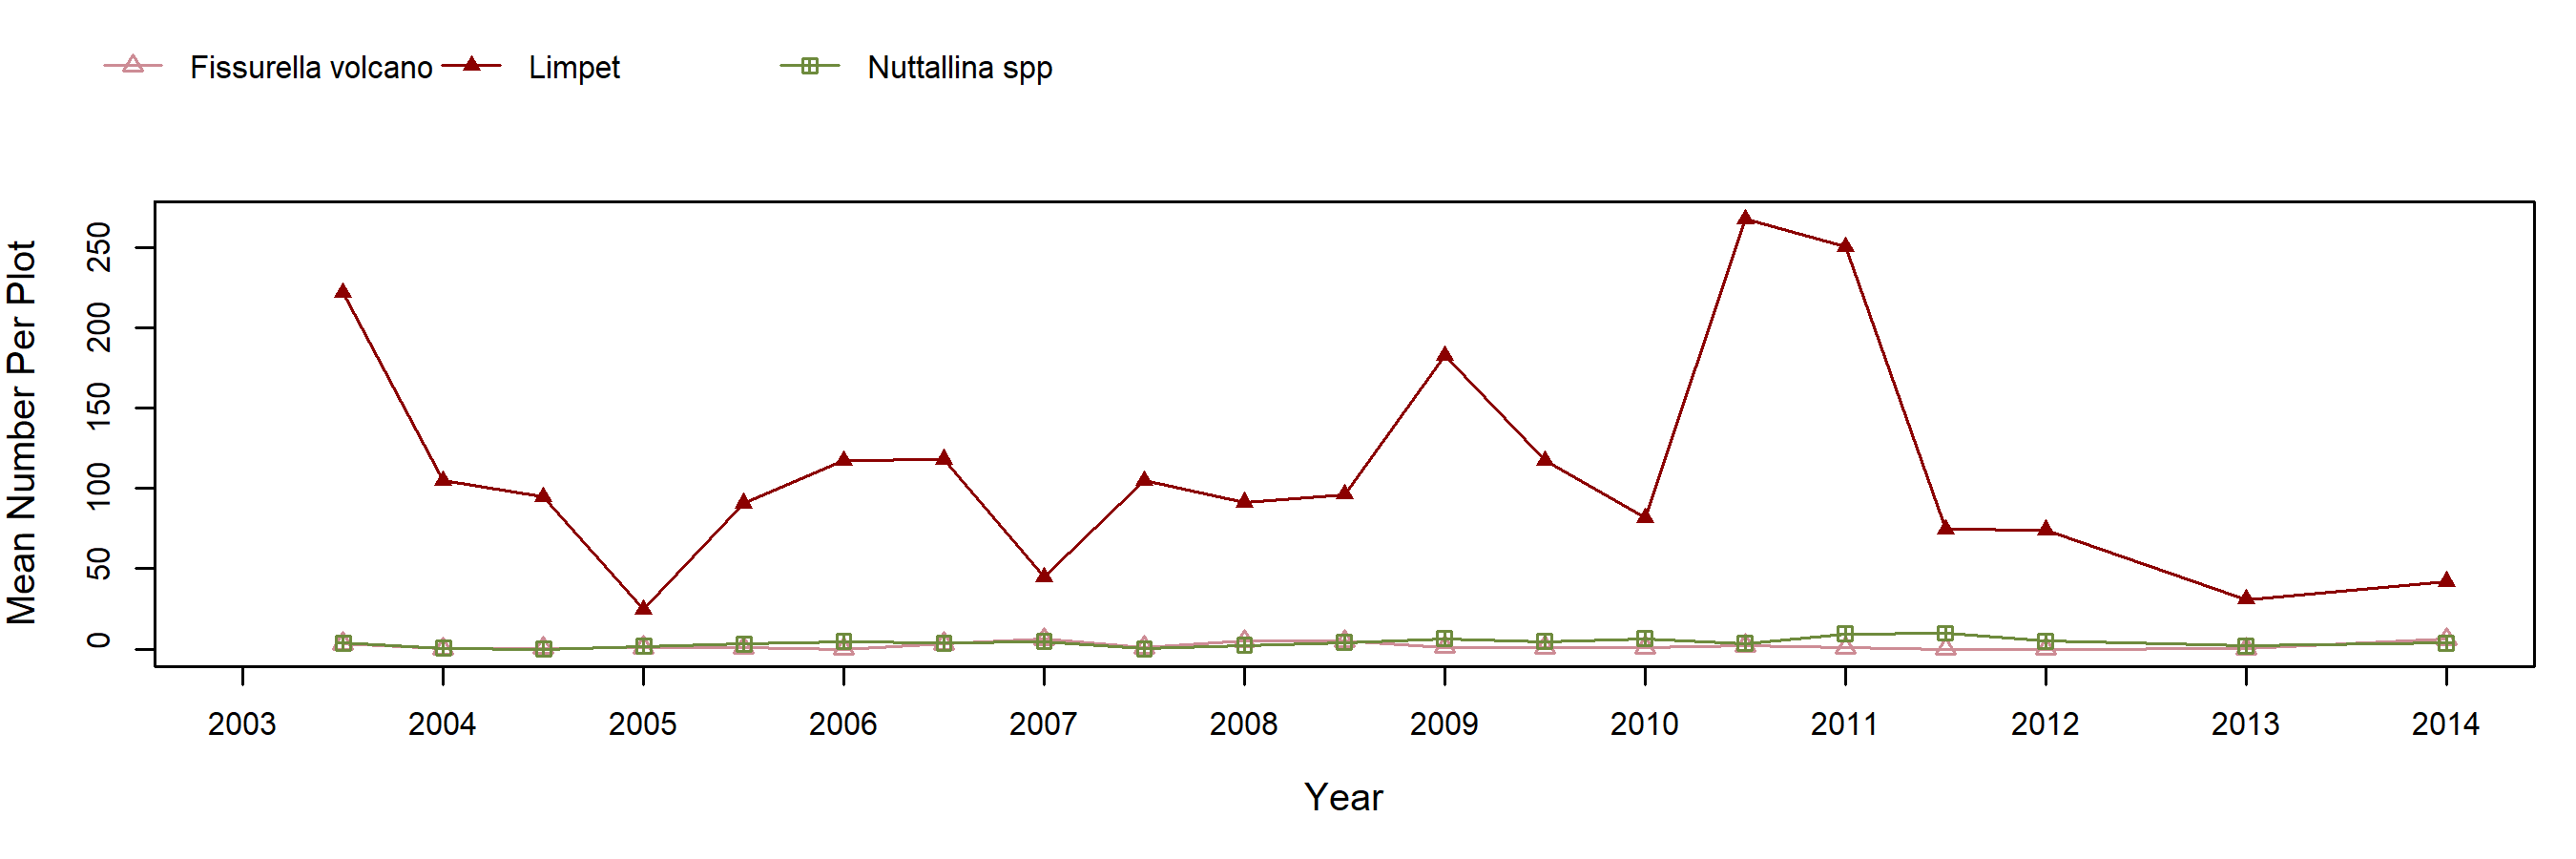
From 1996-2006, average barnacle cover at Crystal Cove was generally high (50 to 80% cover) although there was fluctuation among sampling periods. Except for the occasional and short-term appearance of small patches of algae such as the red turf Caulacanthus and the ephemeral sea lettuce Ulva, the majority of the area not covered by barnacles was recorded as bare rock. Mussels (Mytilus spp.) occasionally recruited into barnacle plots, but they did not achieve high cover (less than 20% cover on average) and were generally restricted to a single plot. In 2006, barnacle cover dropped sharply across all plots, resulting in an increase in recorded cover of bare rock. Since 2006 barnacle cover has rebounded slightly (on average 50% - 60% cover) but has generally remained below the values recorded in the early 2000s. Barnacle plots have consistently contained extremely high numbers of limpets and periwinkles (Littorina spp.), while the abundance of chitons (Nuttallina spp.) and hermit crabs (Pagarus spp.) have fluctuated over short (seasonal) and long (annual) timescales.
From 1996 to 2006, mussel cover in Crystal Cove mussel plots was consistently high (mean cover above 60%) with the notable exception of a large drop associated with the 1997-1998 El Niño. This El Niño-associated decline in mussel cover opened space that was filled for a short time by a number of sessile species including the annelid Phragmatopoma, the ephemeral alga Ulva, and articulated coralline algae. However, as mussel cover increased from 1998 – 2000, cover of these other sessile species declined. Cover of Mytilus in mussel plots remained high in the early 2000s, until a storm event with extraordinarily large waves in 2007 was associated with substantial but patchy loss of mussels (some plots lost only a small amount of cover but one plot was completely denuded of mussels: overall mean cover across the five plots dropped sharply). This patchy distribution has persisted over time: in the plot most heavily affected by the 2007 storm, mussel cover has remained low in subsequent years of monitoring. Cover in other plots, and thus the overall mean mussel cover, fluctuated from 2007 – 2010 and began to increase in late 2011, reaching an average of ~80% cover in 2012. However, stormy weather in Spring 2013 was associated with substantial loss of mussel cover in two plots, and the overall mean cover dropped below 50%. Dramatic increases in the cover of upright red algae, including coralline and non-coralline species (e.g. Laurencia pacifica) - which can obscure mussel recruits during sampling - have been associated with consistently low levels of visible mussel cover since Fall 2013. Mussels do occur in low abundances elsewhere at the site. Limpets are regularly found in mussel plots although their abundance is historically variable.
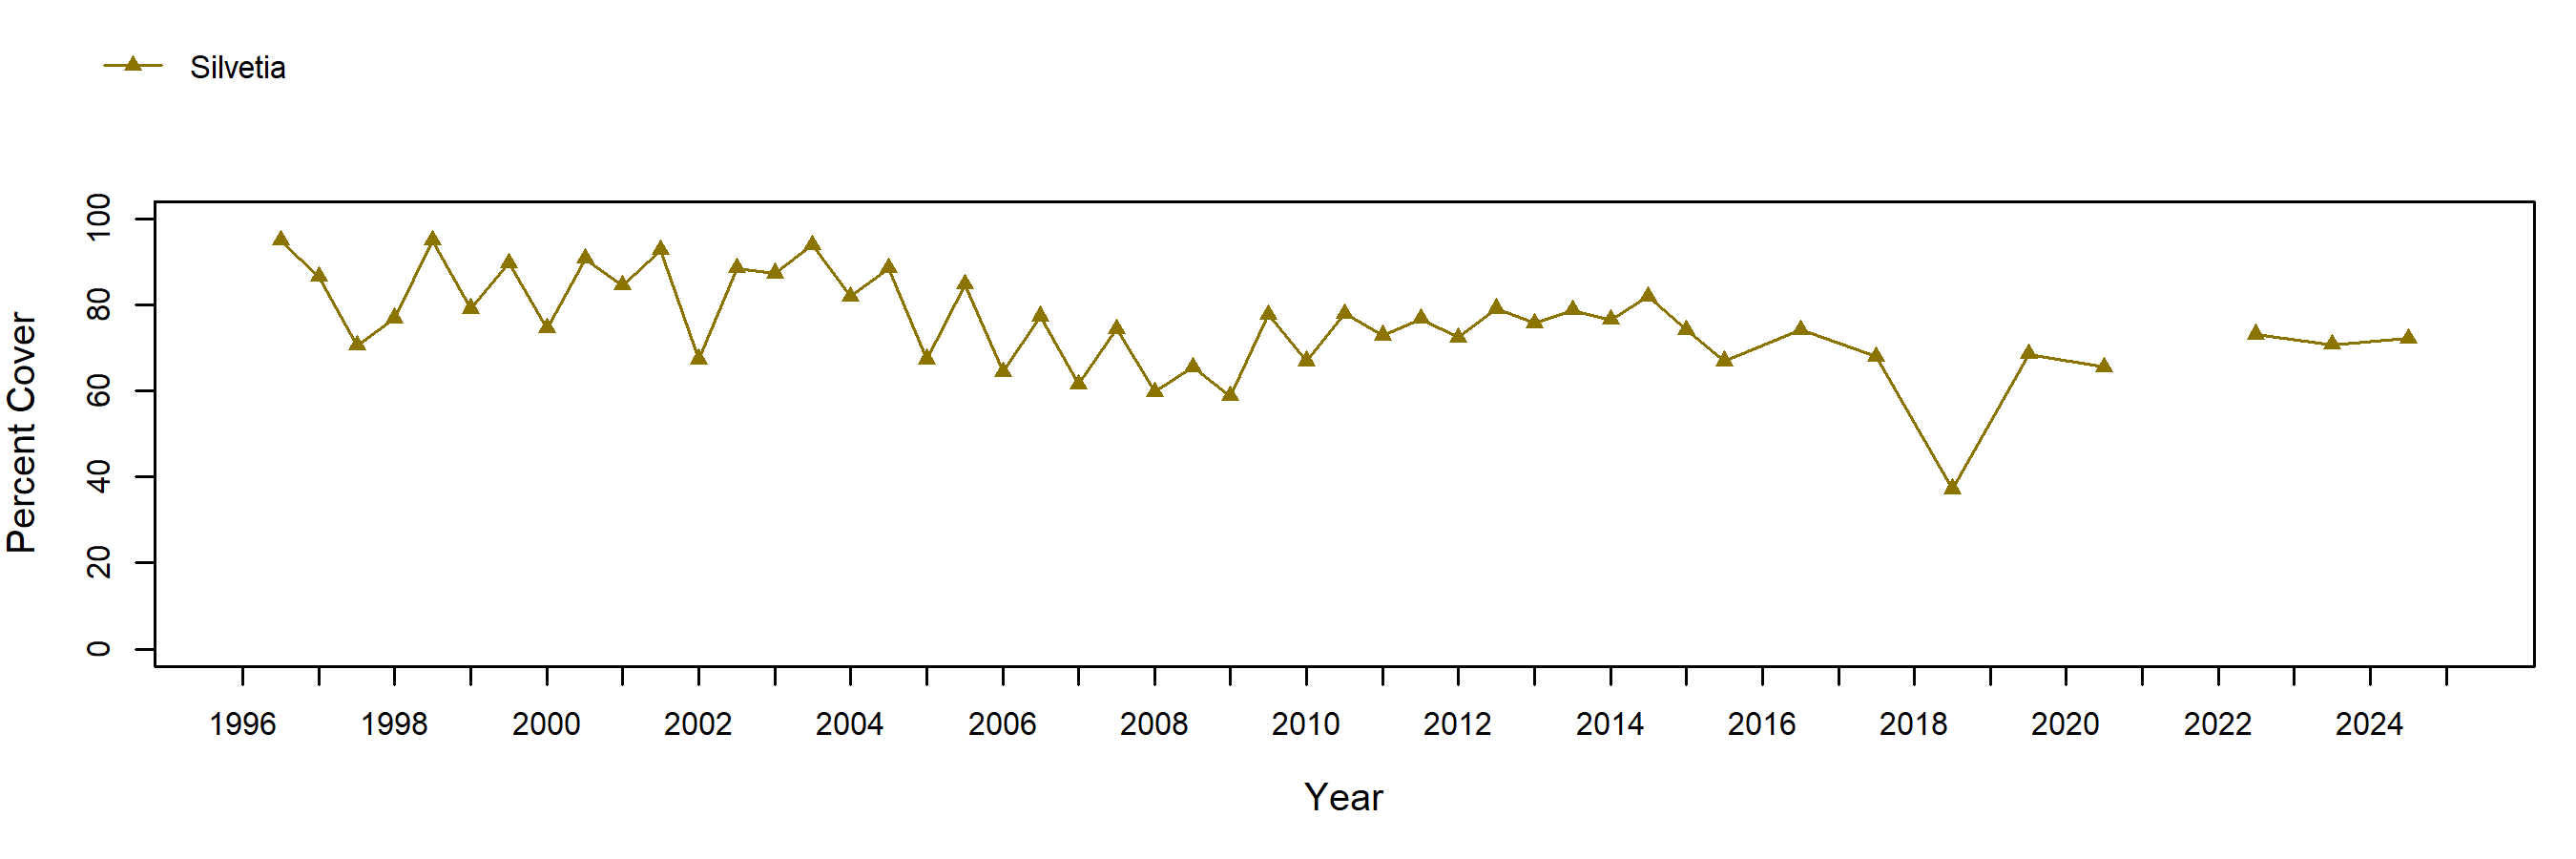
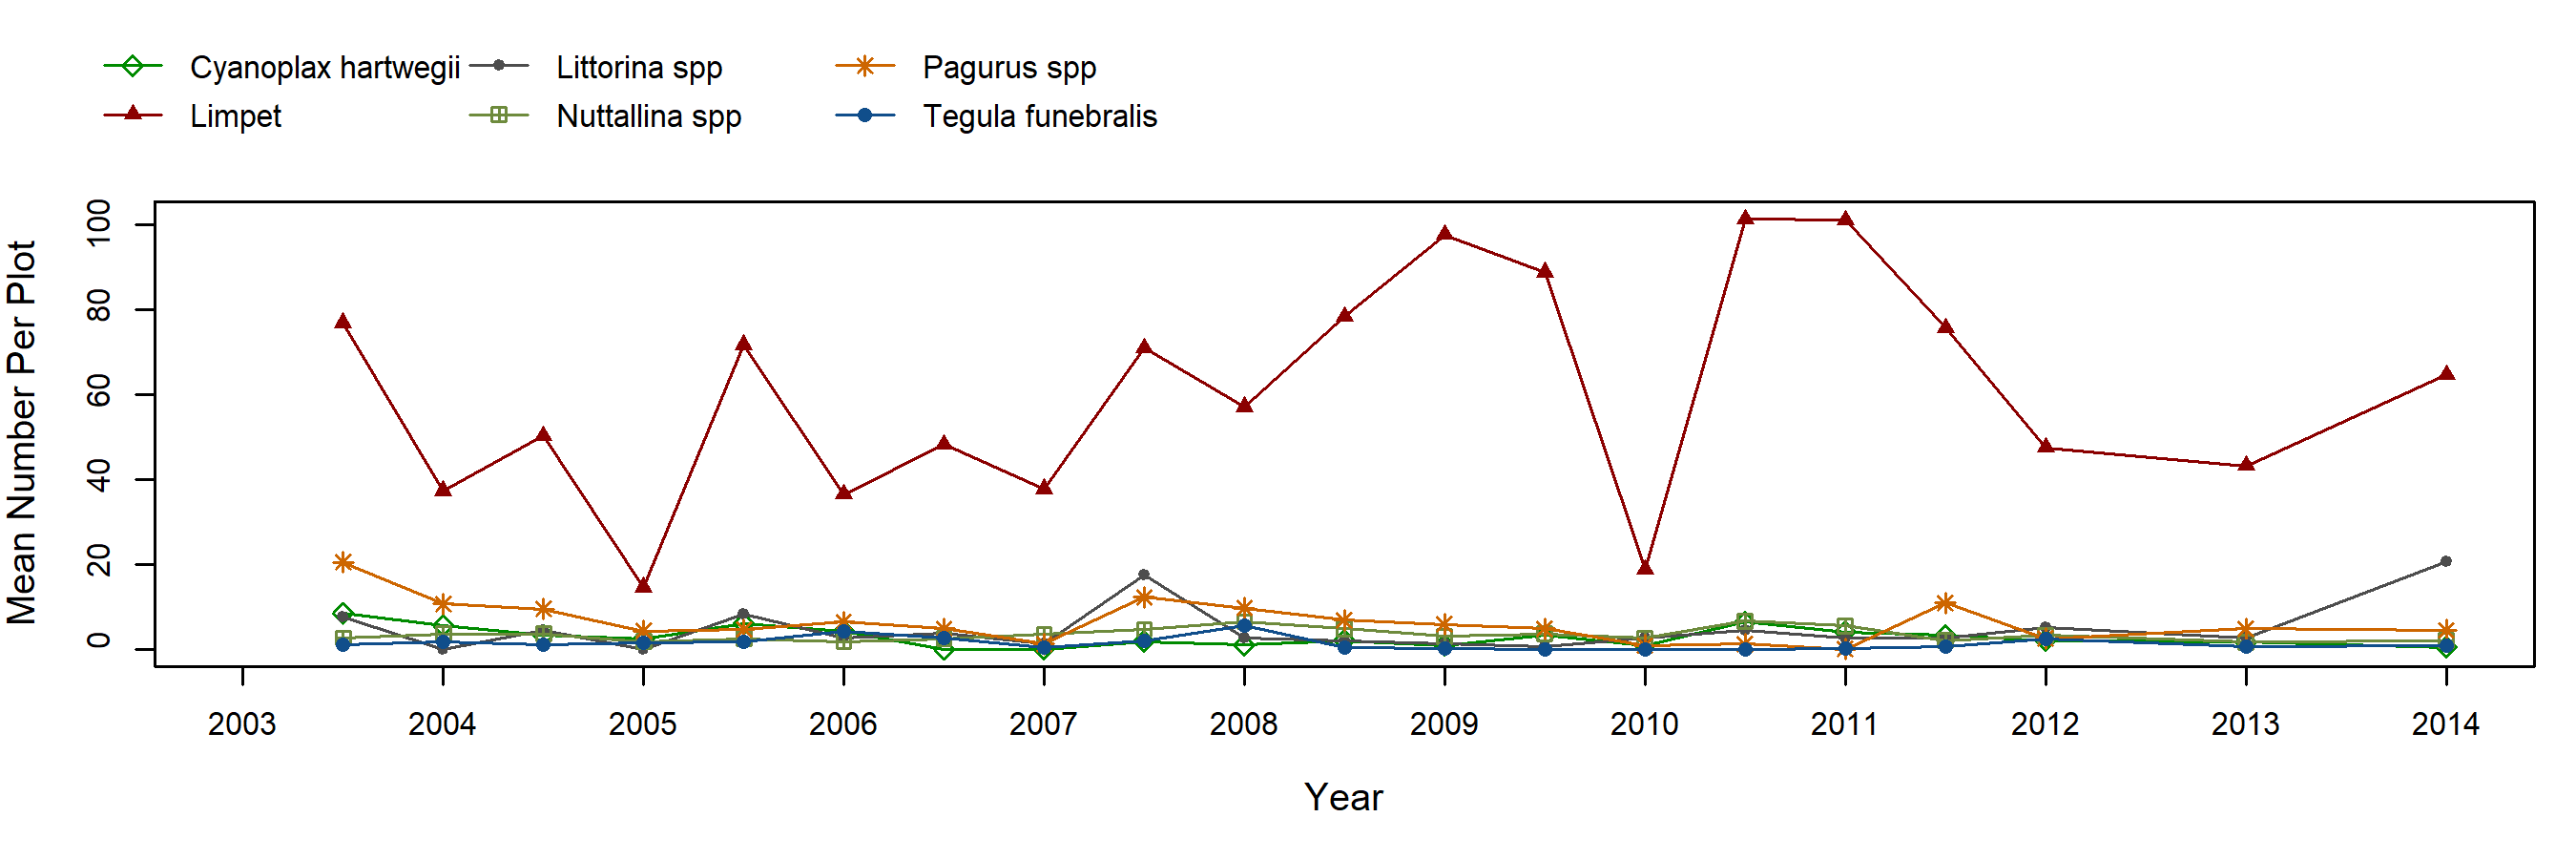
The abundance of Silvetia compressa (golden rockweed) has historically been high in permanent plots at this site, covering on average at least 60% of plot area from 1997 – 2017. Although clear seasonal fluctuations were evident before 2010 (higher cover in Fall than in Spring), this seasonal pattern was dampened between 2010 and 2017, when average cover remained relatively stable and above 70%. When Silvetia cover dipped to a low of 40% (averaged across plots) in 2018, we recorded higher than typical cover of upright red algae (coralline and non-coralline species): but Silvetia cover in the rockweed plots rebounded to ~60 % in 2019. Hermit crabs, chitons, and turban snails have been regularly found in low abundance in rockweed plots, while counts of limpets (Lottia spp) were typically at least five times higher than counts of any other taxon.
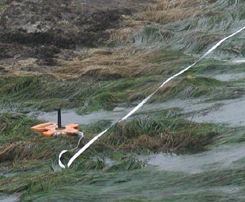
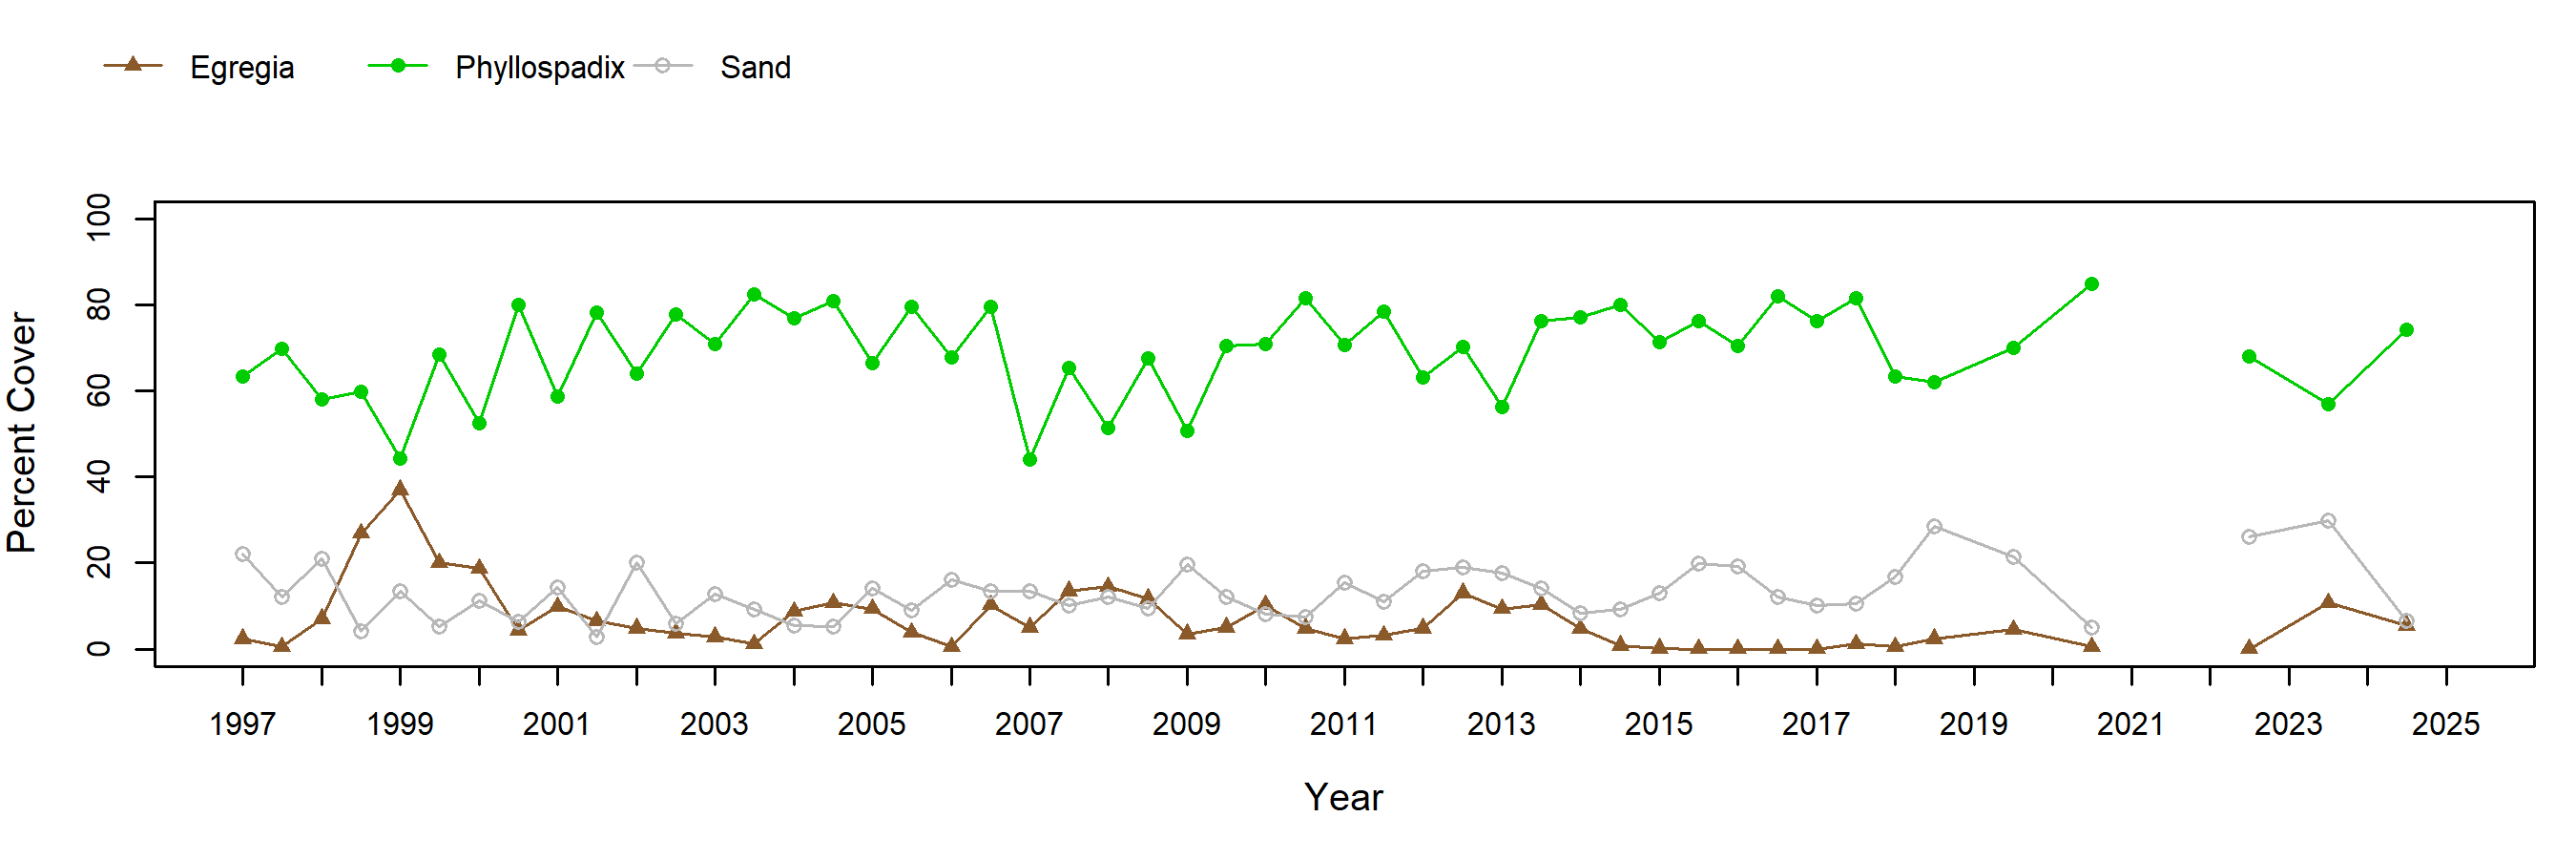
Surfgrass (Phyllospadix) cover along permanent transects has historically varied over time, both within years (with generally higher cover in fall than in spring) and among years. Despite seasonal fluctuations, surfgrass cover has generally remained high over the long term (typically above 50% cover). After a period of particularly high and stable cover (above 70%) from Fall 2013 - Fall 2017, cover dipped slightly to an average of just above 60% in 2018 but this dip was followed by increases over subsequent sampling periods. Surfgrass co-occurs with the feather boa kelp Egregia menziesii and several species of upright red algae (e.g. Pterocladiella and Laurencia) which have been consistently present in these transects in low abundance. The data show that habitat is influenced to some degree by the movement of sand, which typically covered between 3 and 28%, on average, of the area of the transect.
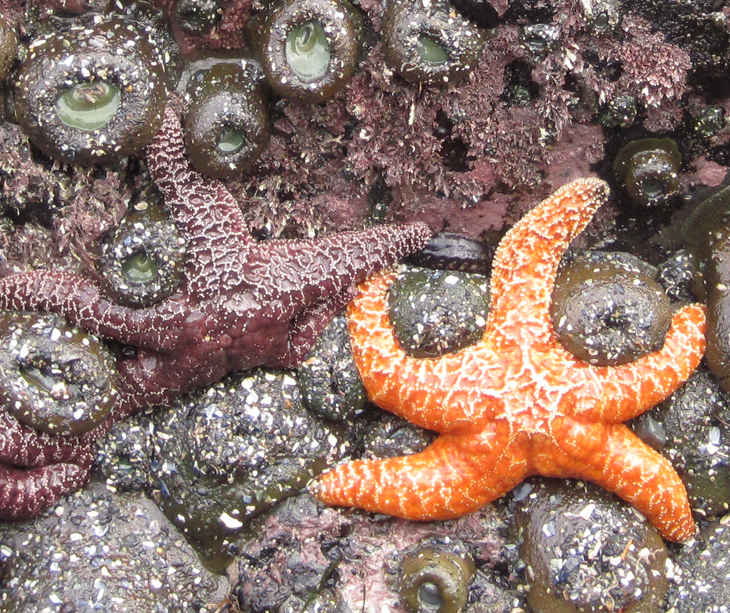
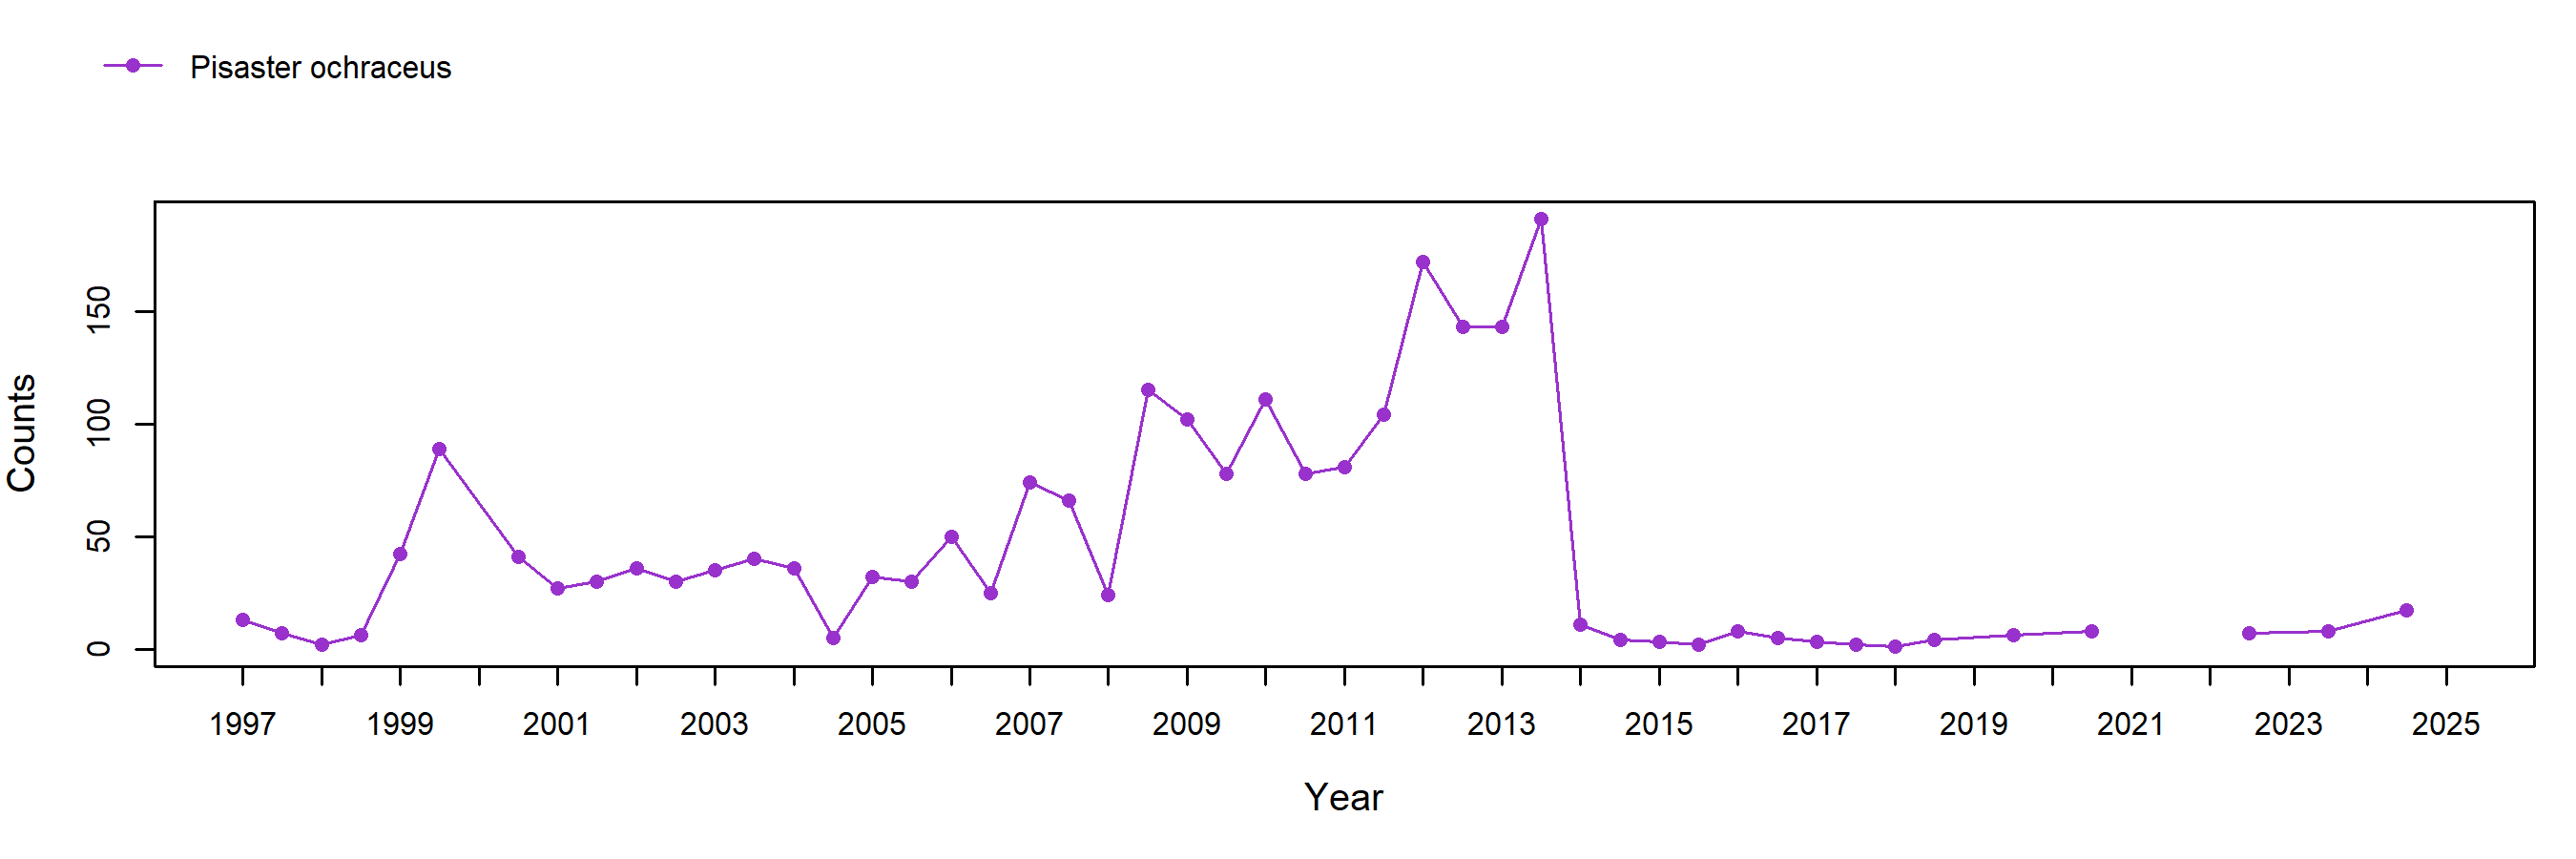
Abundance of the mobile sea star Pisaster has been extremely variable at this site over the years. From 1997 to 2008, site-wide counts were generally low (fewer than 50 individuals) with occasional ‘peaks’ (though always fewer than 100 individuals per survey). Pisaster abundance was higher from 2008 to 2012 than in the previous decade: during this period we consistently encountered at least 75 individuals per survey, and the population included individuals from many size classes (from < 50 to > 150 mm). Extremely high numbers of Pisaster, including individuals from all size classes, were observed in 2013, with site-wide counts exceeding 175 individuals in Fall of that year, before plummeting to a total of 11 observed individuals in Spring 2014. Sea Star Wasting Syndrome, which was first observed at this site on November 4, 2013 (after the Fall 2013 survey), is a likely contributor to the sharp decline. Since 2014, Pisaster have rarely been encountered at this site and abundance has remained extremely low. In 2016 and 2017, the majority of encountered individuals were small (less than 100mm), although larger individuals (up to 150 mm) were encountered in surveys in 2018 and 2019.
Photo Plots
Below are the trends observed for each Photo Plot target species at this site. Long-Term percent cover trend graphs also include any species that reached a minimum of 25% cover during any single point in time within a given target species assemblage. Breaks in trend lines represent missed sampling events. For additional species observed that did not meet this 25% threshold, please use the Interactive Map.
For motile invertebrate Species Counts, a mean across all plots was calculated, and only those species with a value of at least 5 individuals for at least one sample are shown. Due to time constraints, motile invertebrate counts have not been done at most sites since 2012. For motile invertebrate size trend graphs by site, please use the Interactive Map.
Chthamalus/Balanus (Acorn Barnacles) - percent cover
Chthamalus/Balanus (Acorn Barnacles) - motile invertebrate counts
Mytilus (California Mussel) - percent cover
Mytilus (California Mussel) - motile invertebrate counts
Silvetia (Golden Rockweed) - percent cover
Silvetia (Golden Rockweed) - motile invertebrate counts
Transects
Below are the trends observed for each Transect target species at this site. Long-Term trend graphs also include any species that reached a minimum of 25% cover during any single point in time within a given target species assemblage. Breaks in trend lines represent missed sampling events.
Phyllospadix (Surfgrass)
Species Counts and Sizes
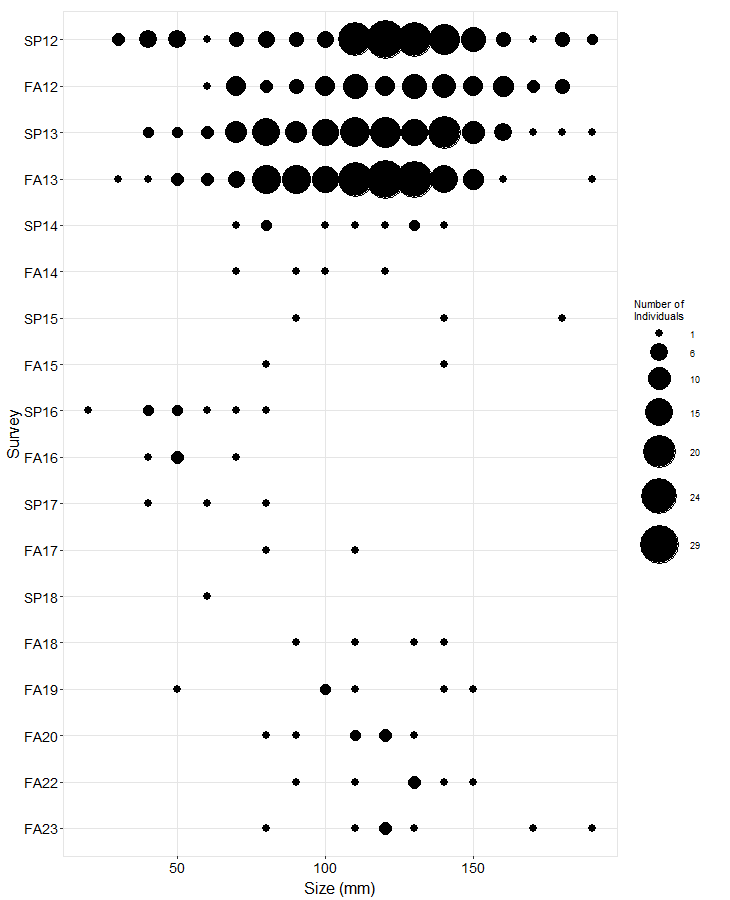
Species Counts and Sizes (where recorded) for Pisaster are shown below for this site. At some sites, other sea star species and Katharina are counted in addition to Pisaster. The sum of all individuals across all plots is displayed. Note that data gaps are represented by breaks in long-term count trend lines, but are not shown in size plots.
Pisaster ochraceus (Ochre Star)
Pisaster ochraceus (Ochre Star) - sizes
See Also
