Long-Term Monitoring Trend Graphs
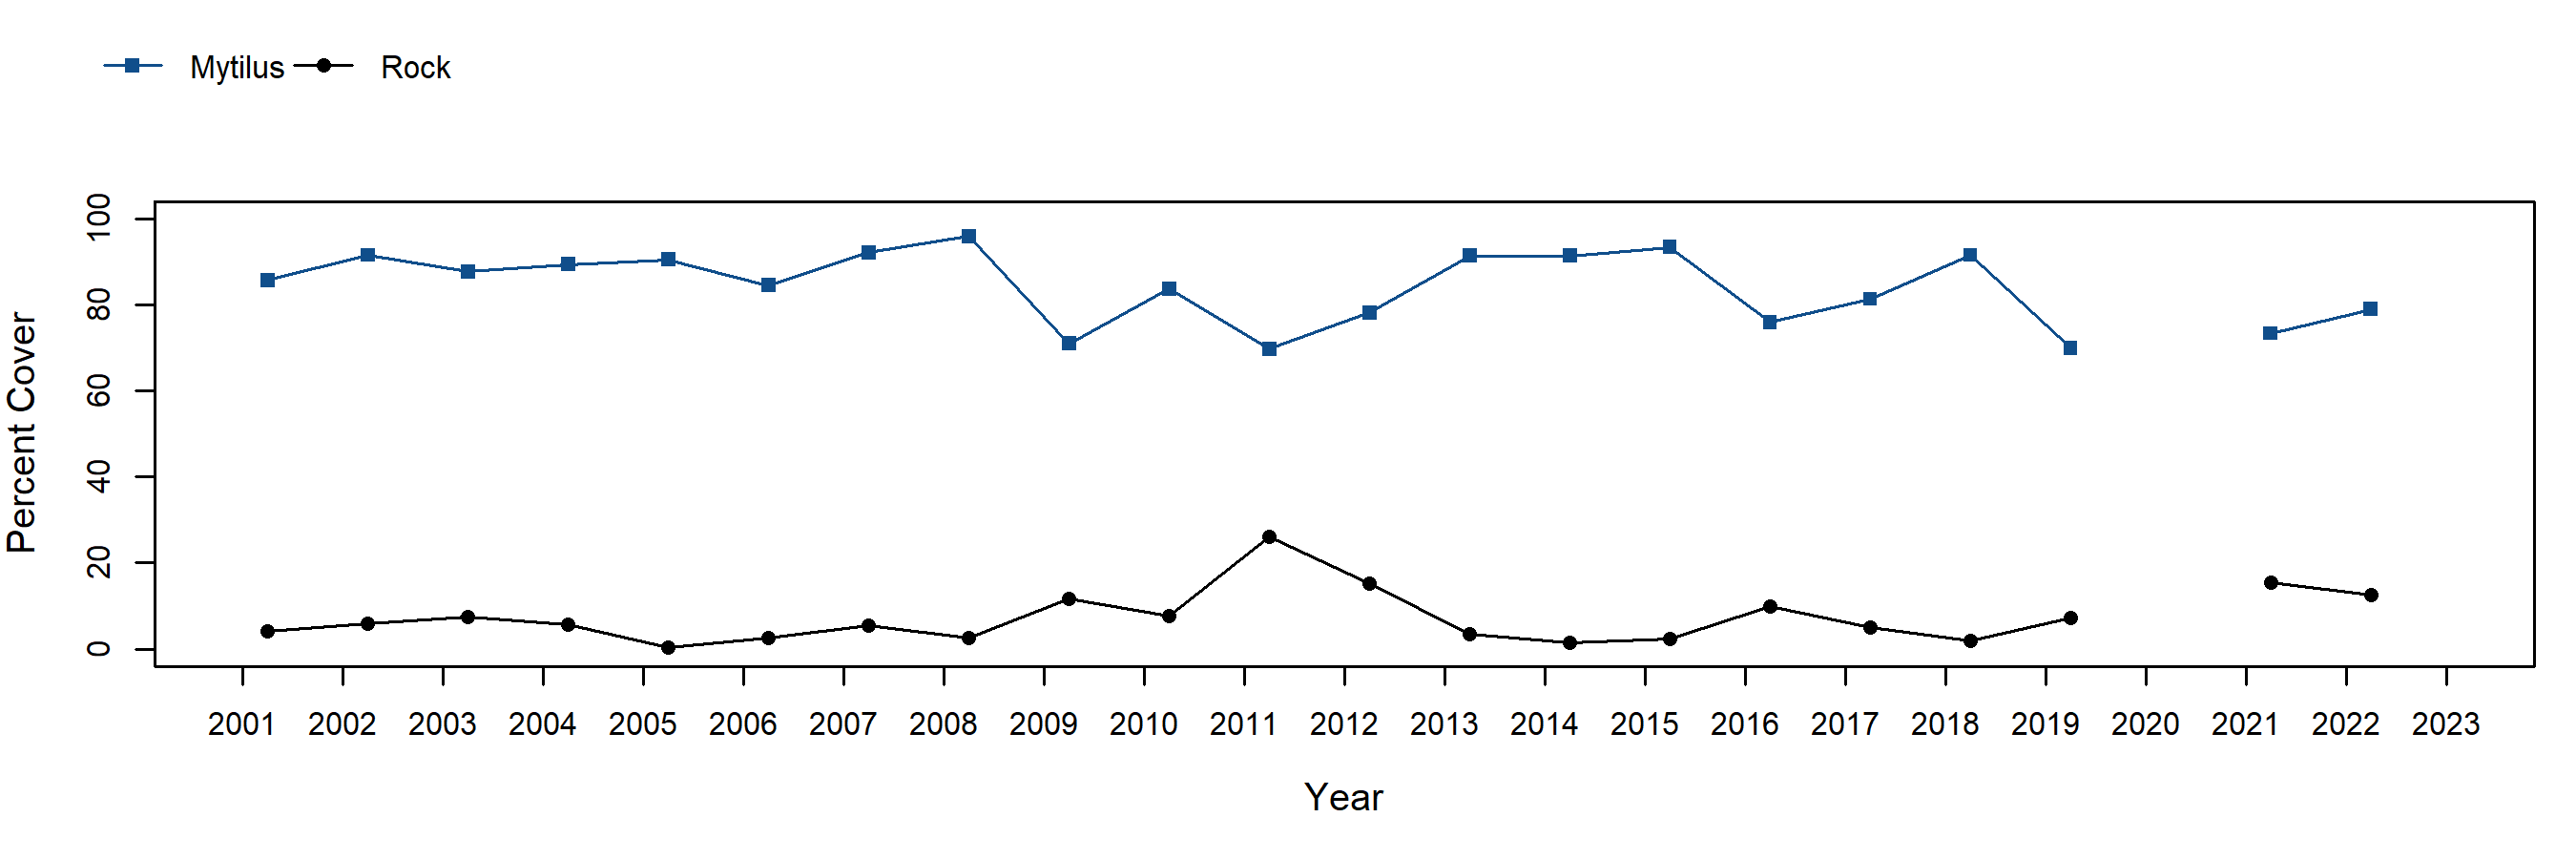
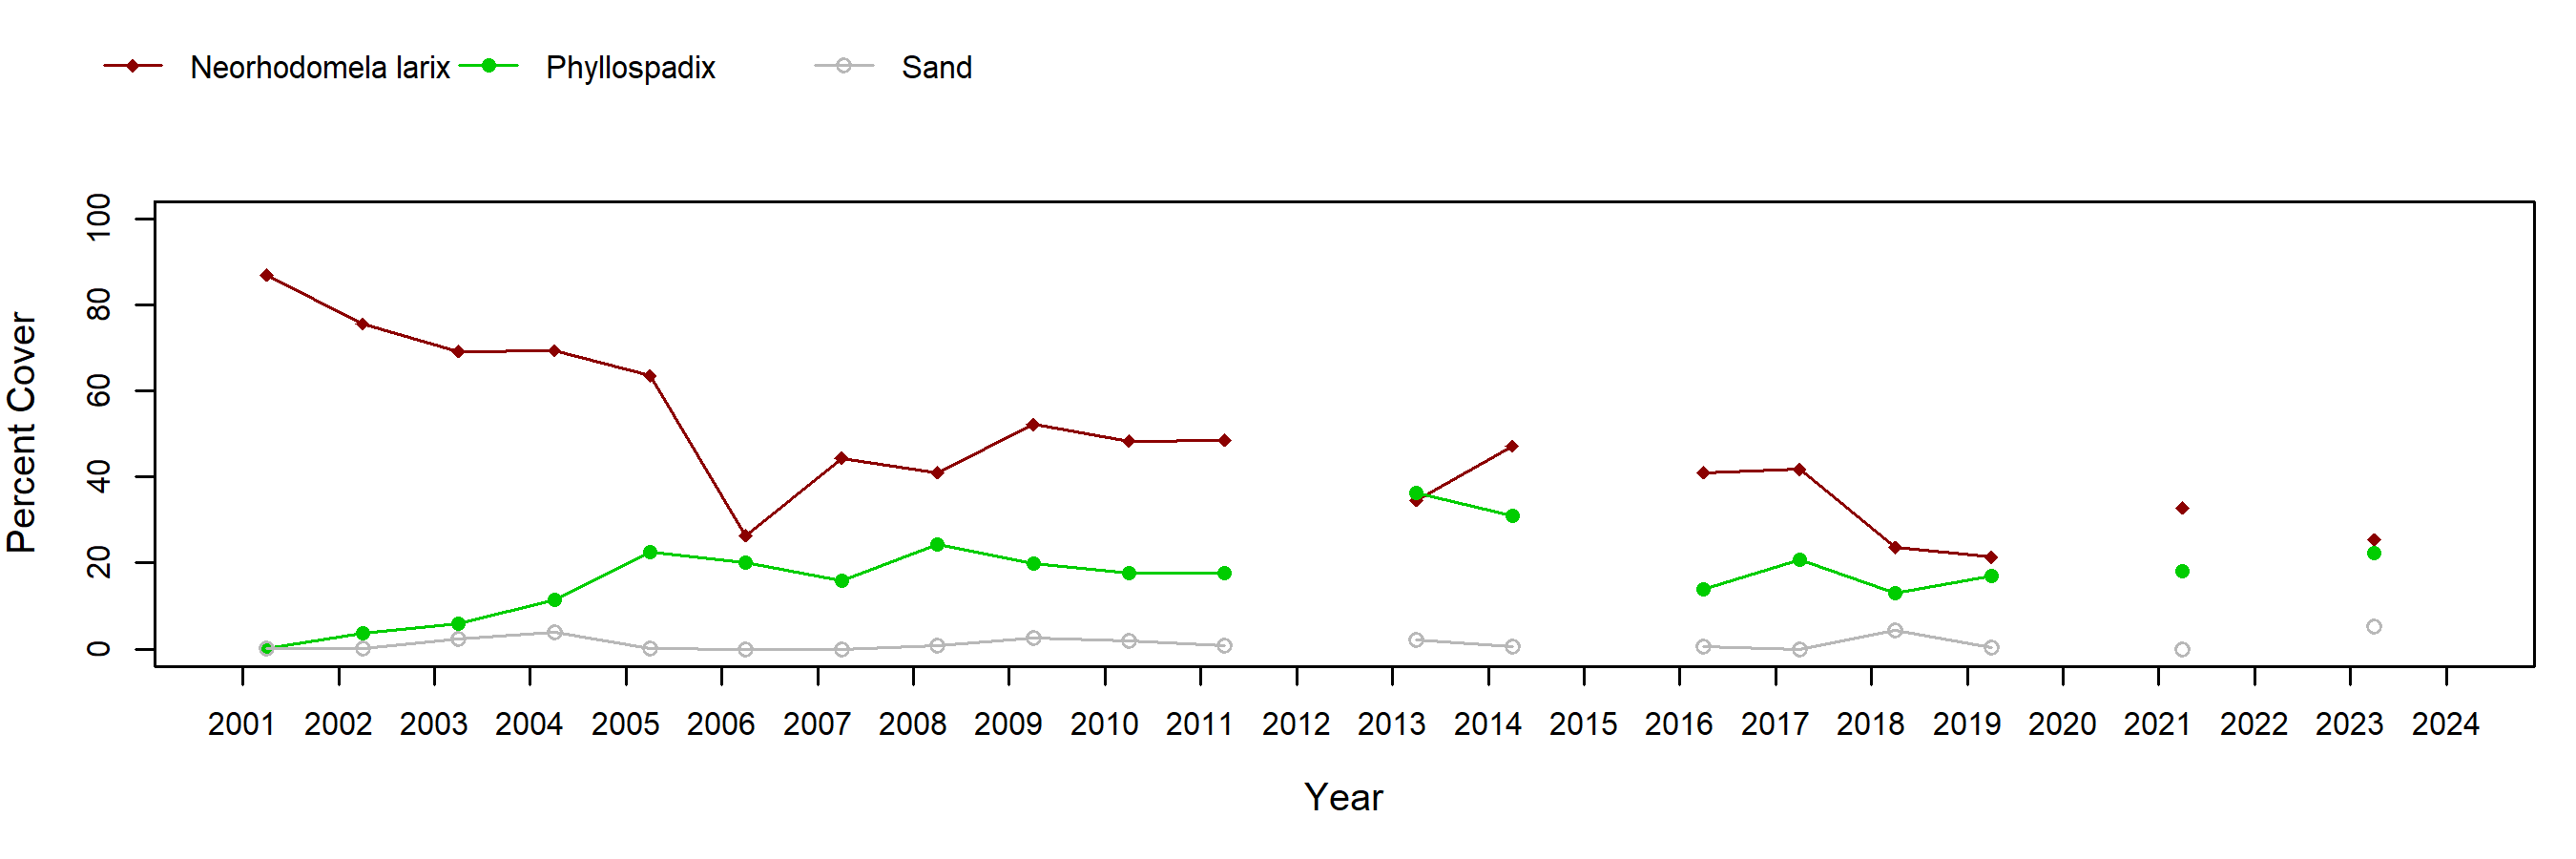
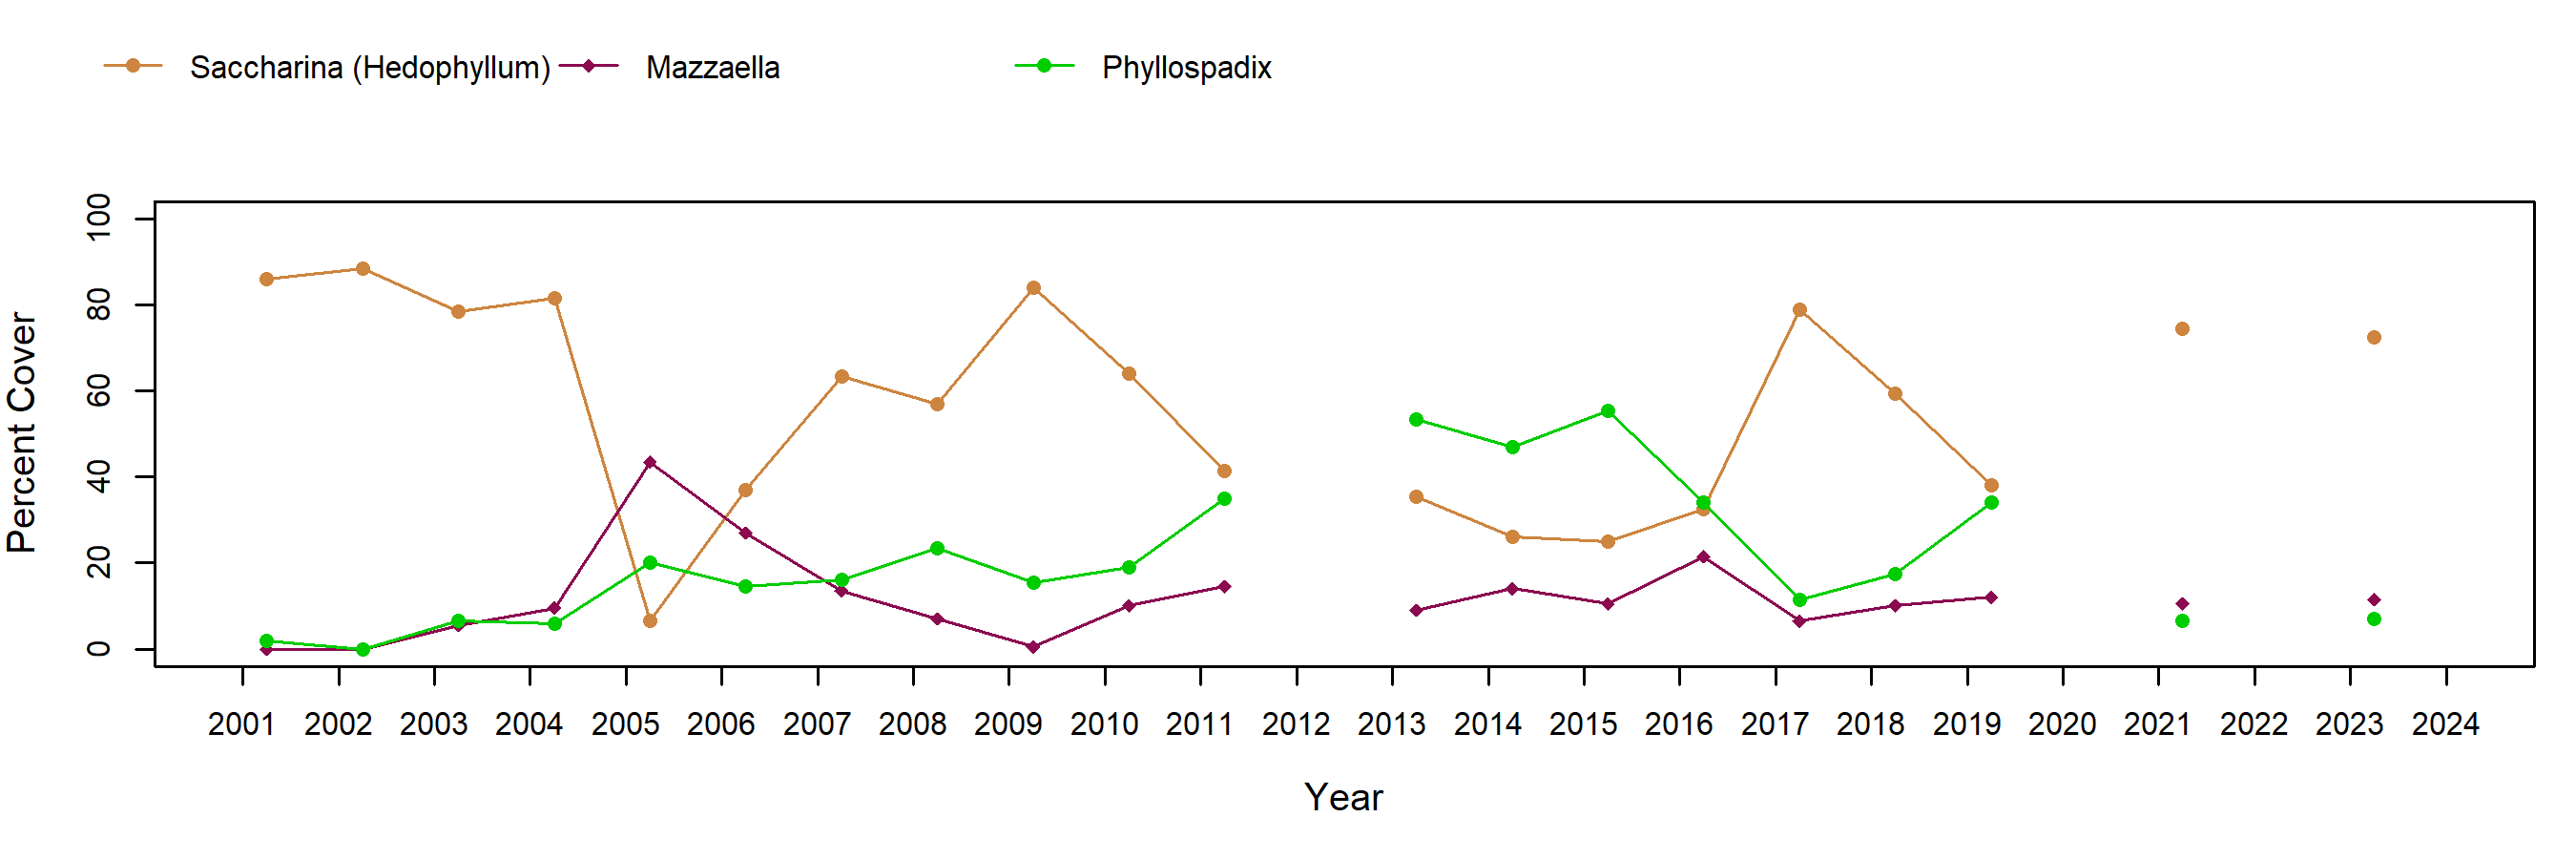
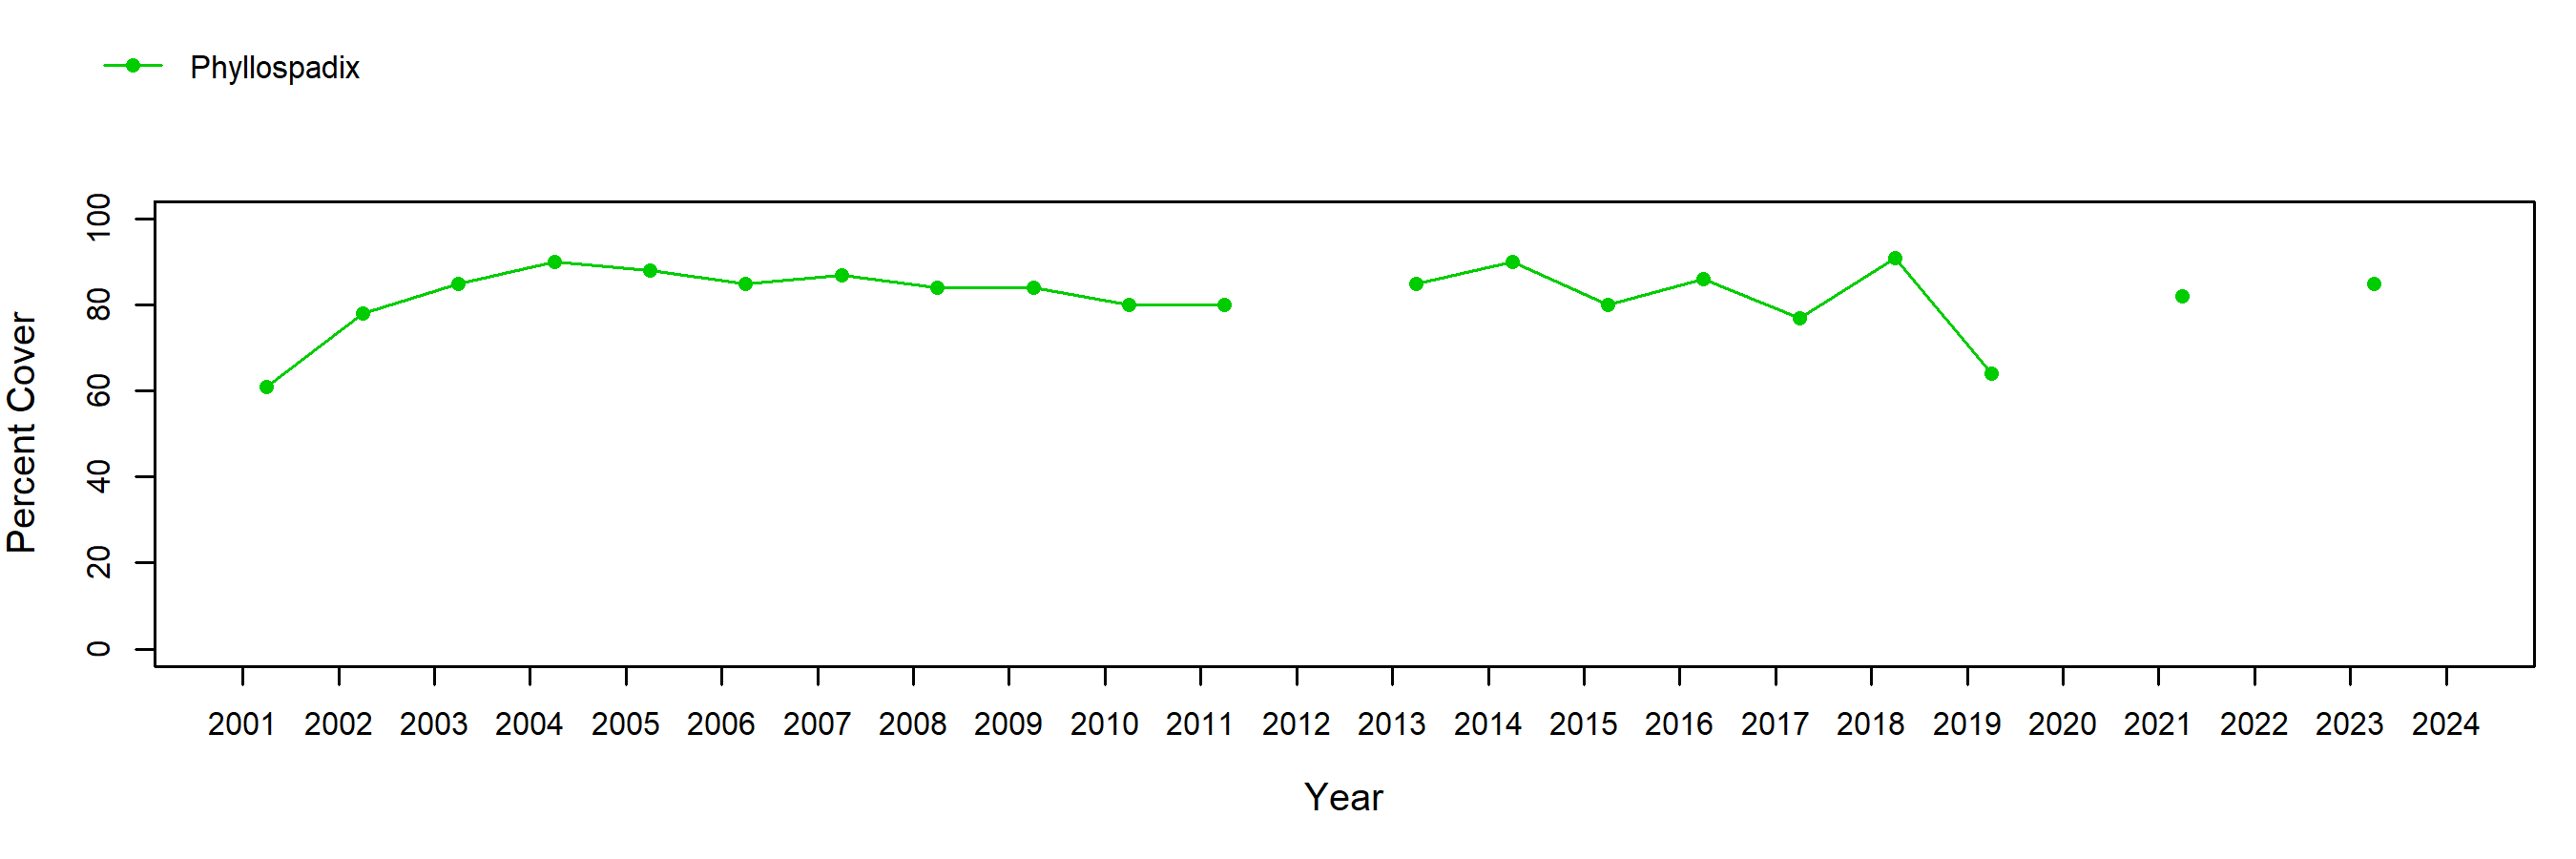
Barnacle plots at Ecola primarily contained the acorn barnacle, Balanus glandula, which exhibited fairly stable cover over time for a short-lived species. Mussel cover in Mytilus plots was generally quite high and occasional disturbance events, such as the substantial loss of mussels from two plots in 2009, were followed by rapid recovery. Pelvetiopsis cover in its target plots tended to vary inversely with cover of barnacles, which facilitate settlement and survival of the rockweed. Plots targeting Neorhodomela experienced a gradual decline in cover of the red alga over time as Phyllospadix abundance increased in these plots. In the two transect types at Ecola, cover of Saccharina (formerly Hedophyllum) was quite variable over time, whereas cover of Phyllospadix has been relatively stable.
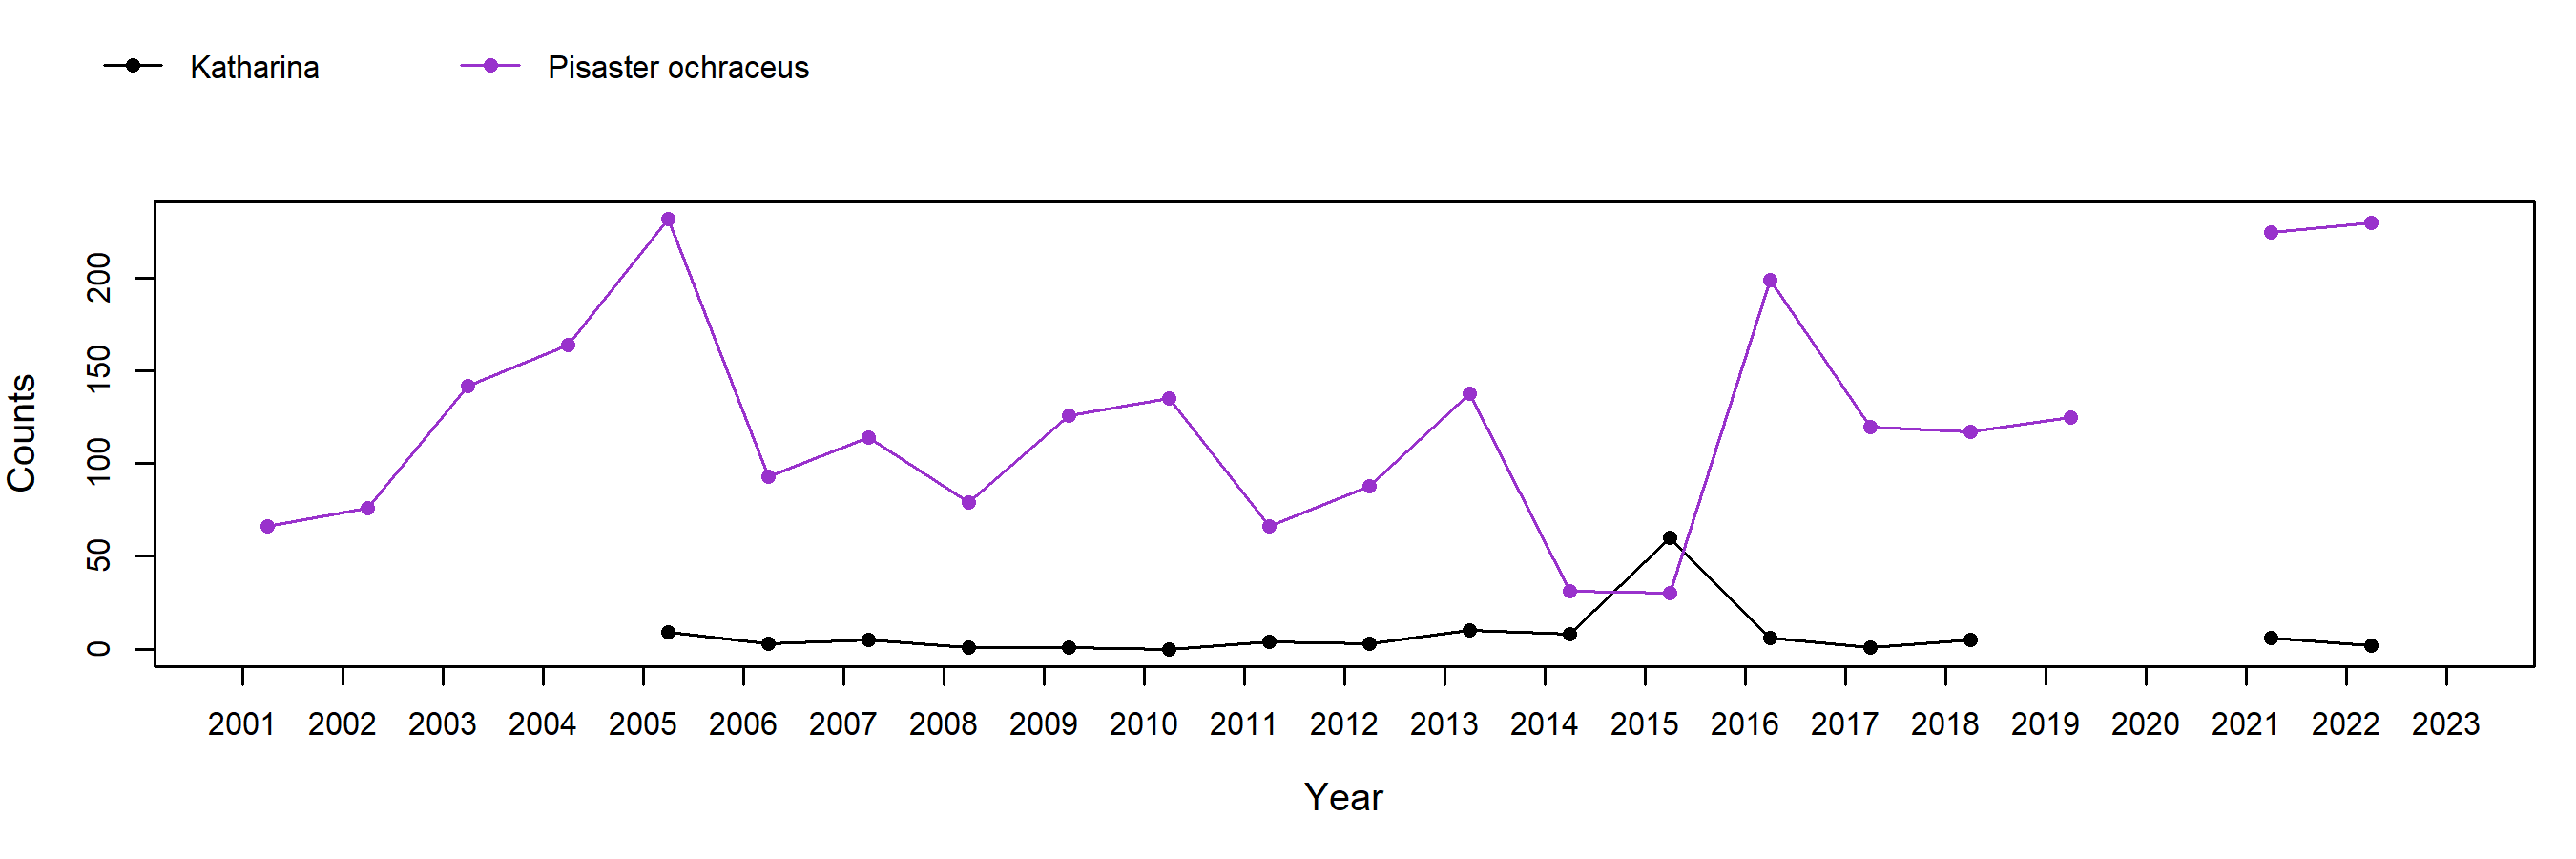
Ochre star counts fluctuated substantially over time, but as with several other Oregon sites, numbers were down in 2014 and 2015 due to Sea Star Wasting Disease (SSWD). Large numbers of juveniles (<50 mm radius) have been found in the plots since 2016, which has contributed to population recovery, but examination of size distribution data indicates that large ochre stars are still less common compared to pre-SSWD levels.
In order to standardize species resolution across all MARINe groups and over time, some species (typically rare) were lumped for graphical presentation of Long-Term monitoring data. See lumped categories for definitions (some variation occurs between methods and over time).
If you experience any barriers accessing the trend graphs below, please contact (pacificr@ucsc.edu) for help.
Photo Plots

Below are the trends observed for each Photo Plot target species at this site. Long-Term percent cover trend graphs also include any species that reached a minimum of 25% cover during any single point in time within a given target species assemblage. Breaks in trend lines represent missed sampling events. For additional species observed that did not meet this 25% threshold, please use the Graphing Tool.
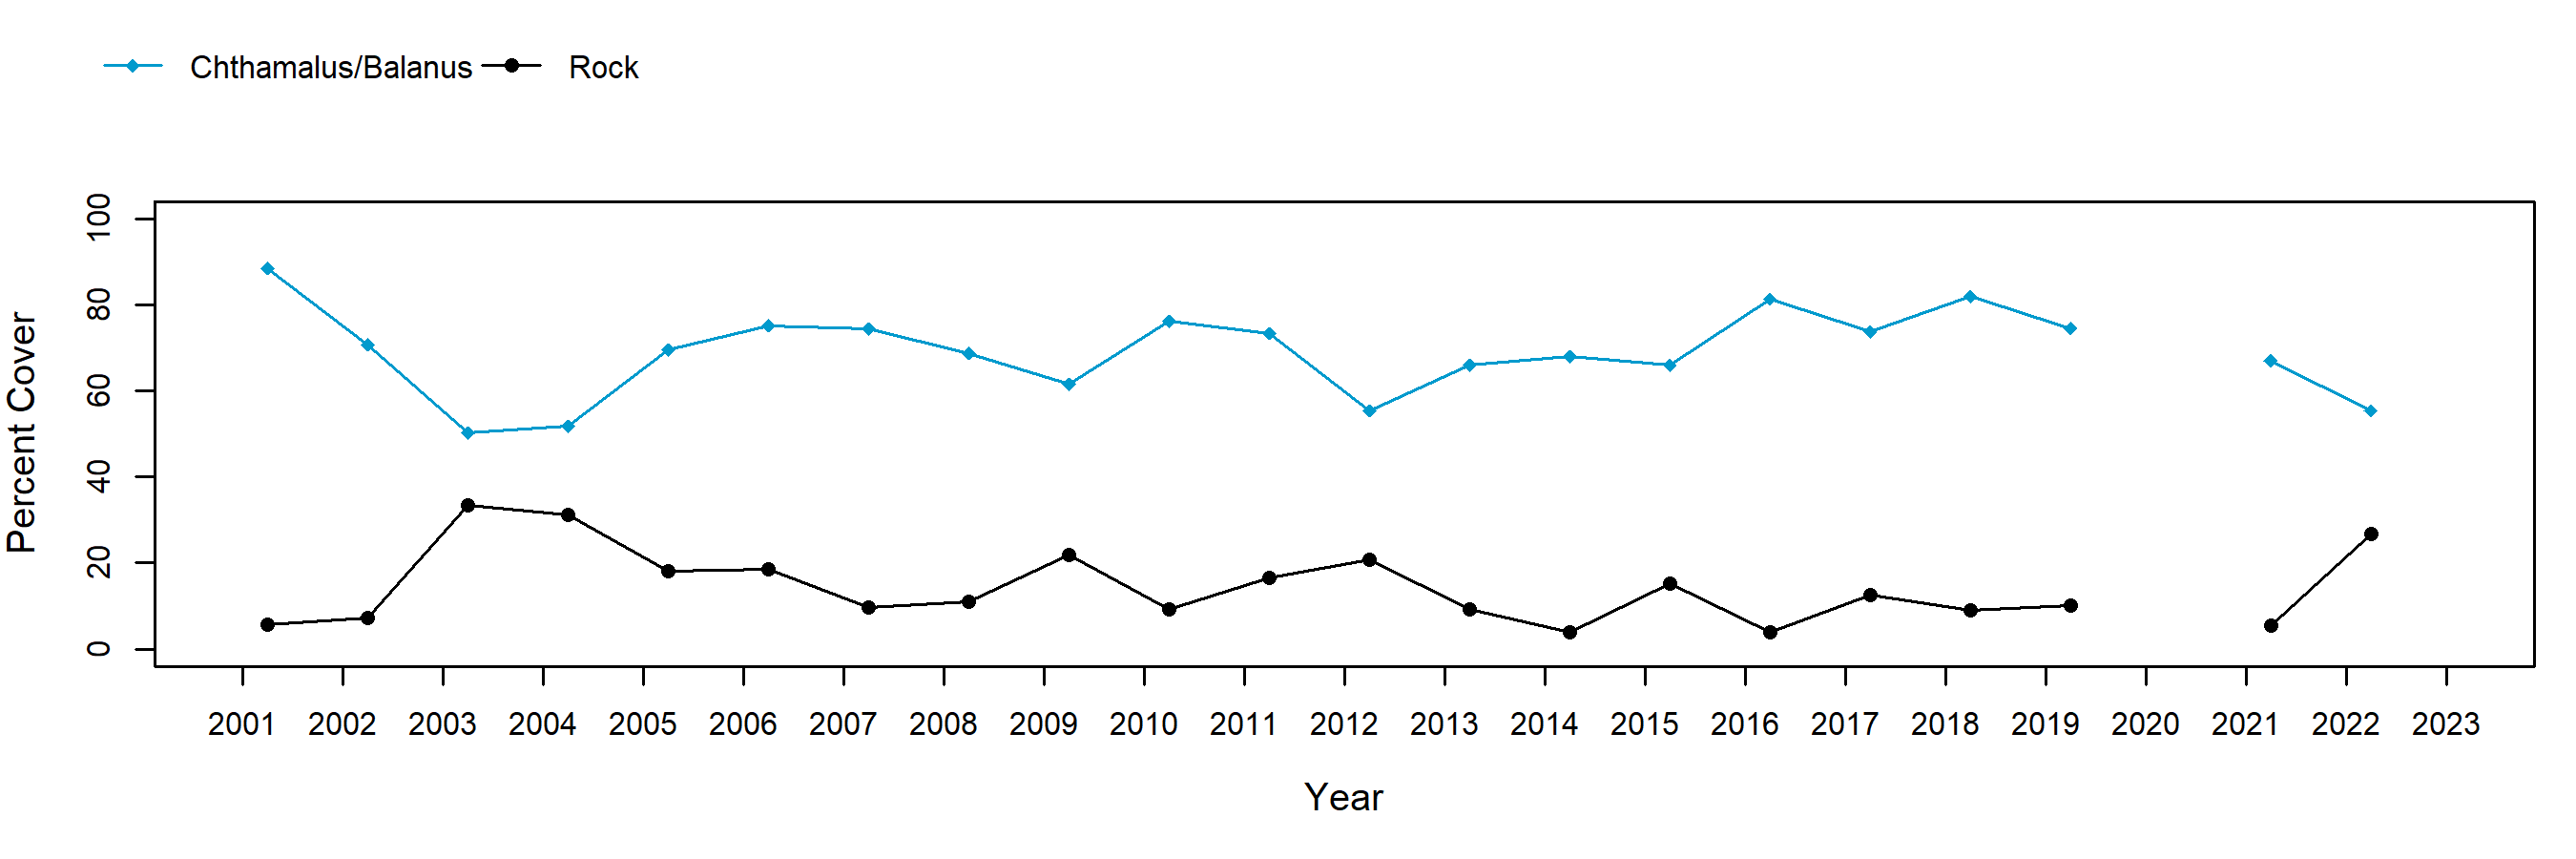
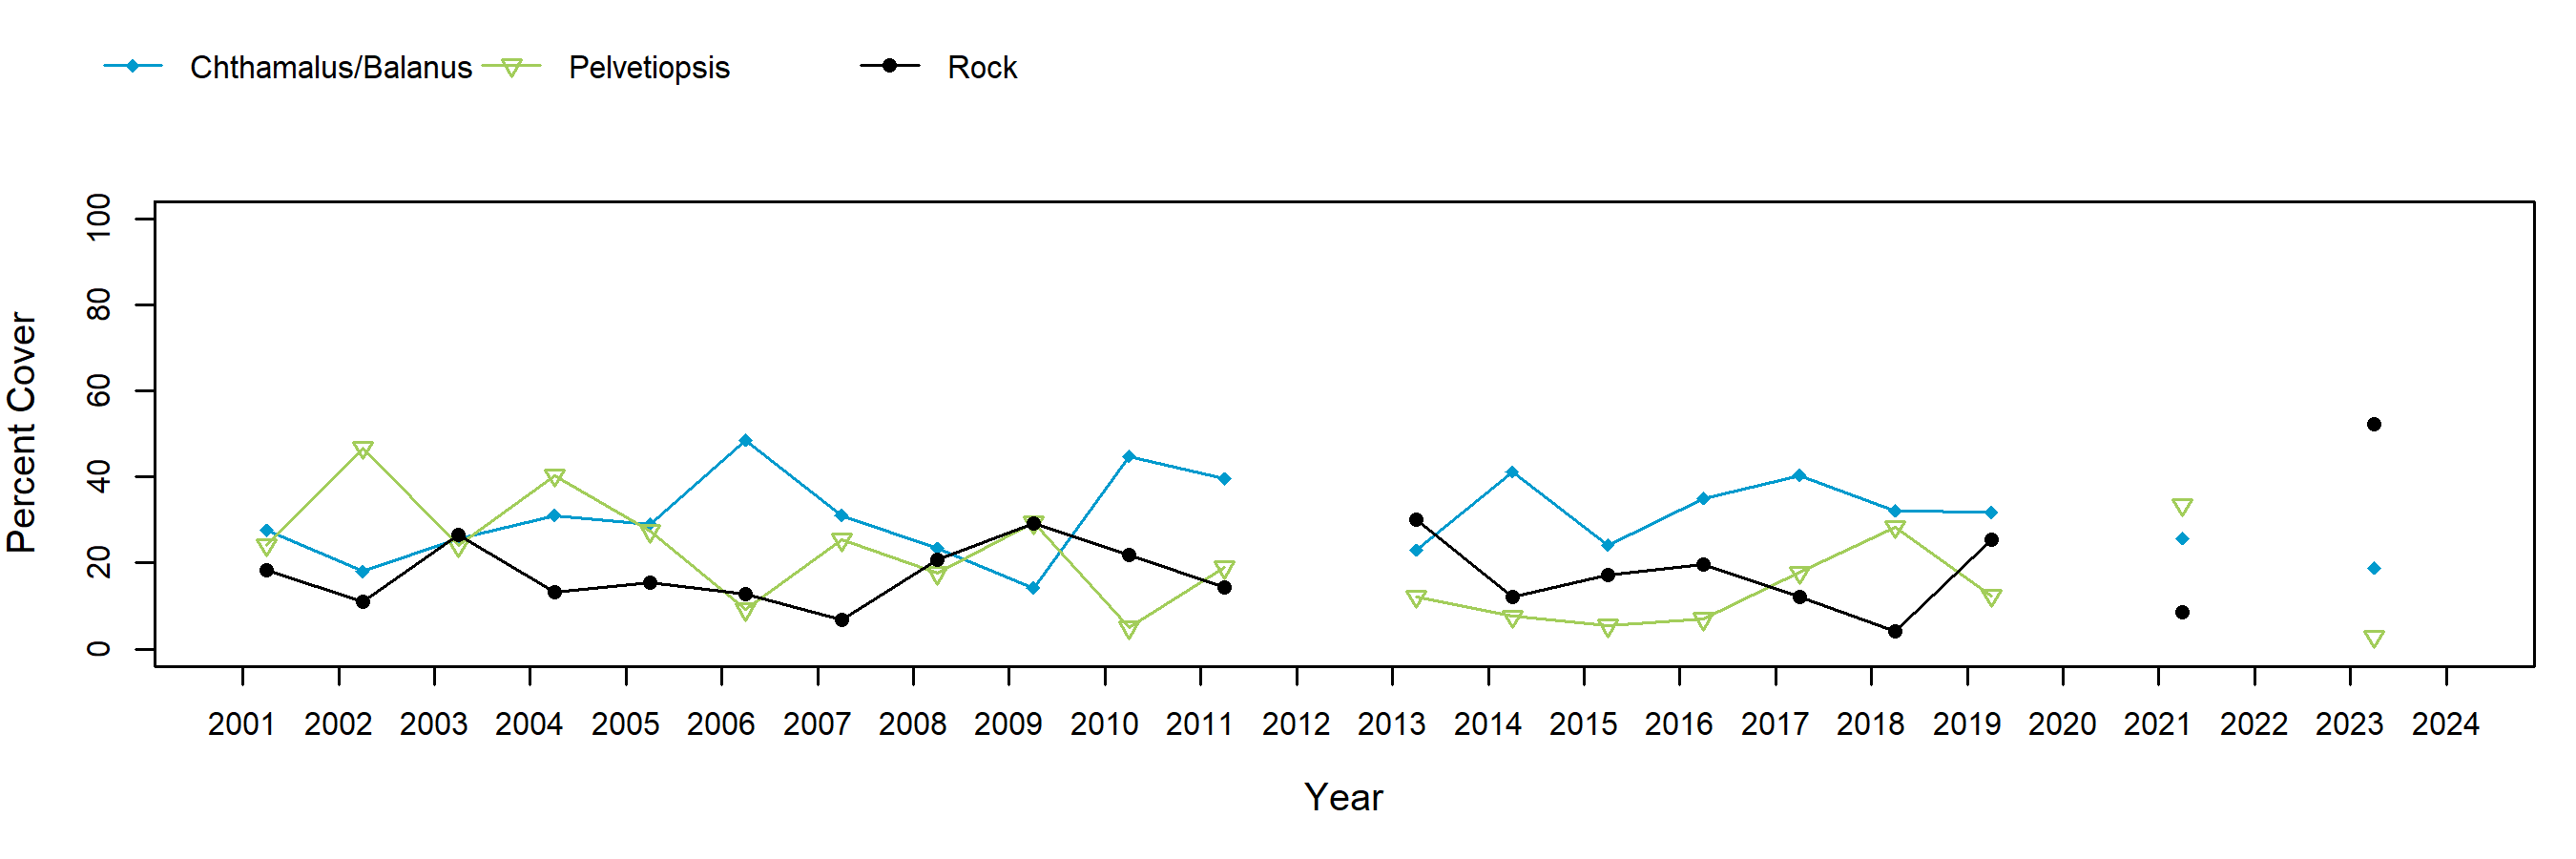
Chthamalus/Balanus (Acorn Barnacles) – percent cover
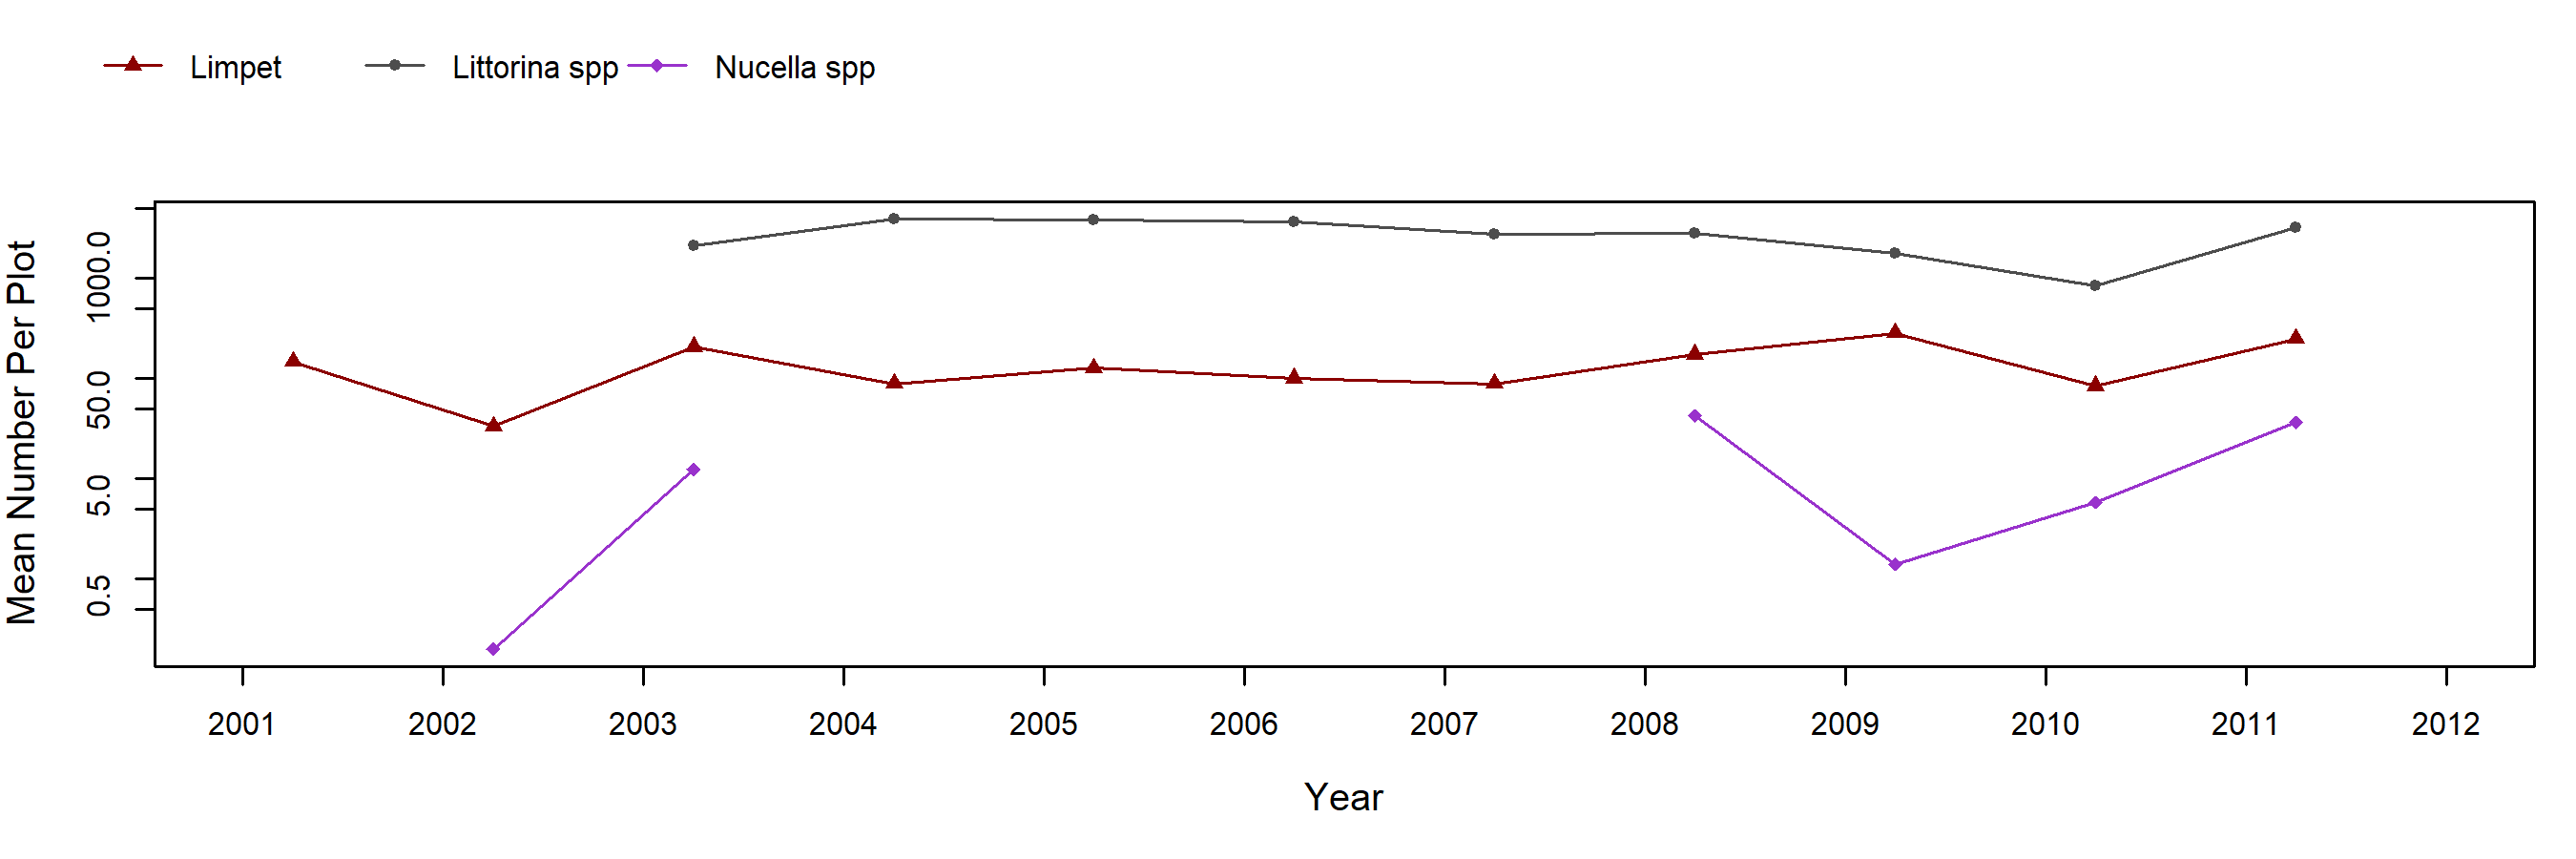
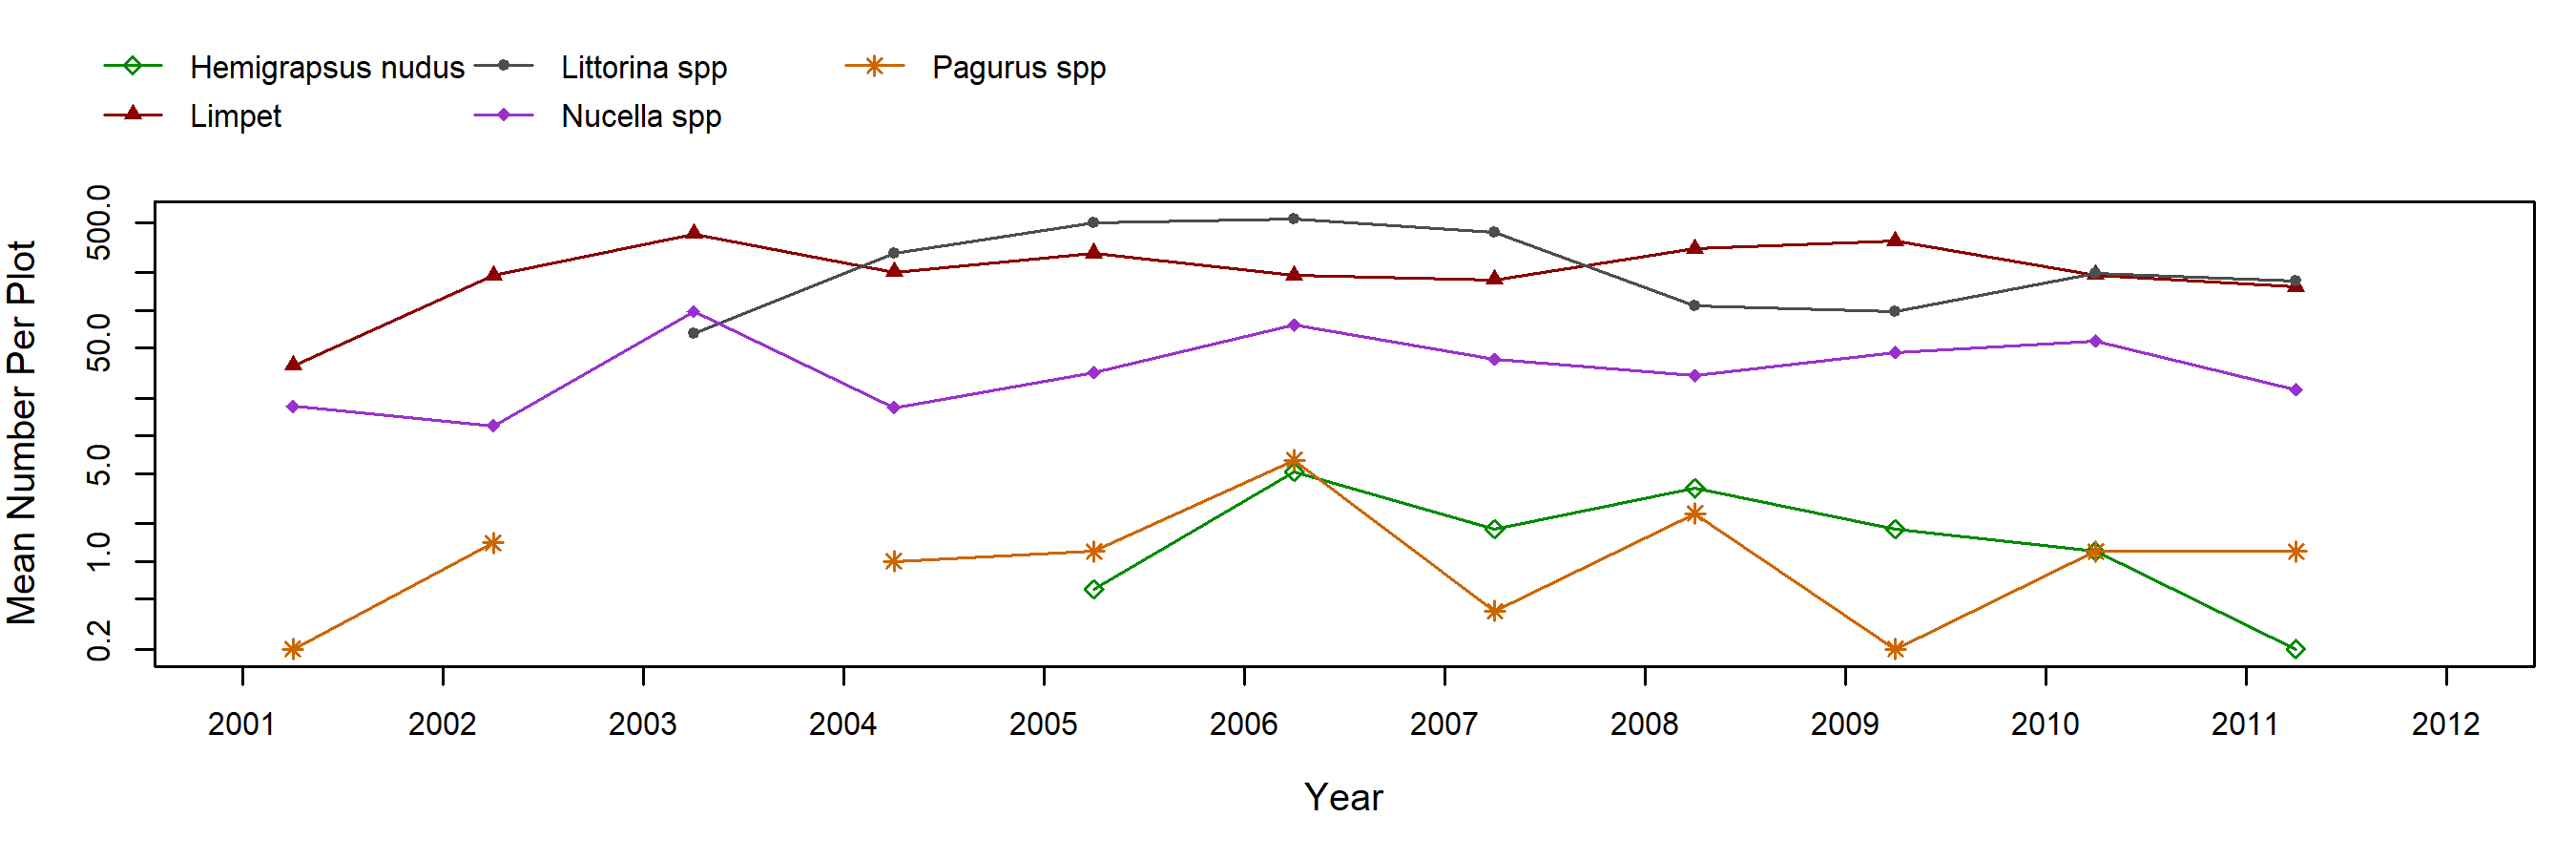
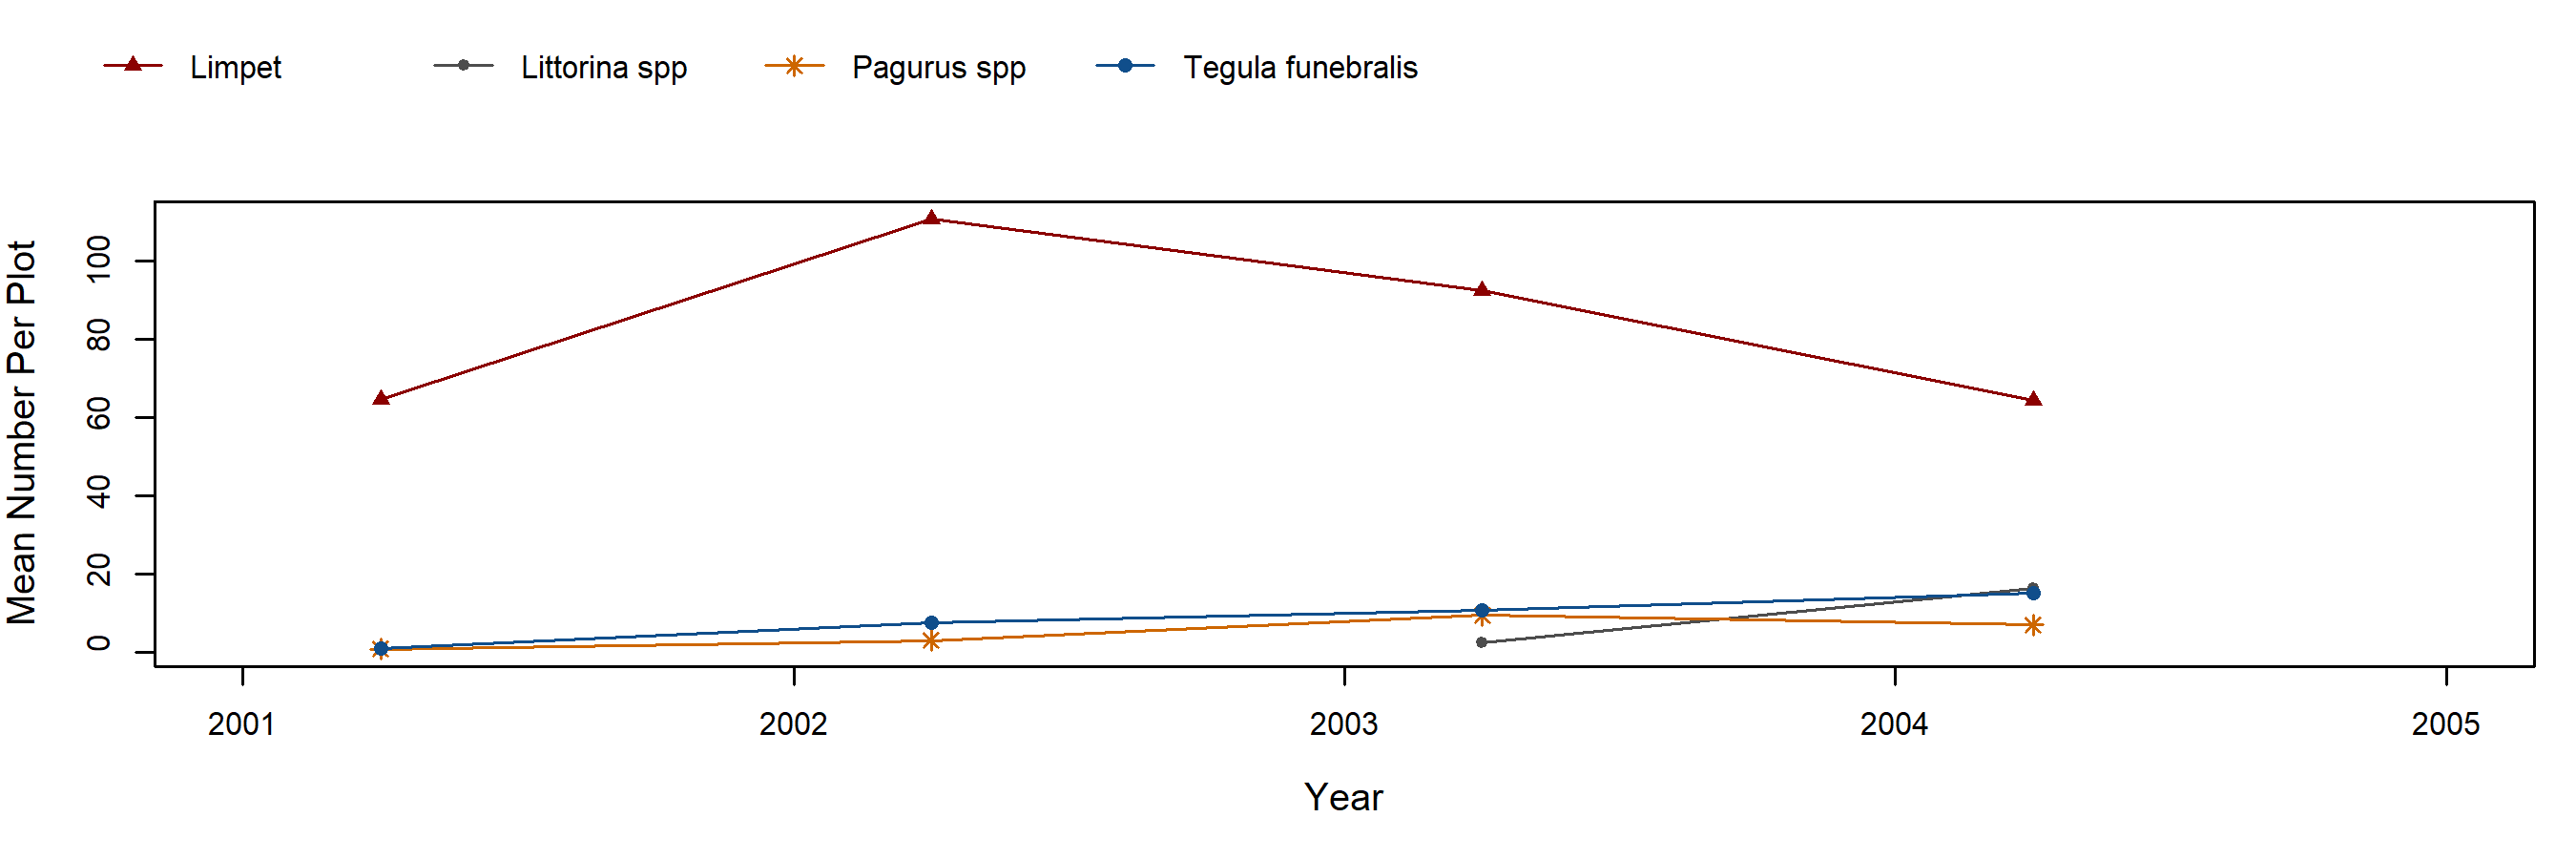
Chthamalus/Balanus (Acorn Barnacles) – motile invertebrate counts
Mytilus (California Mussel) – percent cover
Mytilus (California Mussel) – motile invertebrate counts
Pelvetiopsis (Dwarf Rockweed) – percent cover
Pelvetiopsis (Dwarf Rockweed) – motile invertebrate counts
Neorhodomela (Black Pine) – percent cover
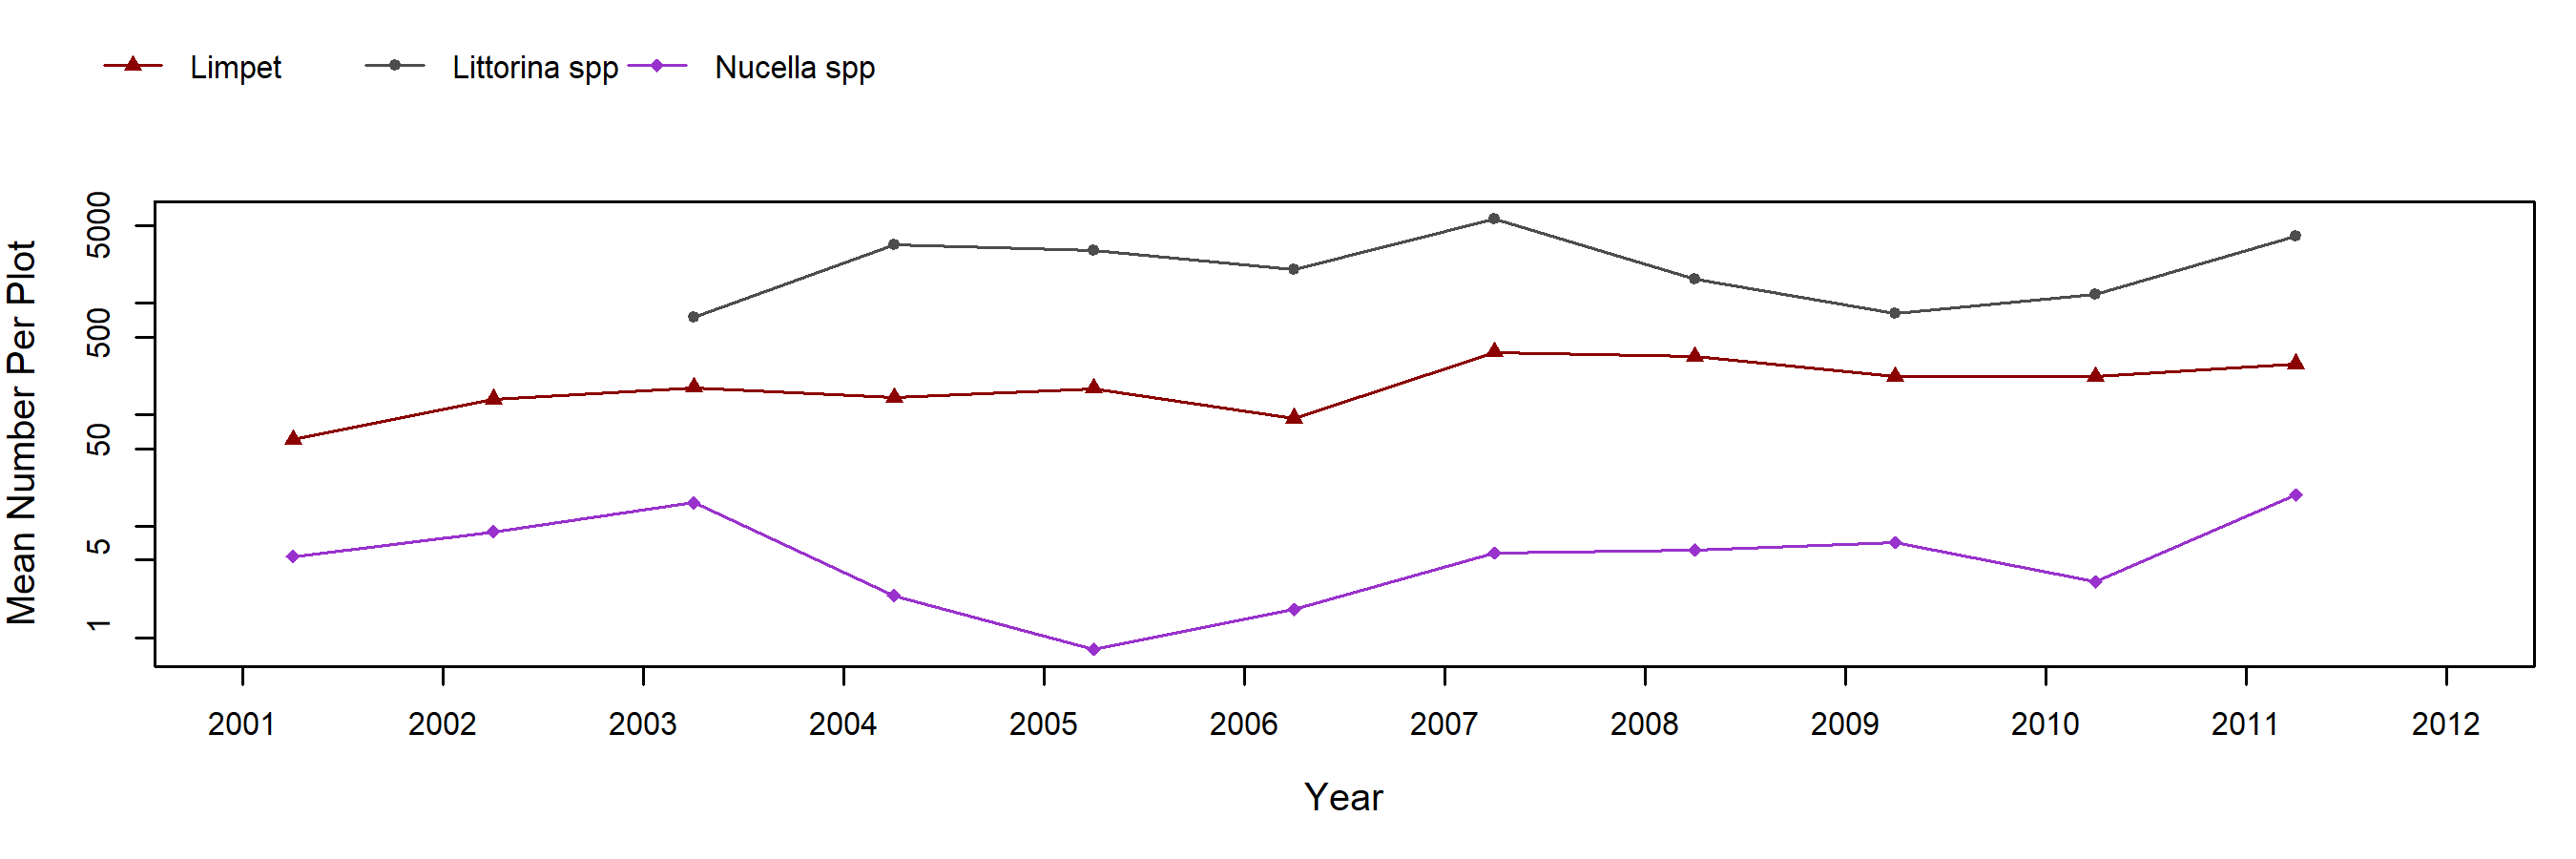
Neorhodomela (Black Pine) – motile invertebrate counts
Transects

Below are the trends observed for each Transect target species at this site. Long-Term trend graphs also include any species that reached a minimum of 25% cover during any single point in time within a given target species assemblage. Breaks in trend lines represent missed sampling events.
Saccharina (Sea Cabbage)
Phyllospadix (Surfgrass)
Species Counts and Sizes

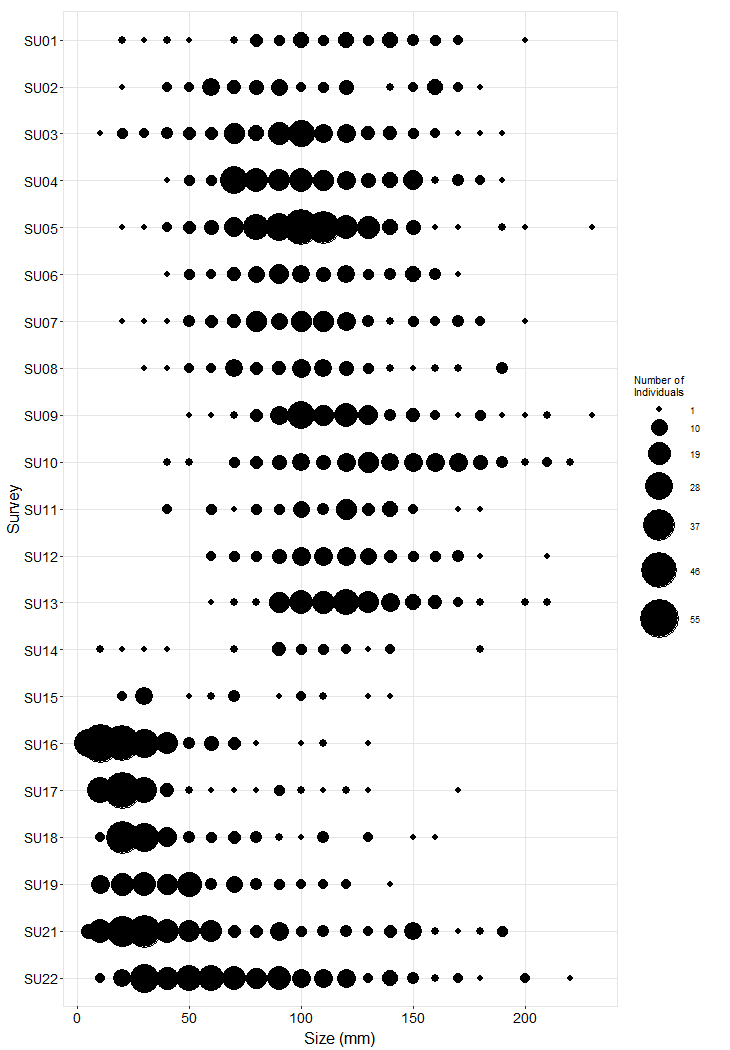
Species Counts and Sizes (where recorded) for Pisaster are shown below for this site. At some sites, other sea star species and Katharina are counted in addition to Pisaster. The sum of all individuals across all plots is displayed. Note that data gaps are represented by breaks in long-term count trend lines, but are not shown in size plots.
Pisaster ochraceus (Ochre Star) – counts
Pisaster ochraceus (Ochre Star) – sizes