Government Point Long-Term trends | MARINe
Government Point Long-Term trends
See below for trend graphs
In order to standardize species resolution across all MARINe groups, and over time, some species (typically rare) were lumped for graphical presentation of Long-Term monitoring data. See lumped categories for definitions (some variation occurs between methods and over time). Due to funding constraints, semi-annual sampling of plots/transects was reduced to annual sampling beginning in 2016. In addition, counts of motile invertebrates within plots at most sites ended in 2014.
Long-term monitoring at Government Pt. was not done in fall 1999 or between 2006-2013, due to site access restrictions. We were able to resume regular monitoring at this site beginning in 2014.
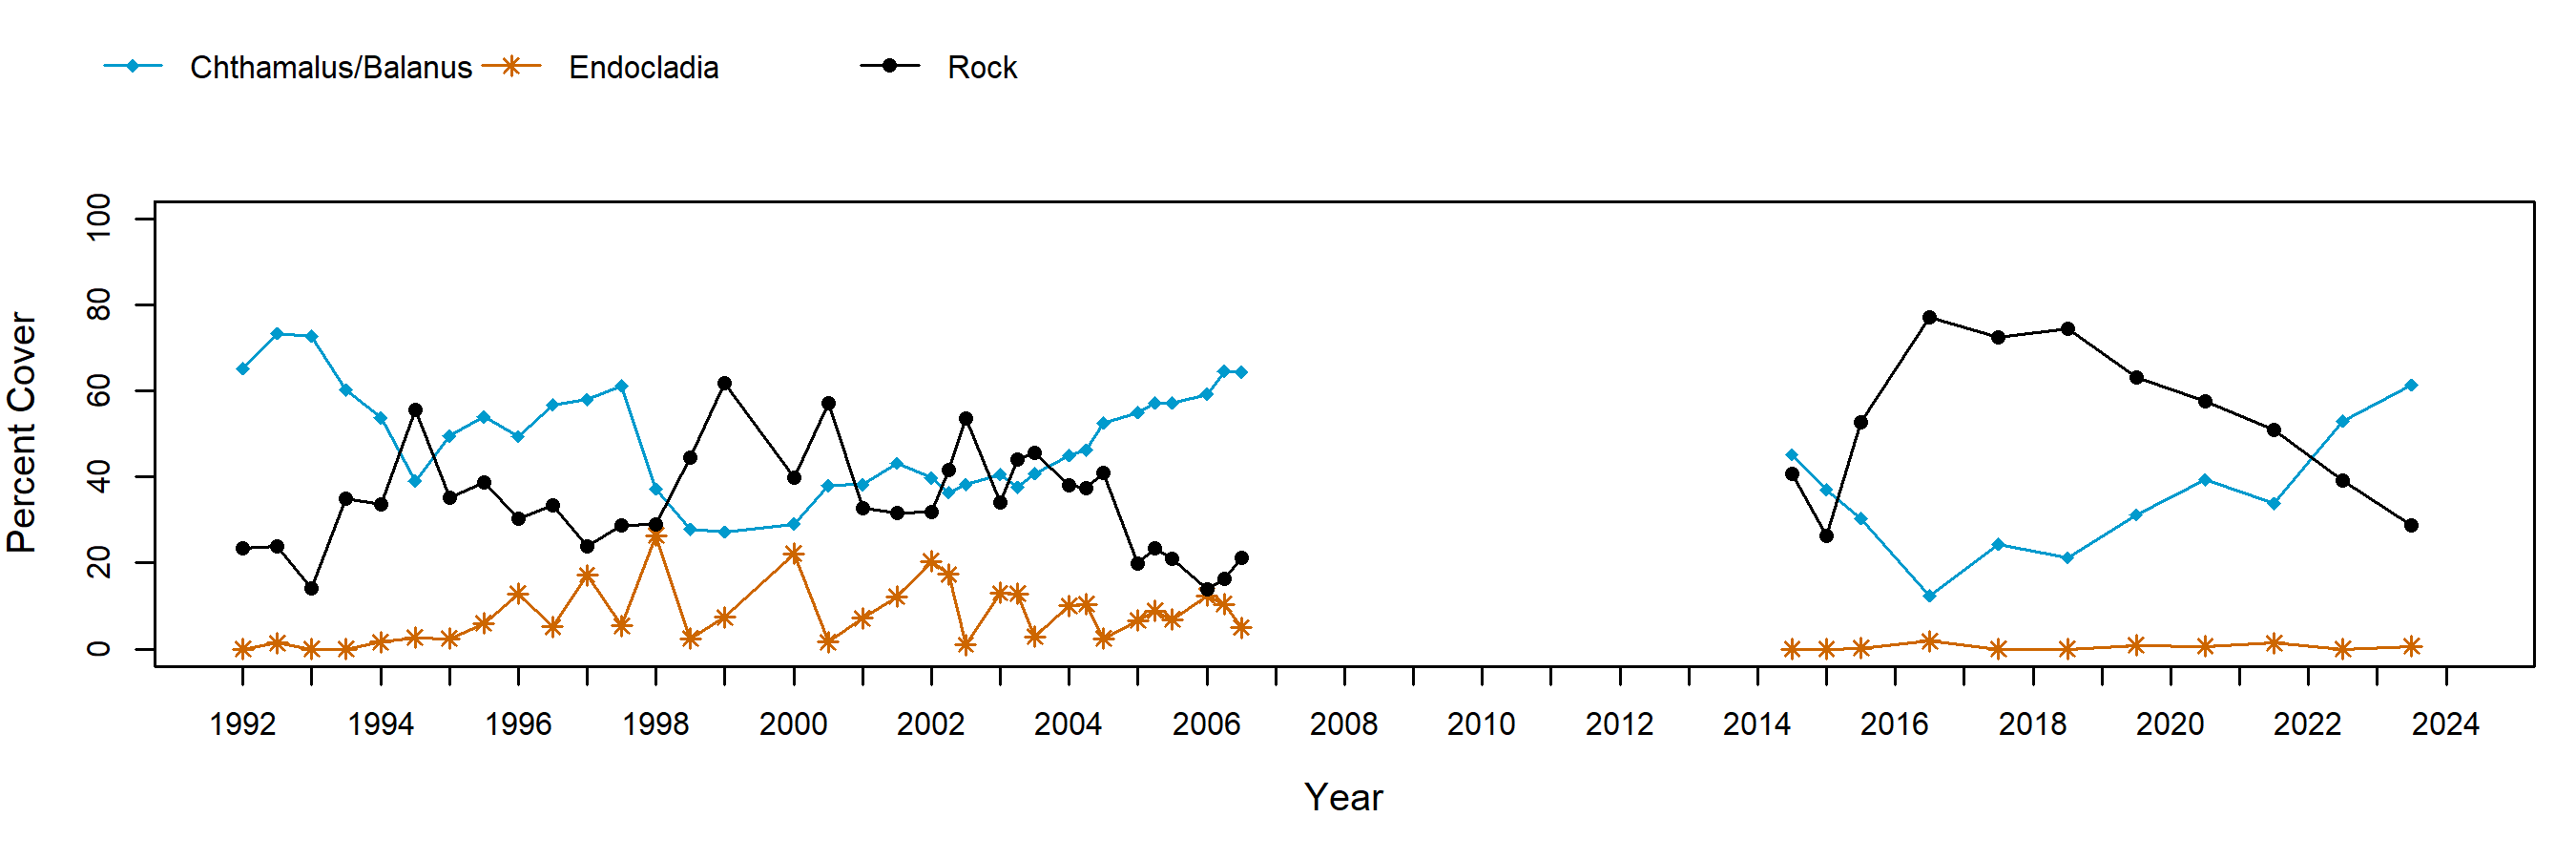
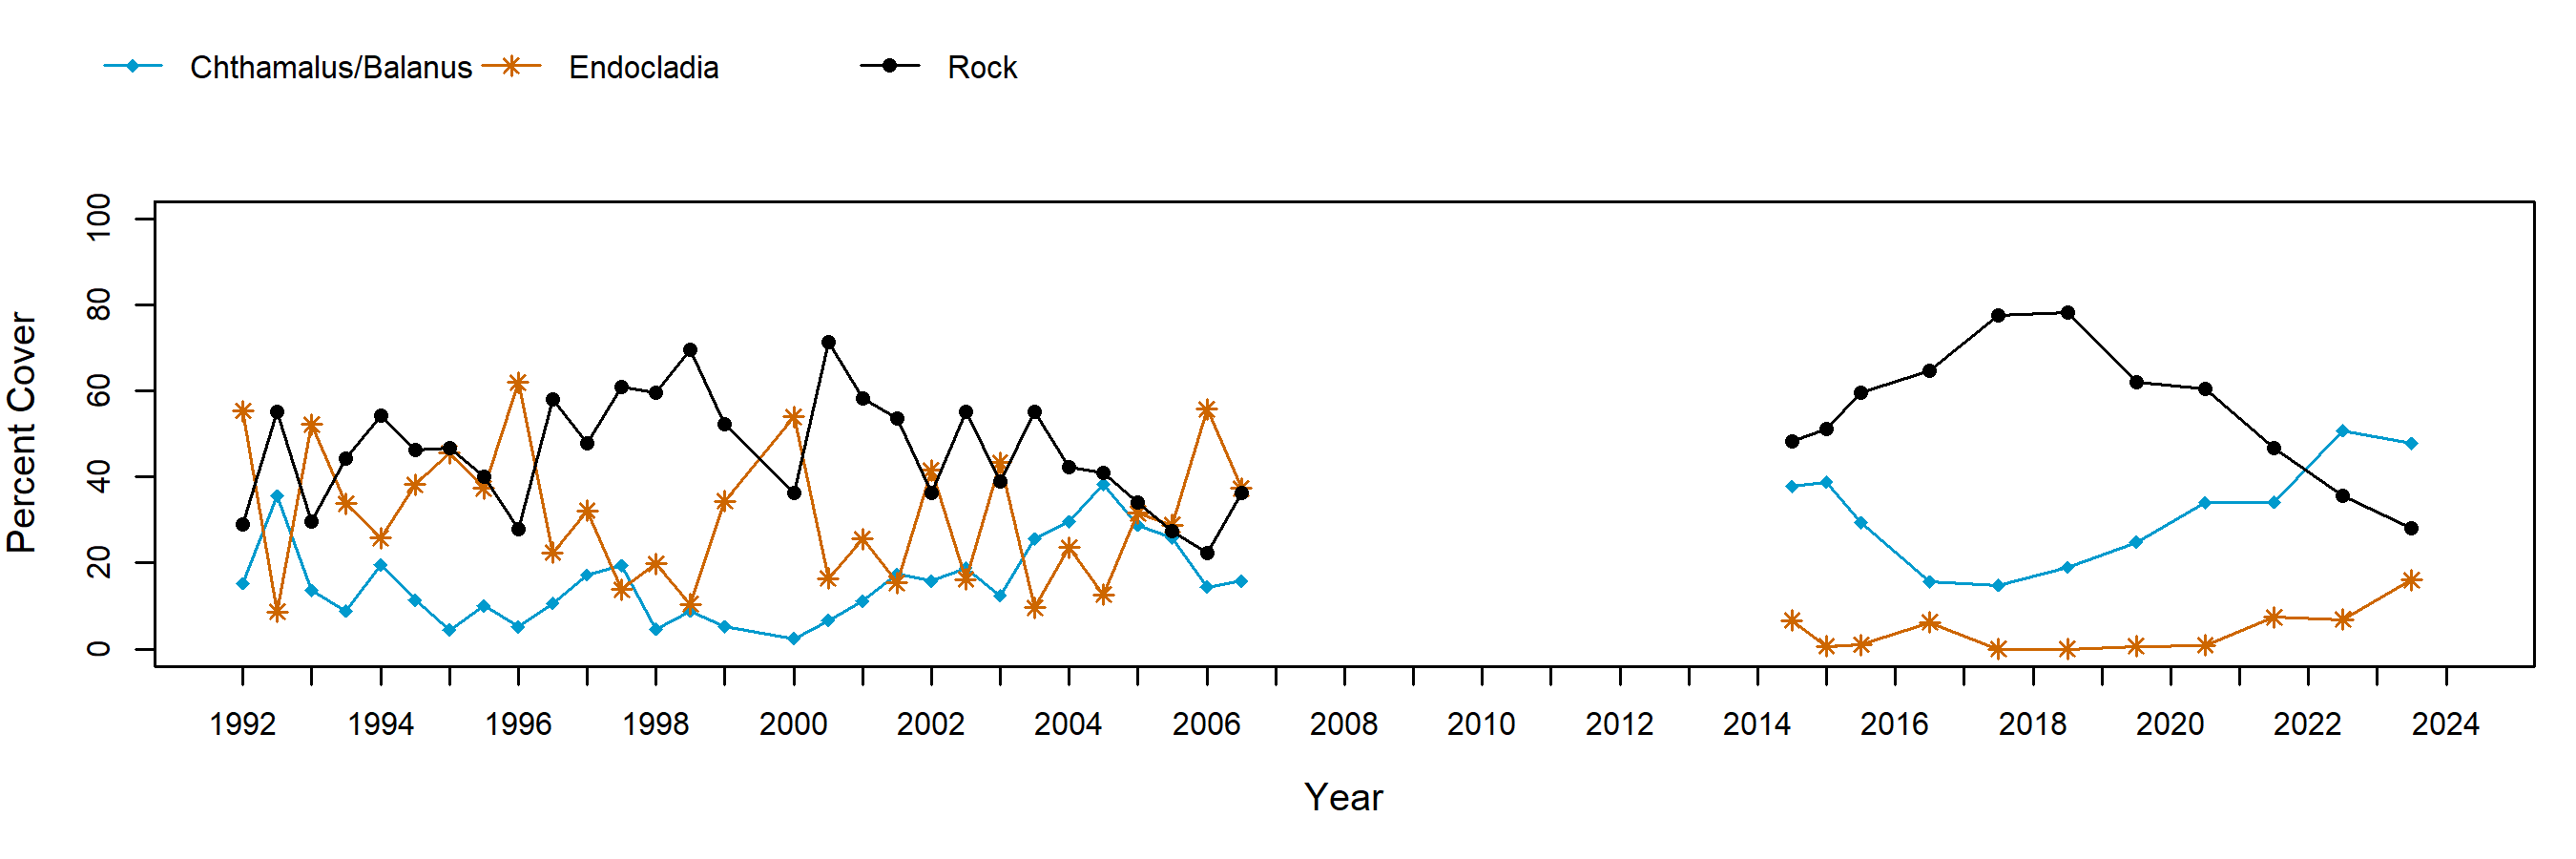
A mixture of Chthamalus fissus/dalli and Balanus glandula was present in the barnacle plots at Government Pt. These barnacles facilitate recruitment of the turfweed, Endocladia muricata, by reducing grazing pressure by limpets. We have observed this facilitation at Government Pt., where dips in barnacle cover are associated with increases in turfweed cover in the plots. Mean cover of barnacles was much lower in recent years ((2016-2019) at just over 20%, compared to the long-term mean of 50%. Limpets and littorines were both abundant within these plots.
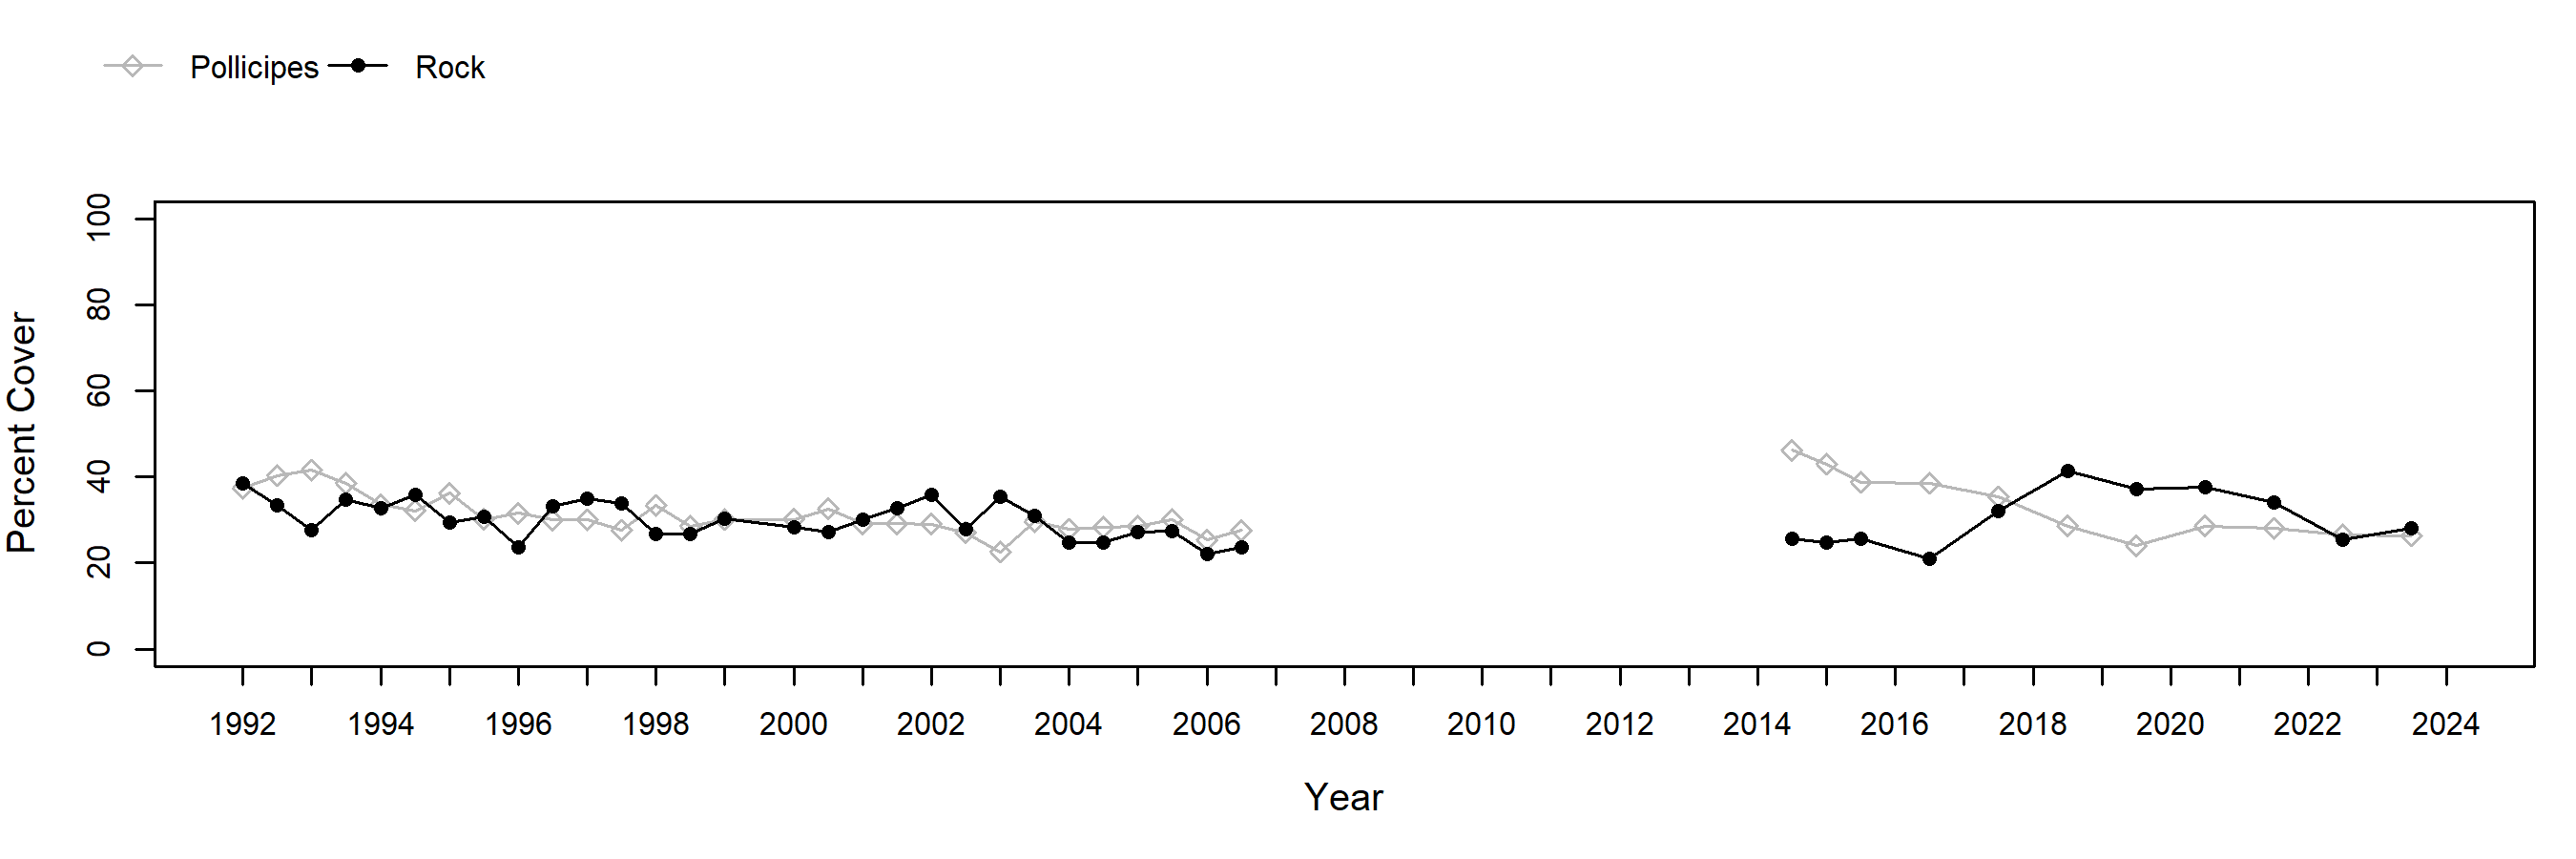
Cover of the gooseneck barnacle, Pollicipes, was quite constant between 1992-2006 at Government Pt, then increased slightly in 2014 before dropping back down to around 25% cover. These long-lived barnacles are harvested for food in many areas accessible to the public, but are protected from collection pressure at Government Pt.
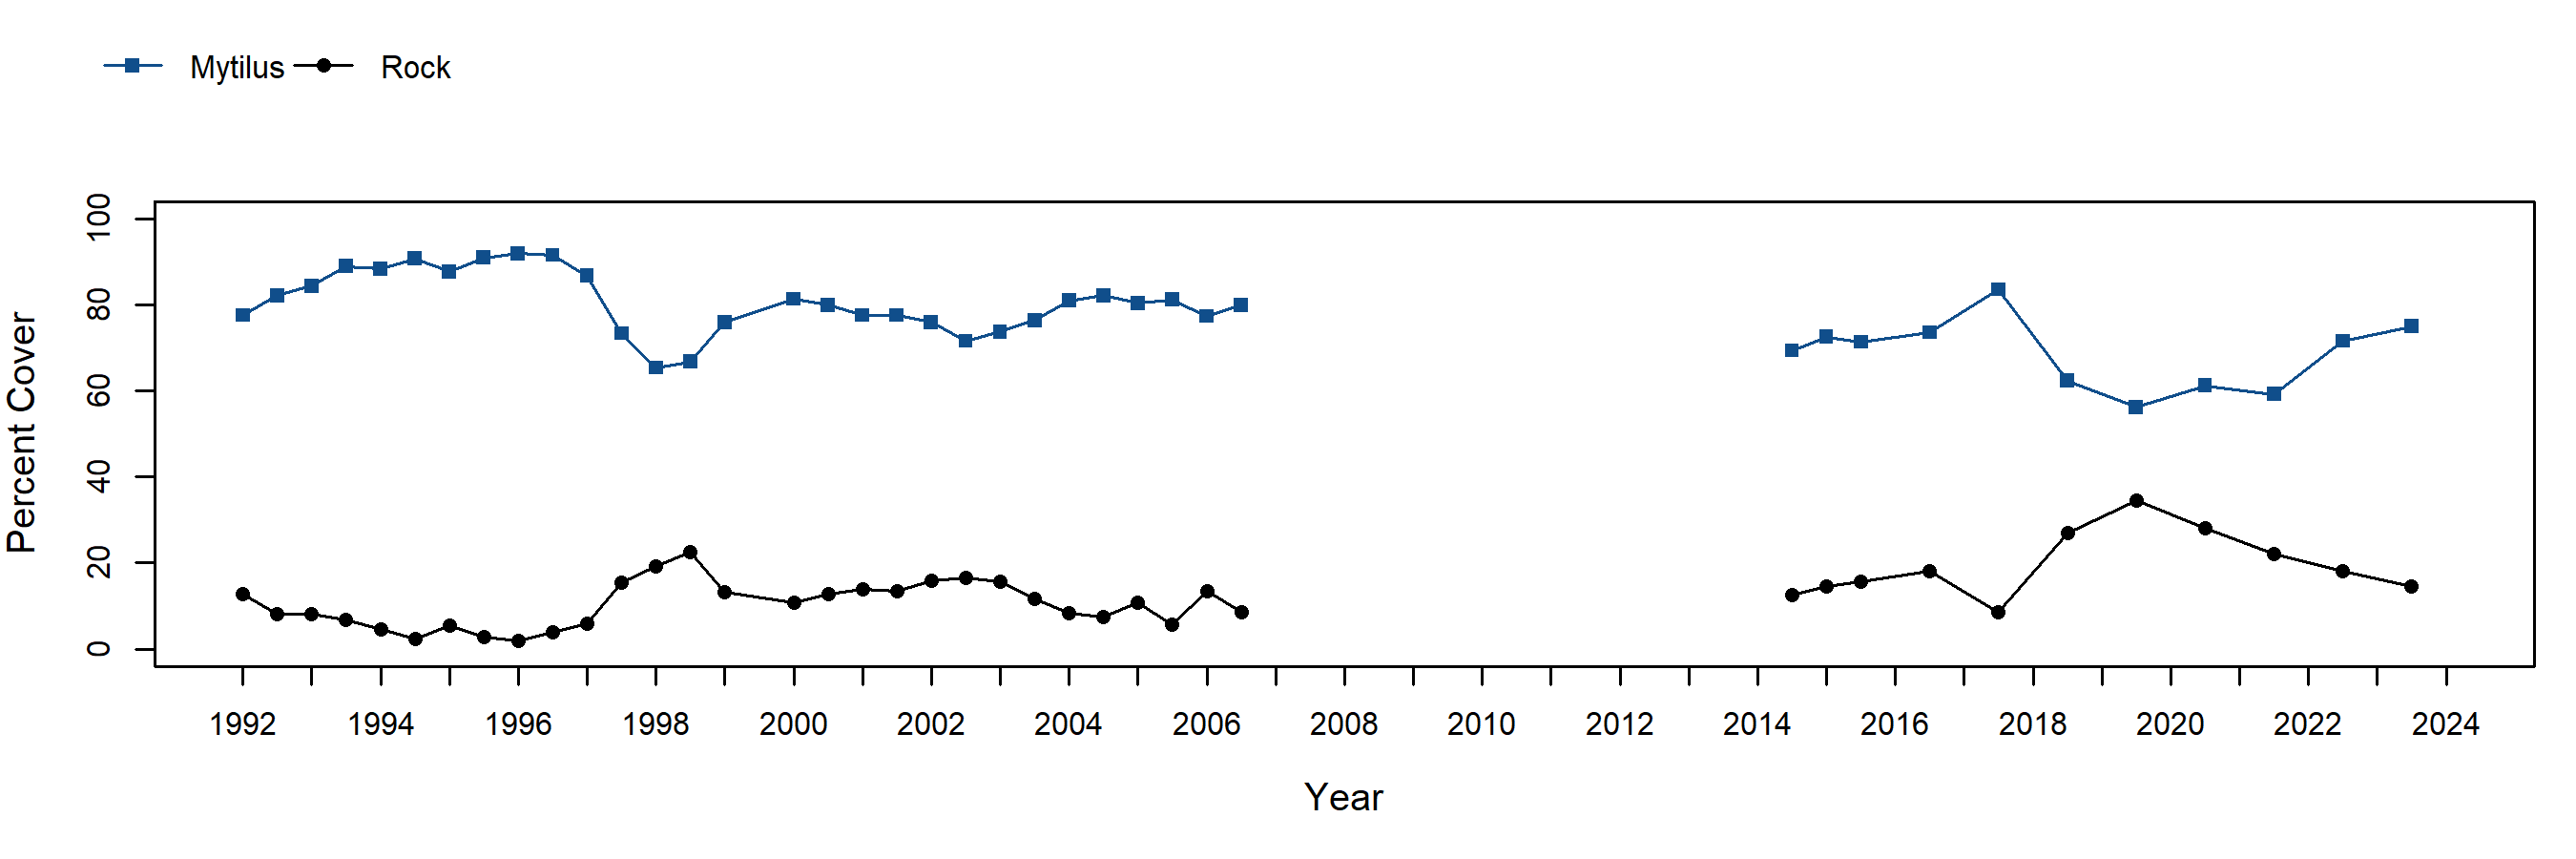
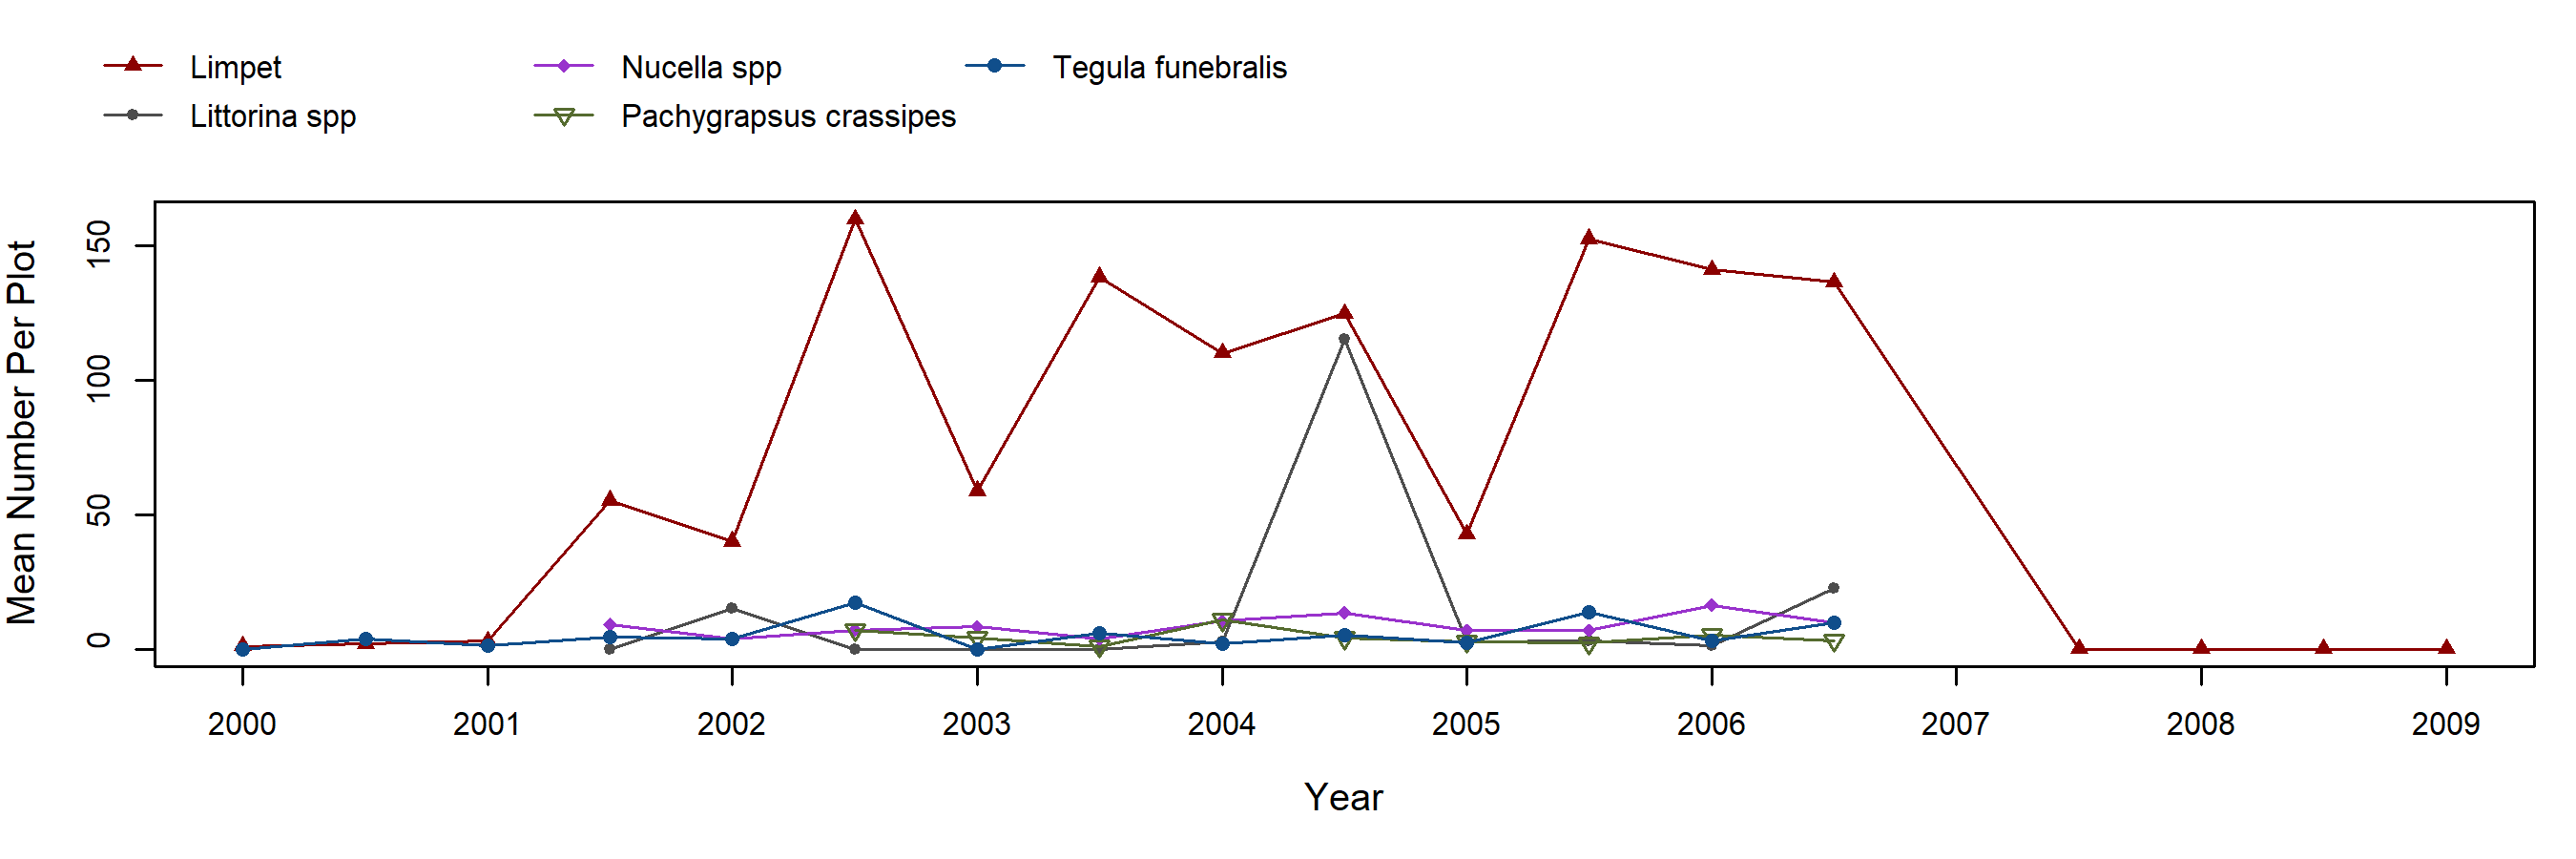
The California mussel (Mytilus californianus), forms a dense bed in the mid-low intertidal zones of Government Pt., which provides food and shelter for an incredible diversity of organisms. Large storm events can tear out patches of mussels, as is evidenced by the dip in mussel cover during the 1997/98 El Niño period. This storm-induced decline was followed by rapid recovery, and long-term cover of mussels at Government Pt. was quite stable through 2006, and had not changed substantially when the plots were re-surveyed in 2014. During the two most recent surveys, mussel cover was lower than the long-term mean, at just under 60%. Limpets were the most common motile invertebrate found in the mussel plots, but a number of other species were also common, including the snails, Tegula funebralis, Nucella spp. and littorines, and the shore crab, Pachygrapsus crassipes.
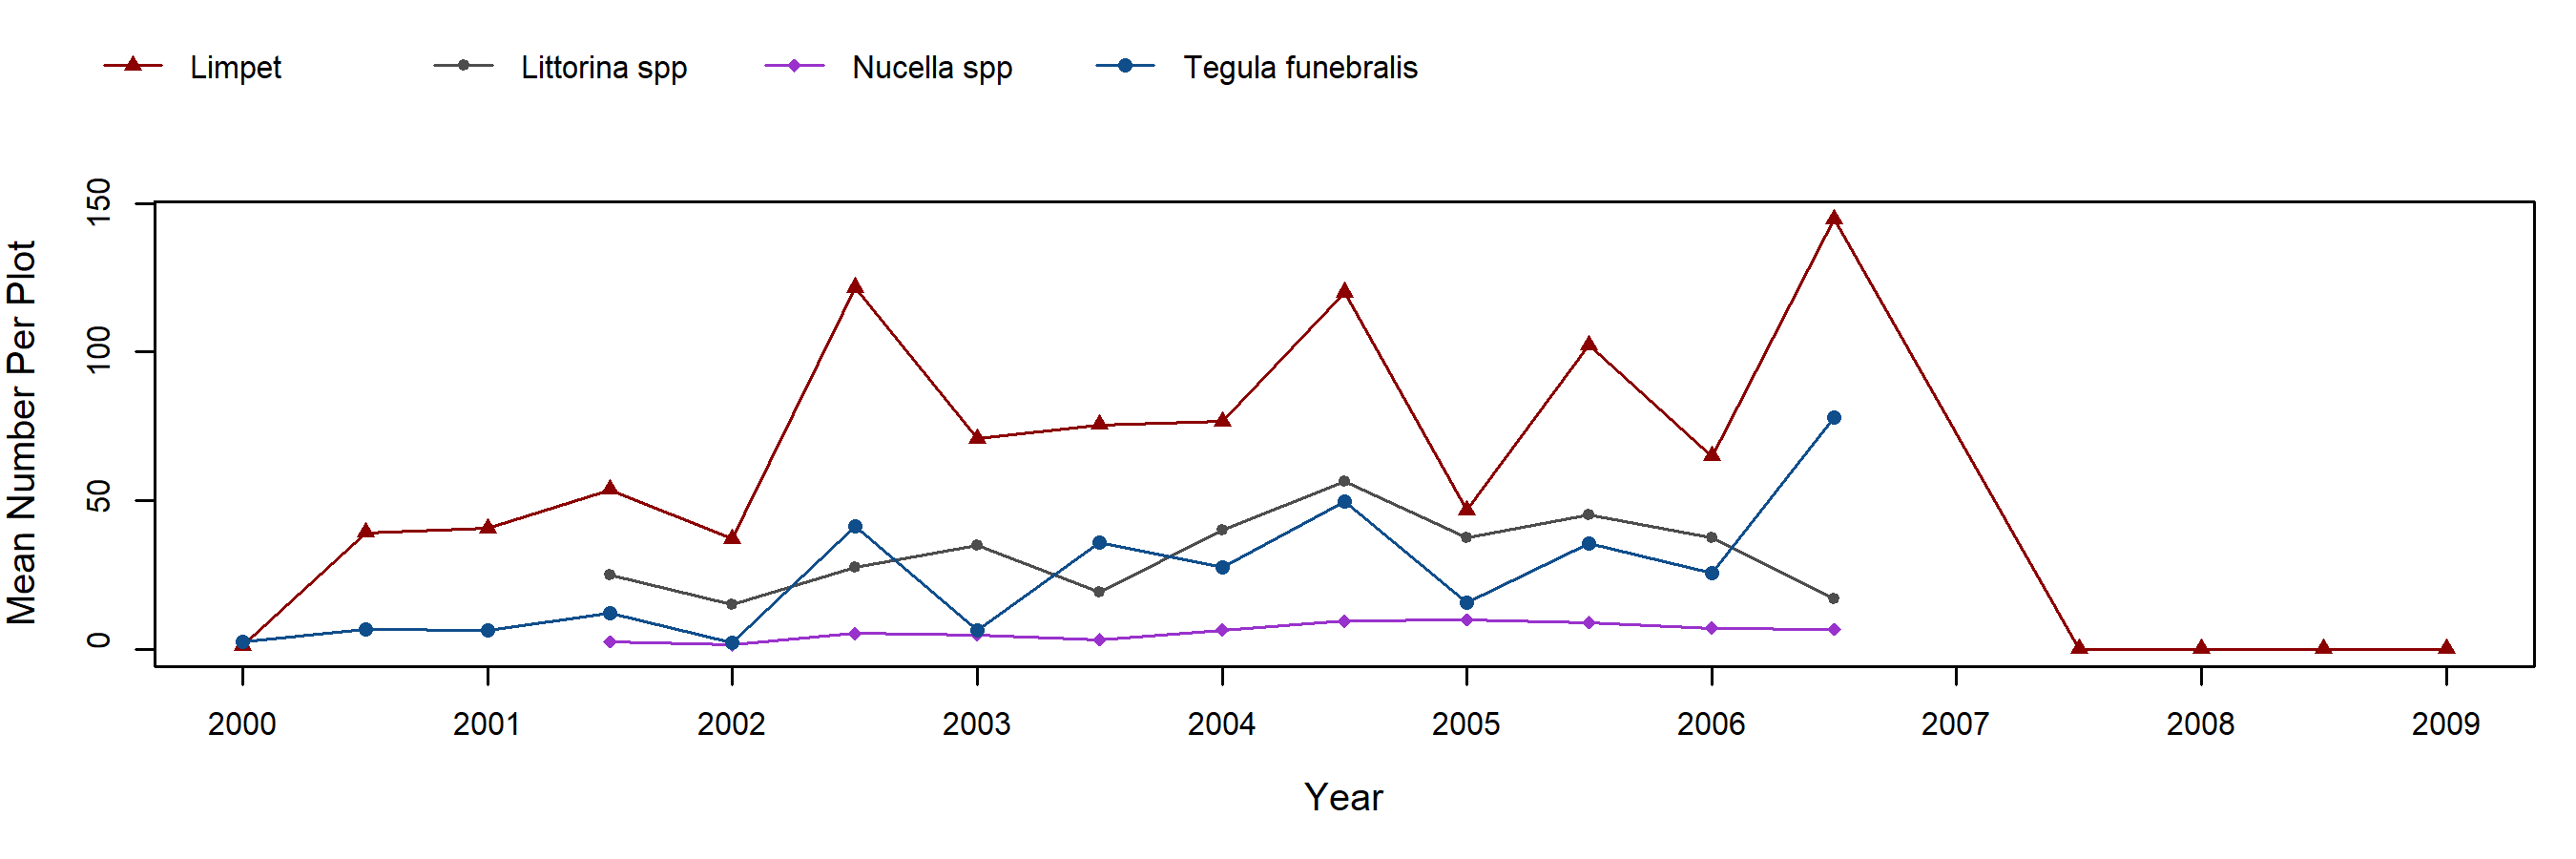
A significant downward trend in the cover of Silvetia compressa at Government Pt. was evident through 2006, and appeared to continue through recent years, with mean cover in 2014-2019 around 30%. The pattern is largely driven by plots 3 and 5. When plot 3 was established it had an understory of mussel cover, which has persisted while Silvetia cover has declined. In fall 2006 there was only about 15% cover in this plot and when sampling of this site resumed in fall 2014 Silvetia was completely absent and has not recovered. In Plot 5 there were a few Pollicipes in the understory and the drop in 2006 was likely due to winter storms in 2005 dislodging Silvetia. To date, plot 5 has not recovered and is now dominated by Pollicipes and bare rock. Silvetia cover has also been declining in plots 1 and 2 since 2018 and in 2019 only plot 4 had high Silvetia cover. As with many other sites, Silvetia showed a seasonal pattern in cover, with lower values in spring vs. fall samples. Silvetia plots contained high numbers of Tegula funebralis and limpets. Littorines and Nucella spp. were also common.
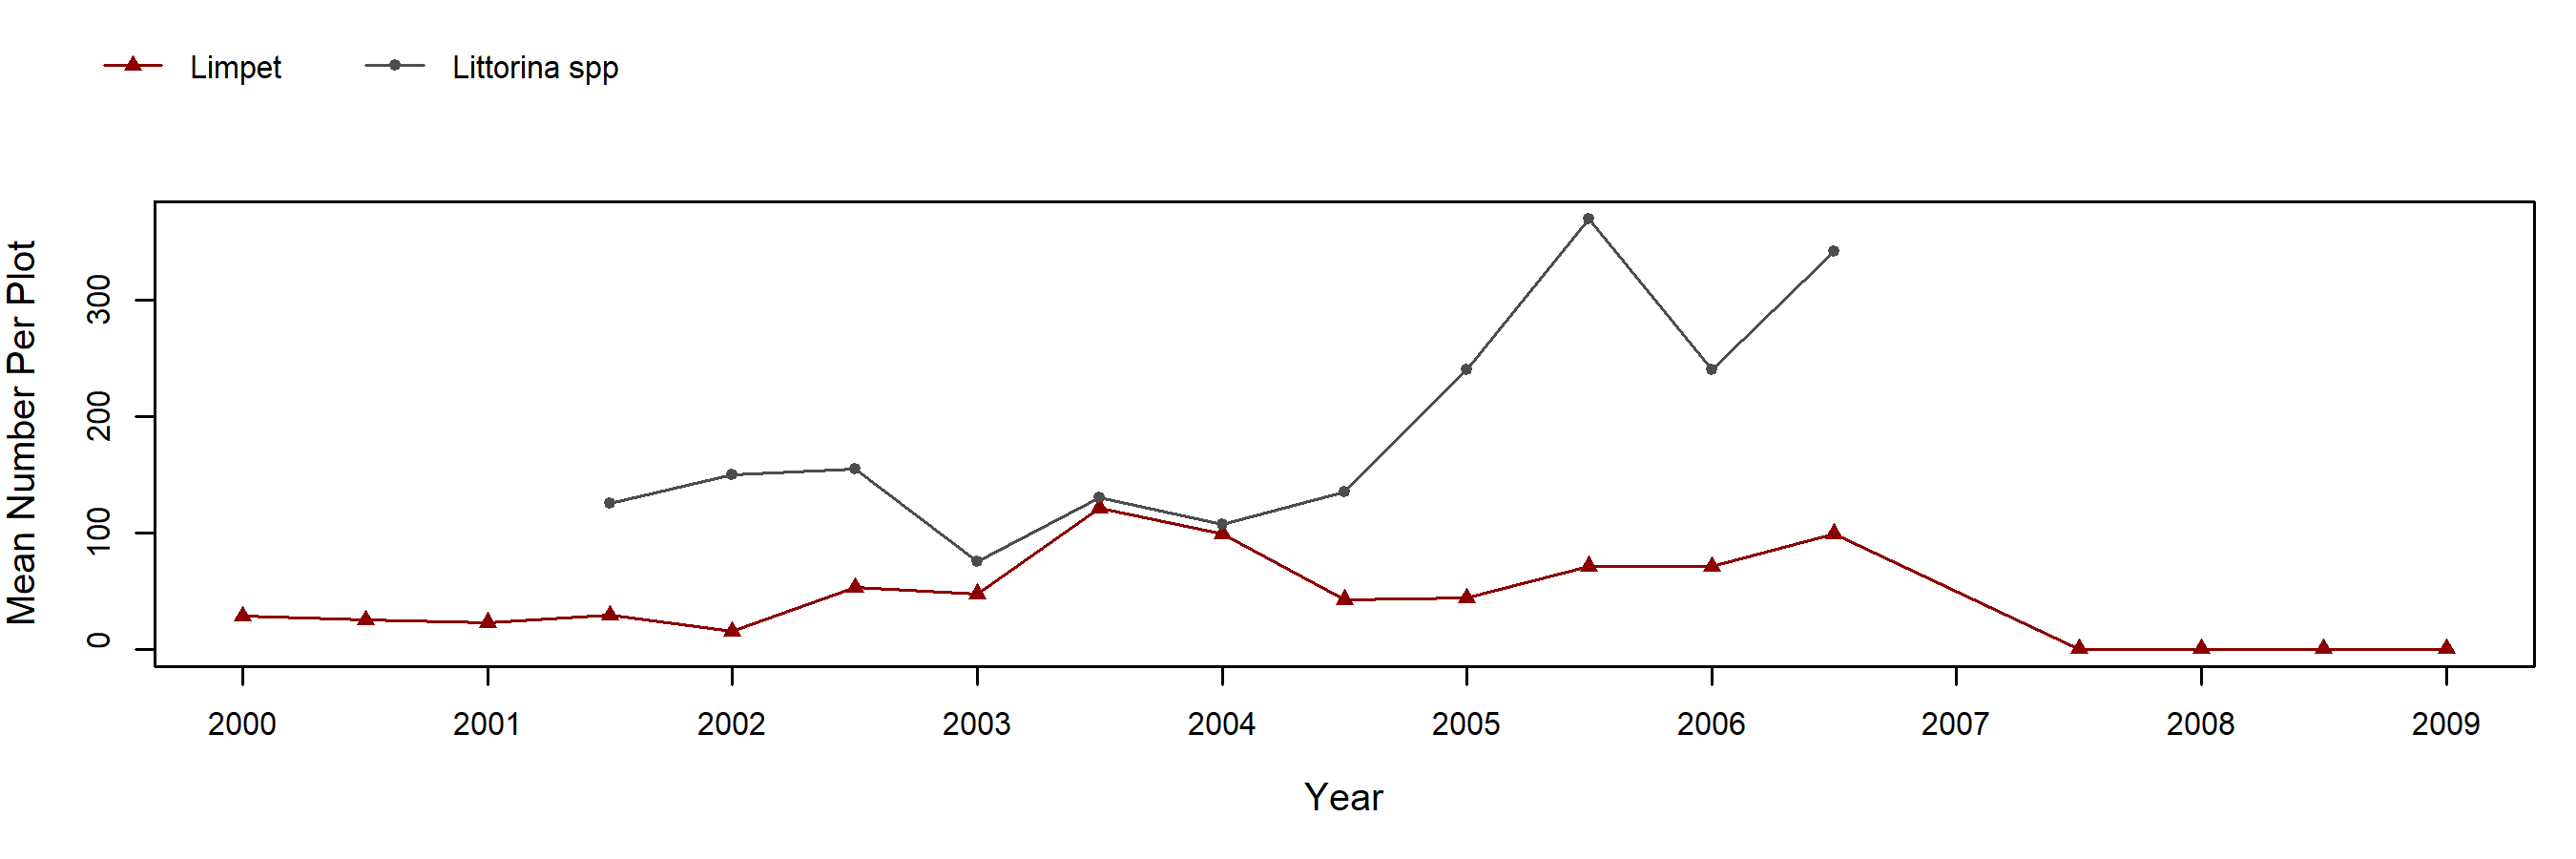
Turfweed (Endocladia muricata) forms distinctive dark red bands in the high zone of rocky intertidal shores north of Pt. Conception/Government Point. Turfweed abundance fades in warmer waters to the south, thus monitoring at Government Pt. is critical for detecting the potential effects of warming water trends that might be associated with climate change. Turfweed provides habitat for a host of tiny organisms, and facilitates the recruitment of rockweeds. Turfweed abundance at Government Pt. has been highly variable over time, with typically much higher cover in spring than in fall. However, in recent years (2014-2019) Endocladia cover has decreased dramatically, while rock cover has increased. Littorines and limpets were the most common motile invertebrates found in these high intertidal plots.
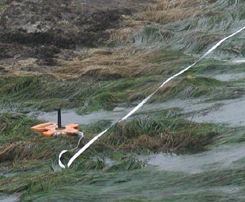
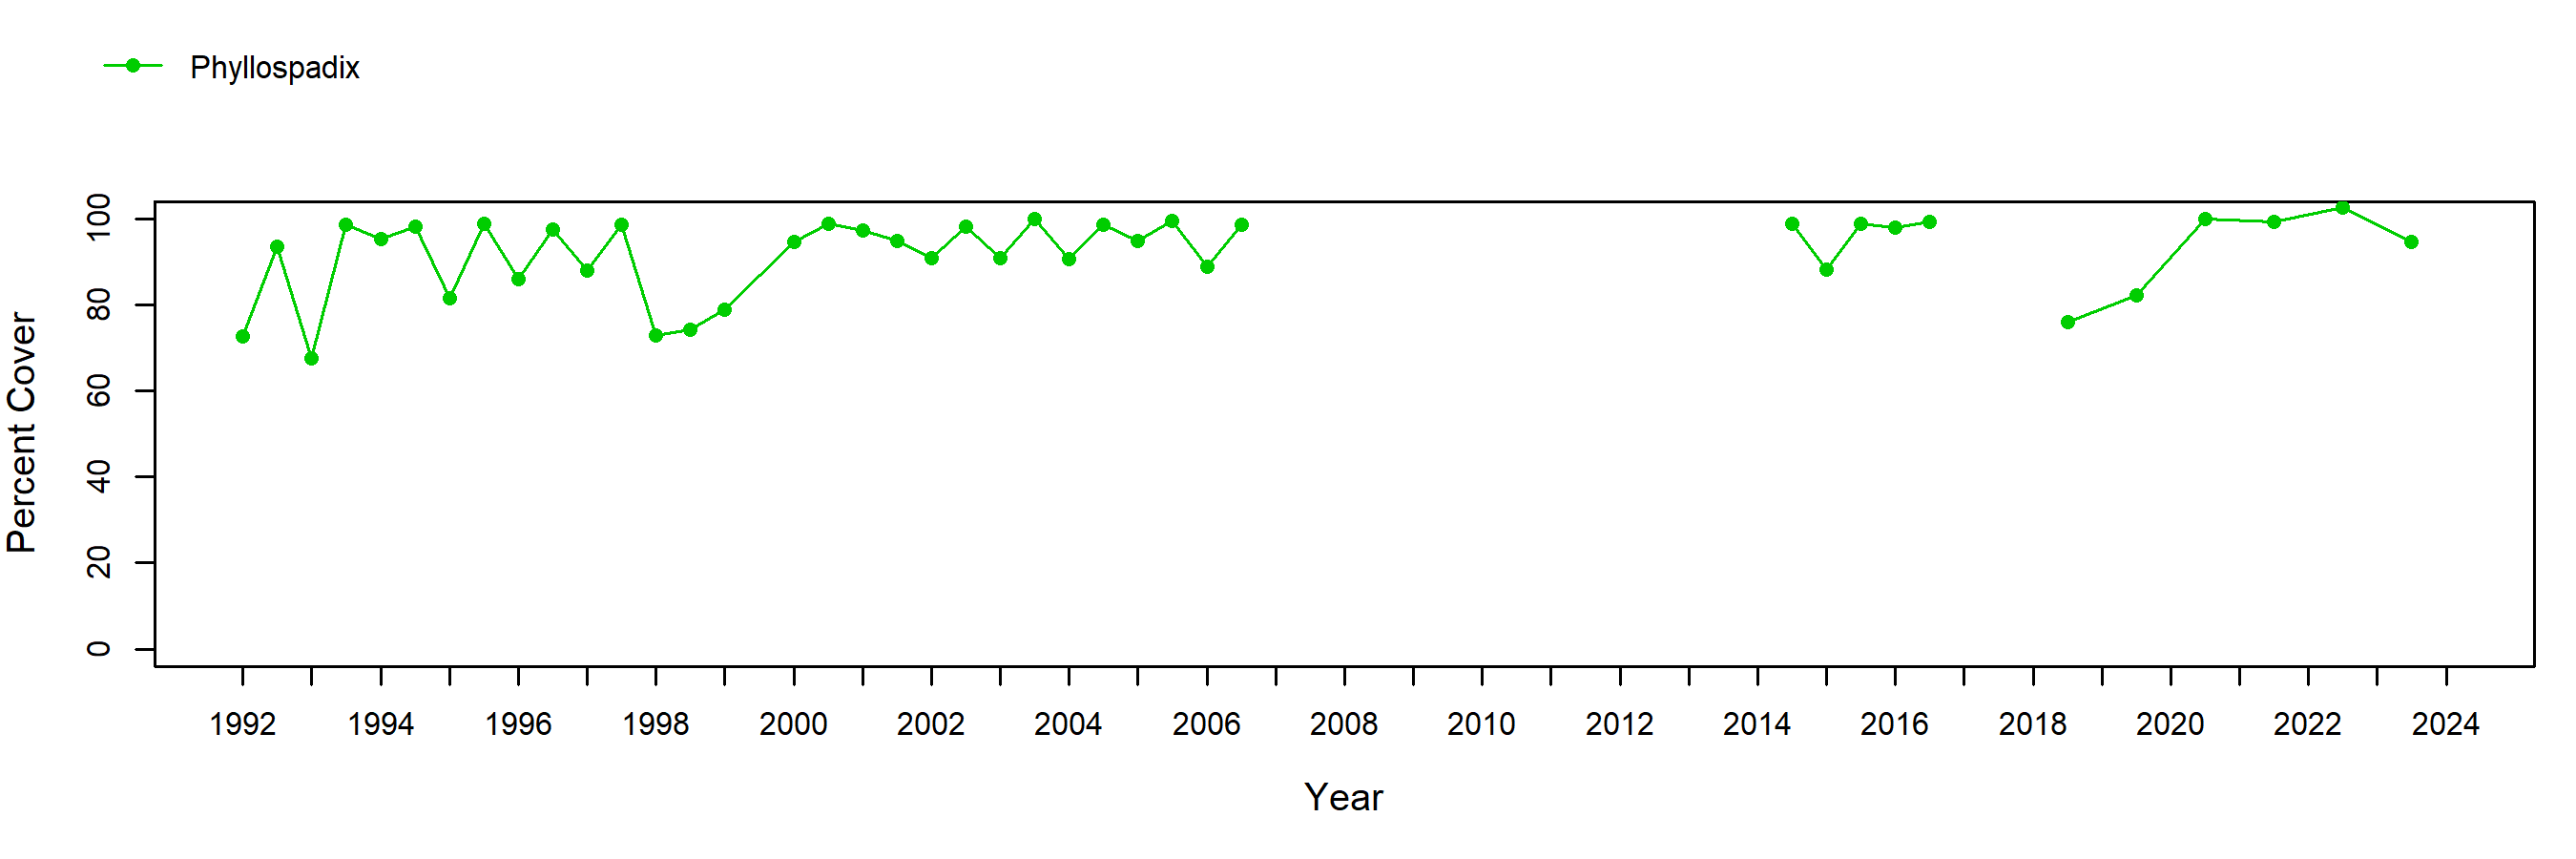
Surfgrass (Phyllospadix spp.) beds are highly productive ecosystems, providing structurally complex microhabitats for a rich variety of organisms. Surfgrass provides nursery habitat for various fishes and invertebrates, including the California spiny lobster. Surfgrass can be particularly sensitive to pollution and oil spills, and large patches can be removed by high wave energy events, such as those associated with El Niño periods. Indeed, the surfgrass cover at Government Pt. experienced substantial decline during the 1997/98 El Niño event. As observed at most other sites, Phyllospadix cover fluctuated seasonally, with higher cover in fall than in spring. Large waves prevented us from sampling all three plots in fall 2017 and plot 3 in fall 2018.
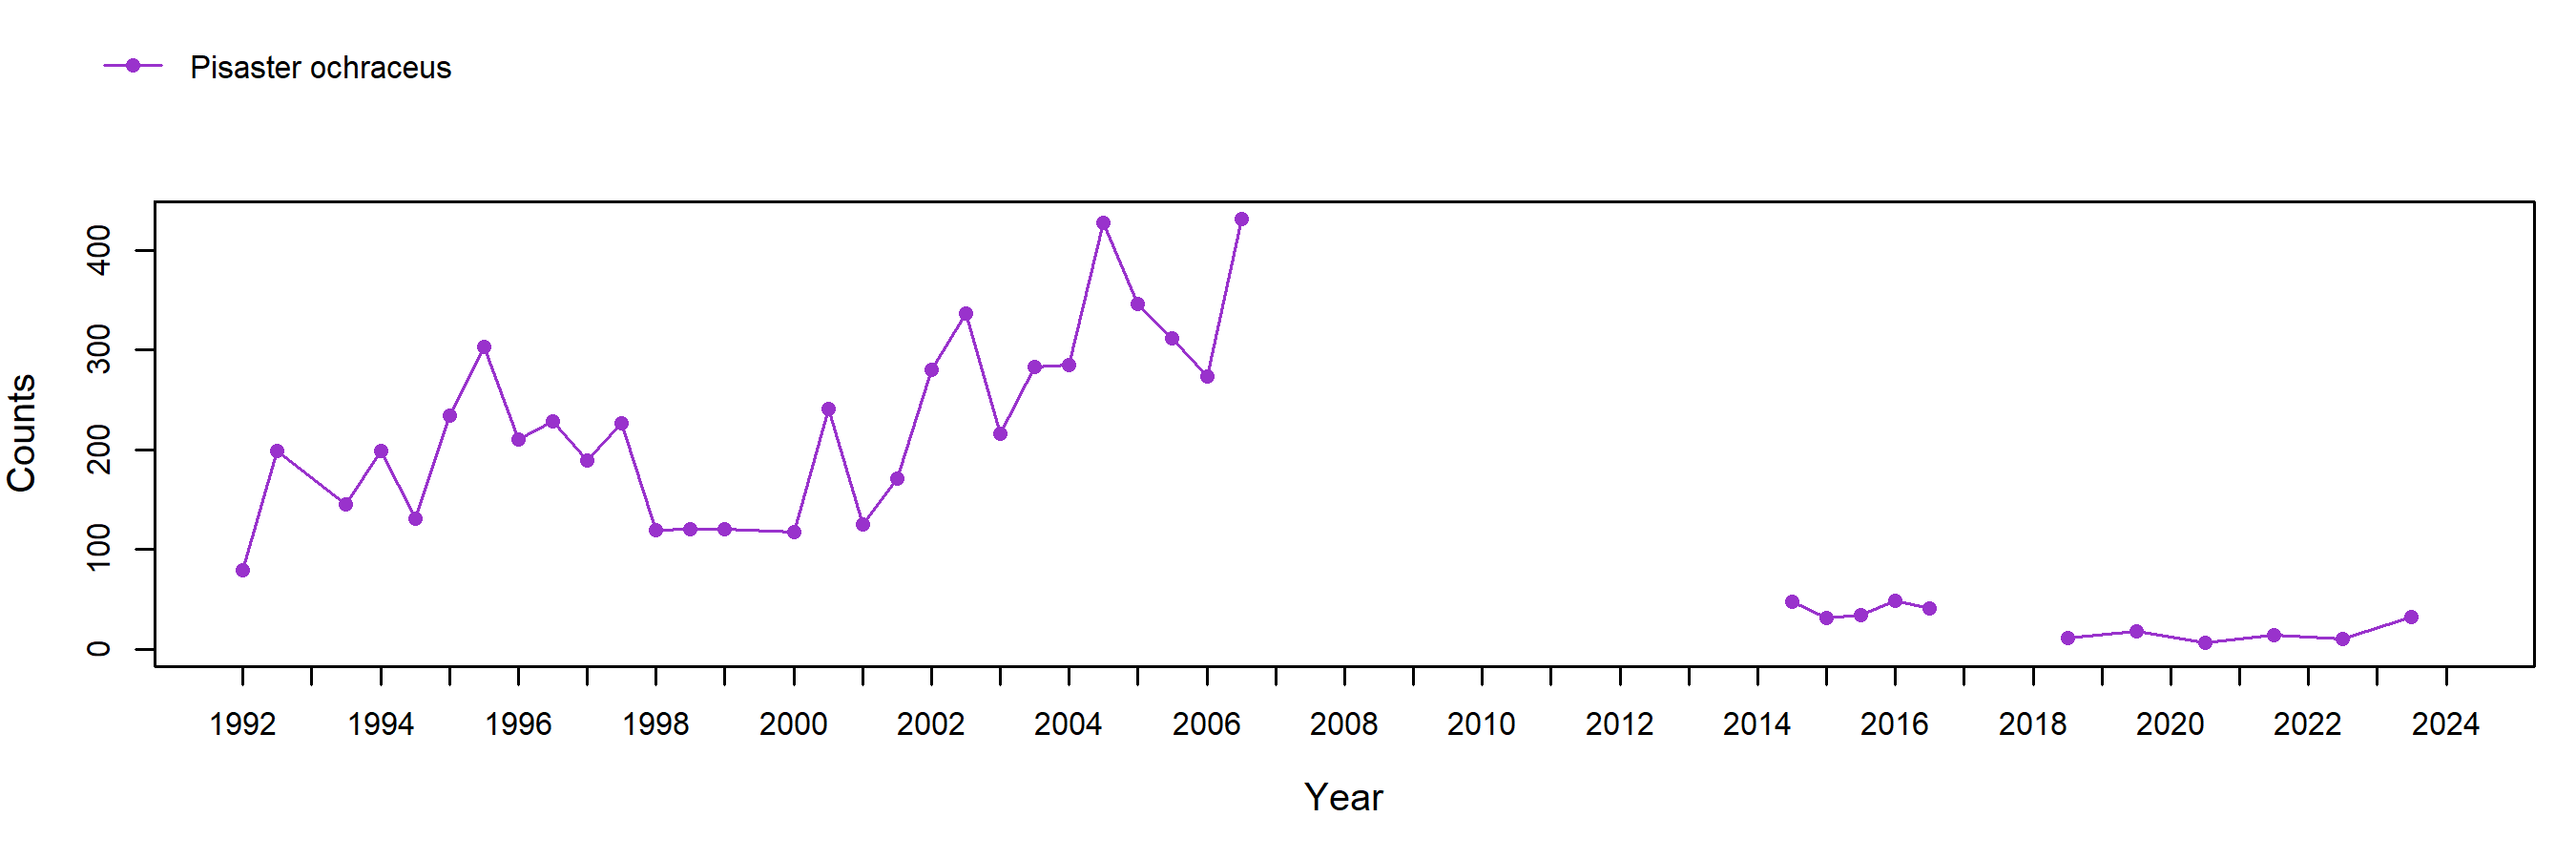
The ochre star (Pisaster ochraceus) is much more common north of Pt. Conception/Government Pt. than it is south of this biogeographic barrier, making Government Pt. an important site for detecting any impacts to this species that might spread northward up the coast, such as disease, or declines due to warming ocean temperatures. Sea star numbers were variable at Government Pt., but appeared to be increasing between 2000-2006. In 2006 there were more than 400 sea stars in the plots at Government Pt., but in 2014 only 30 individuals were recorded. Evidence of Sea Star Wasting Syndrome (SSWS) was found at the site in 2014 and it appears that the disease is likely responsible for the sharp decline observed. In recent years (2016-2019), no juvenile ochre stars (< 30mm radius) were found in our plots, and the overall count continues to be very low, indicating little to no recovery since the SSWS decline. Plot 1 at Government Pt. is quite low in tidal height and cannot be sampled when waves are large, as was the case in spring 1992,spring 2001, spring 2015, fall 2015 and fall 2018. No sea star plots could be sampled in spring 1993 and fall 2017.
Photo Plots
Below are the trends observed for each Photo Plot target species at this site. Long-Term percent cover trend graphs also include any species that reached a minimum of 25% cover during any single point in time within a given target species assemblage. Breaks in trend lines represent missed sampling events. For additional species observed that did not meet this 25% threshold, please use the Interactive Map.
For motile invertebrate Species Counts, a mean across all plots was calculated, and only those species with a value of at least 5 individuals for at least one sample are shown. Due to time constraints, motile invertebrate counts have not been done at most sites since 2012. For motile invertebrate size trend graphs by site, please use the Interactive Map.
Chthamalus/Balanus (Acorn Barnacles) - percent cover
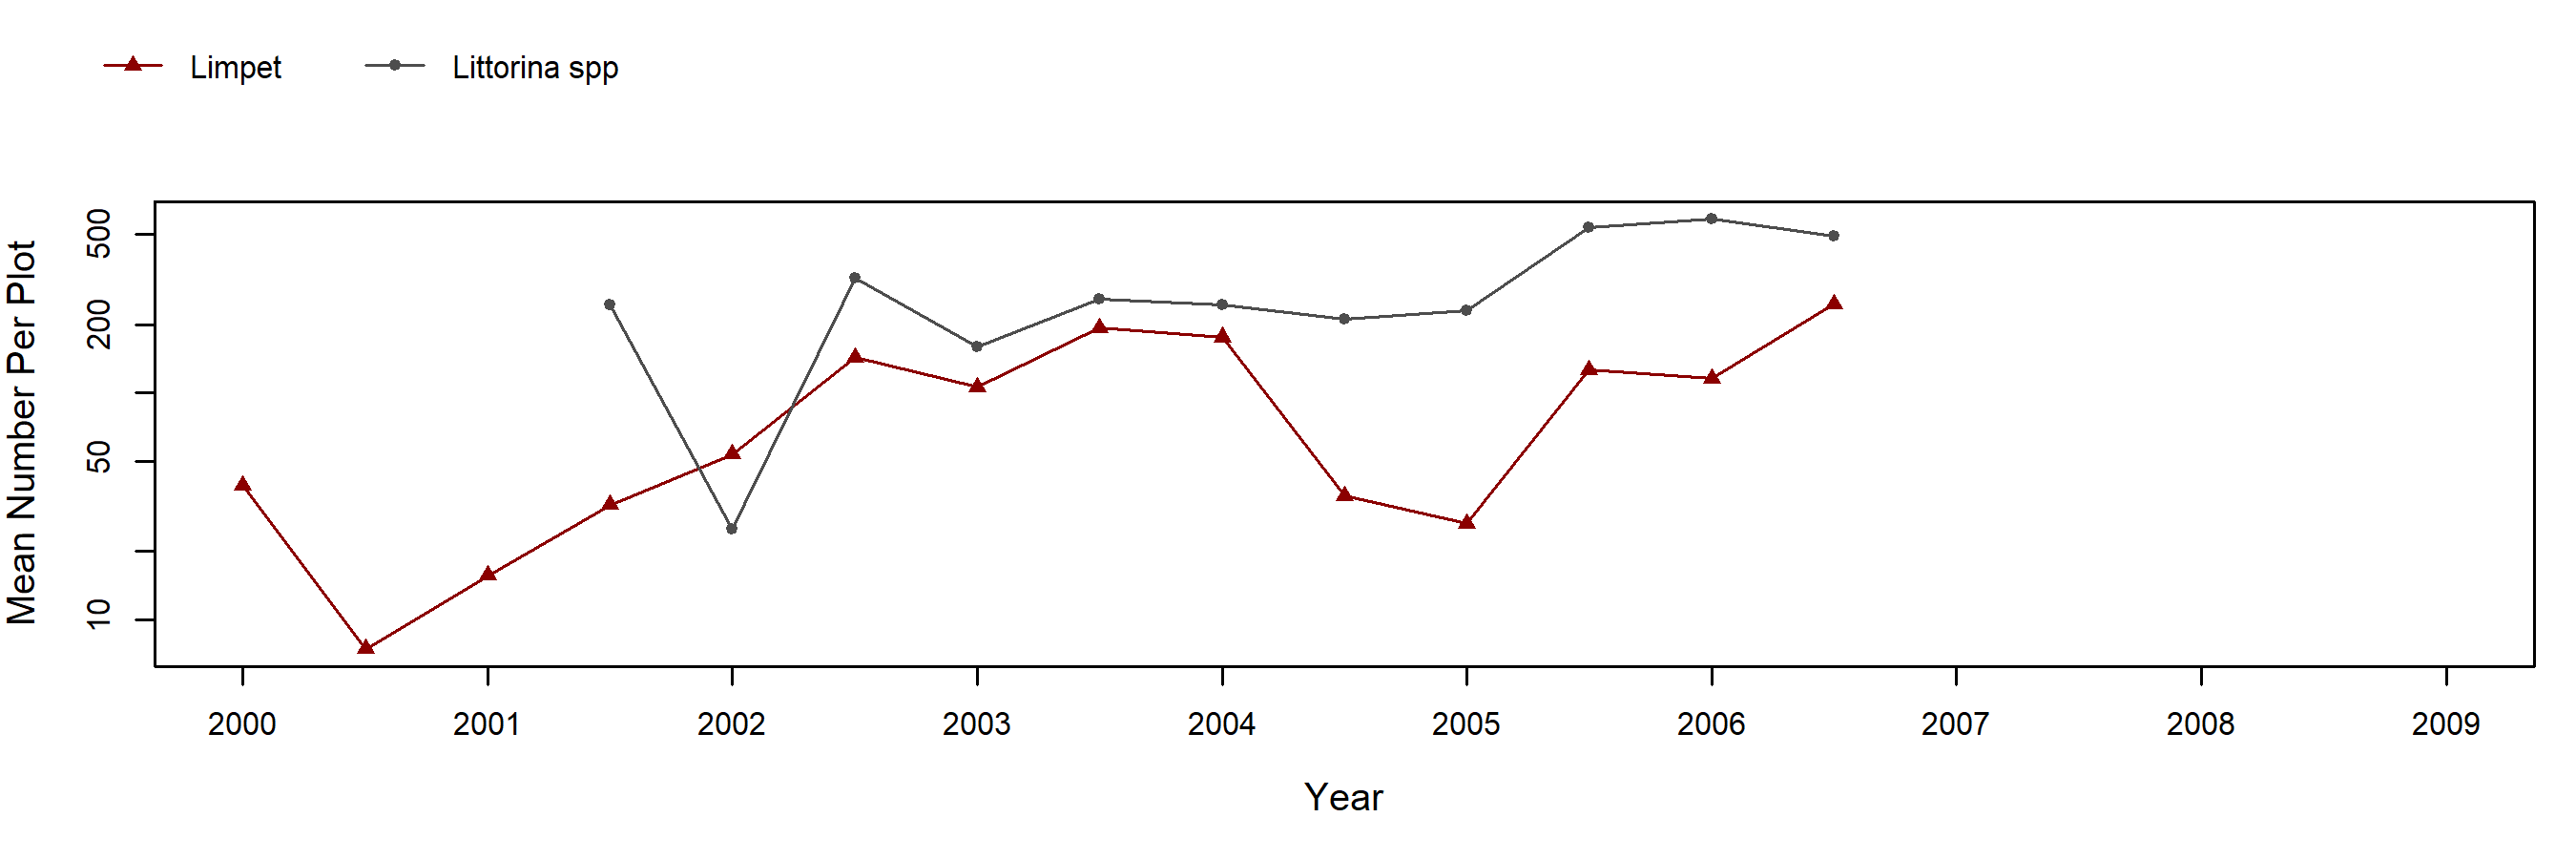
Chthamalus/Balanus (Acorn Barnacles) - motile invertebrate counts
Pollicipes (Goose Barnacle)
Mytilus (California Mussel) - percent cover
Mytilus (California Mussel - motile invertebrate counts)
Silvetia (Golden Rockweed) - percent cover
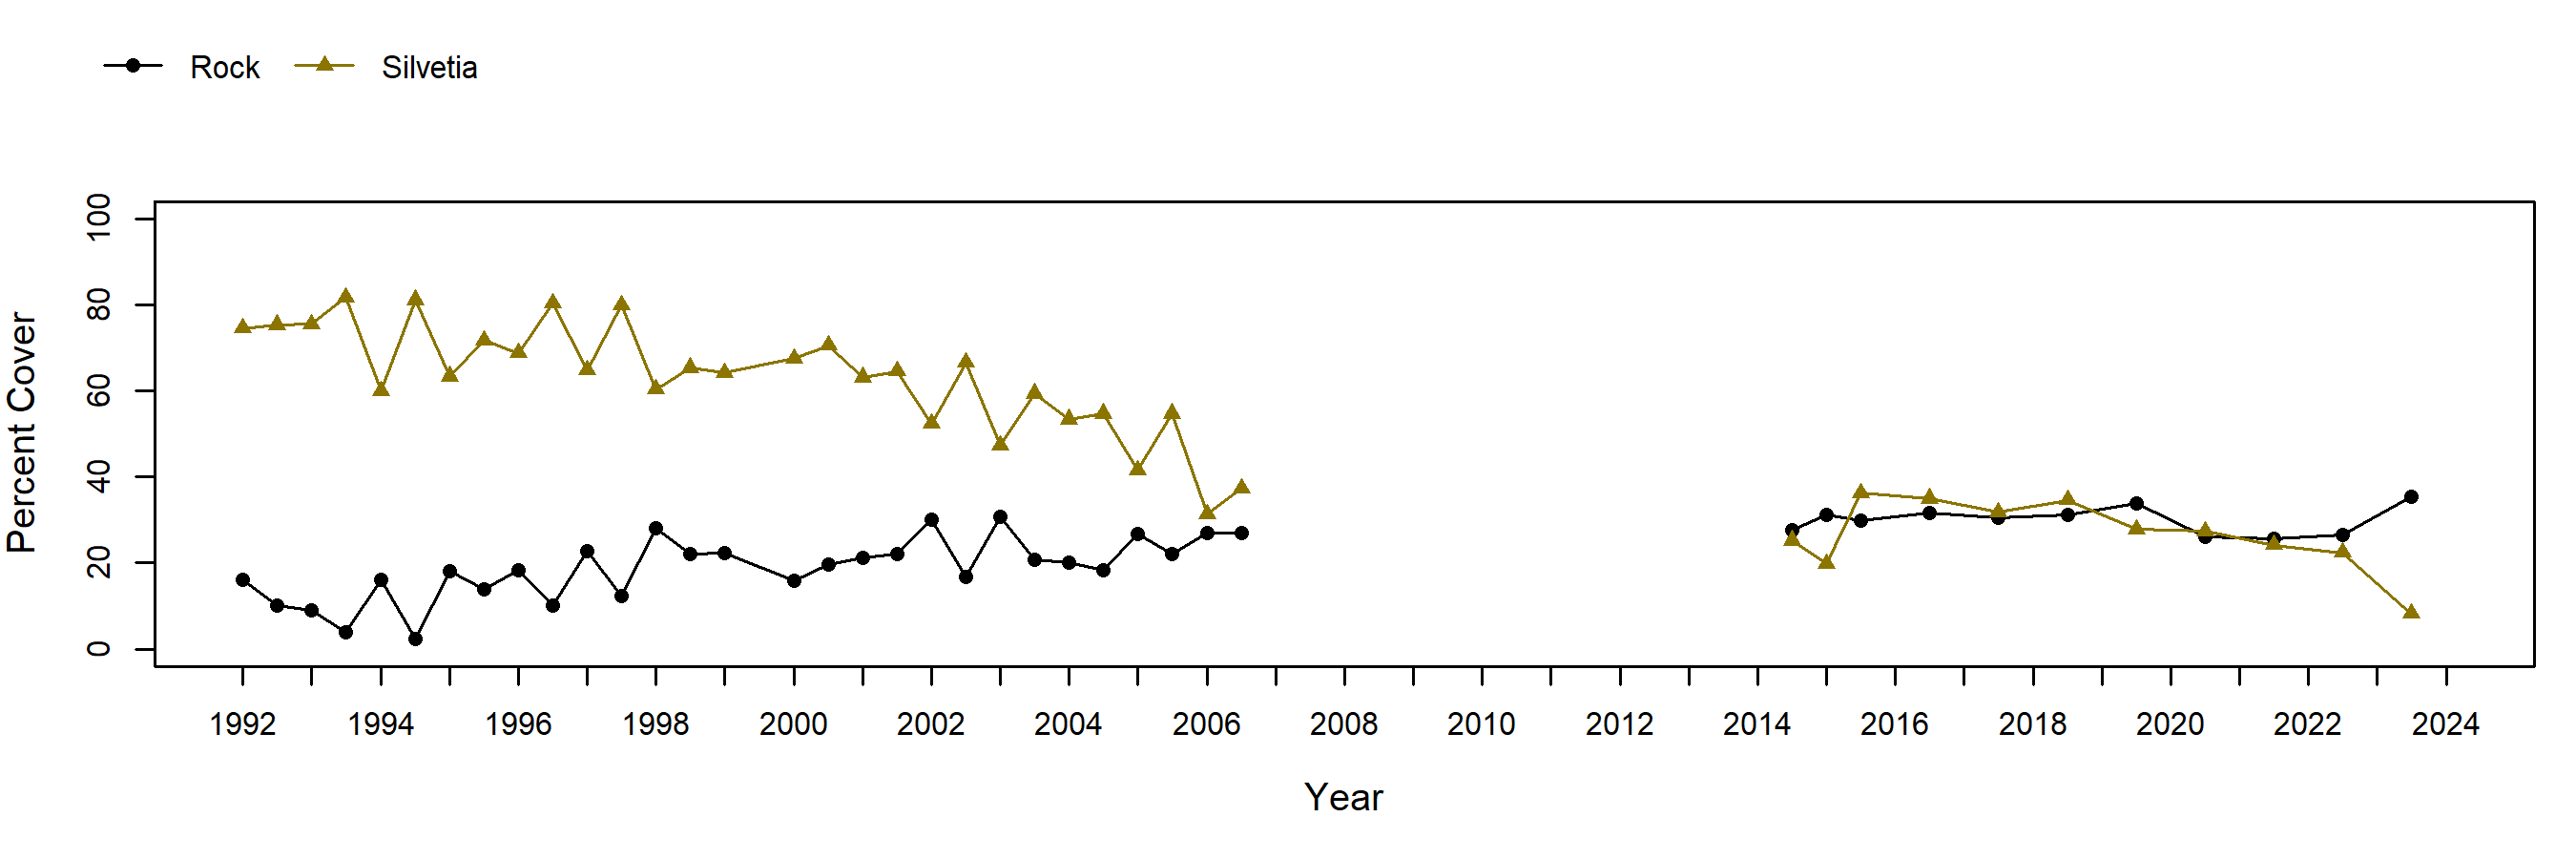
Silvetia (Golden Rockweed) - motile invertebrate counts
Endocladia (Turfweed) - percent cover
Endocladia (Turfweed) - motile invertebrate counts
Transects
Below are the trends observed for each Transect target species at this site. Long-Term trend graphs also include any species that reached a minimum of 25% cover during any single point in time within a given target species assemblage. Breaks in trend lines represent missed sampling events.
Phyllospadix (Surfgrass)
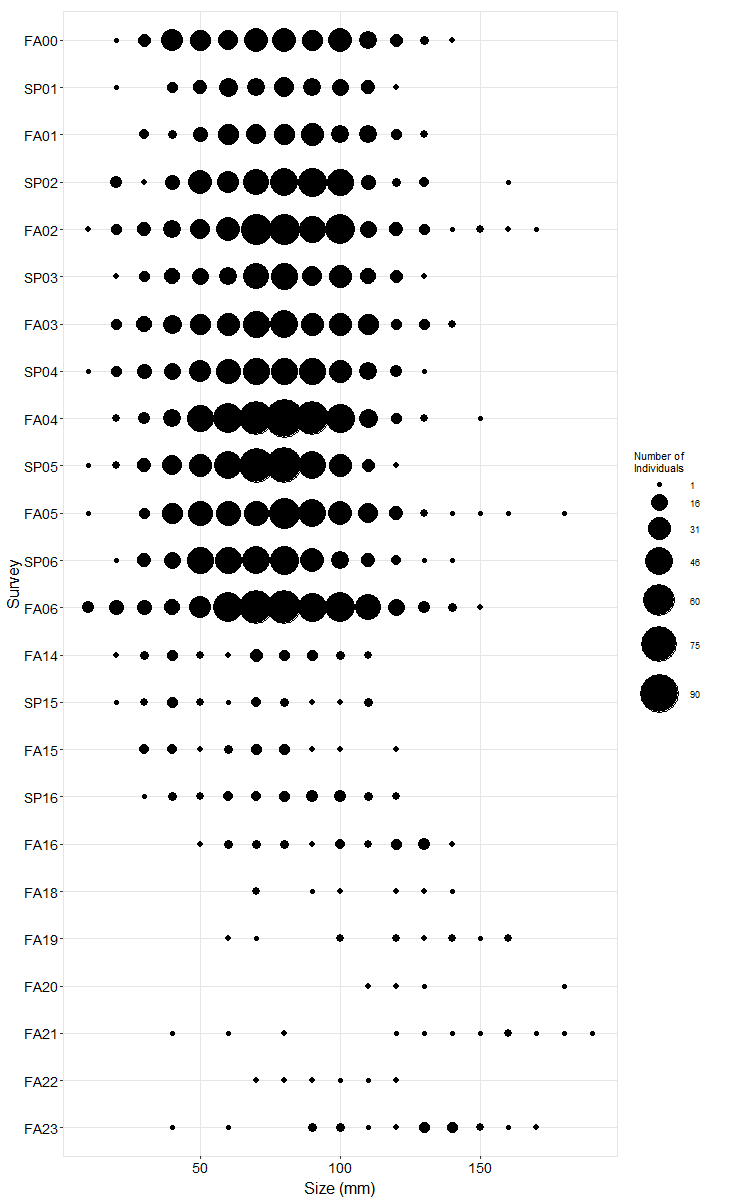
Species Counts and Sizes
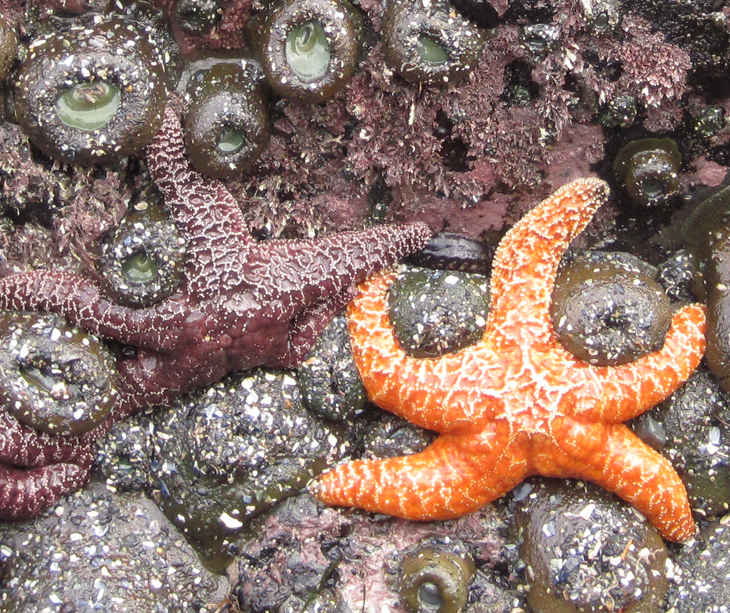
Species Counts and Sizes (where recorded) for Pisaster are shown below for this site. At some sites, other sea star species and Katharina are counted in addition to Pisaster. The sum of all individuals across all plots is displayed. Note that data gaps are represented by breaks in long-term count trend lines, but are not shown in size plots.
Pisaster ochraceus (Ochre Star) - counts
Pisaster ochraceus (Ochre Star) - sizes