
Hazards Long-Term trends | MARINe
Hazards Long-Term trends
See below for trend graphs
In order to standardize species resolution across all MARINe groups, and over time, some species (typically rare) were lumped for graphical presentation of Long-Term monitoring data. See lumped categories for definitions (some variation occurs between methods and over time). Due to funding constraints, semi-annual sampling of plots/transects was reduced to annual sampling beginning in 2016. In addition, counts of motile invertebrates within plots at most sites ended in 2014.
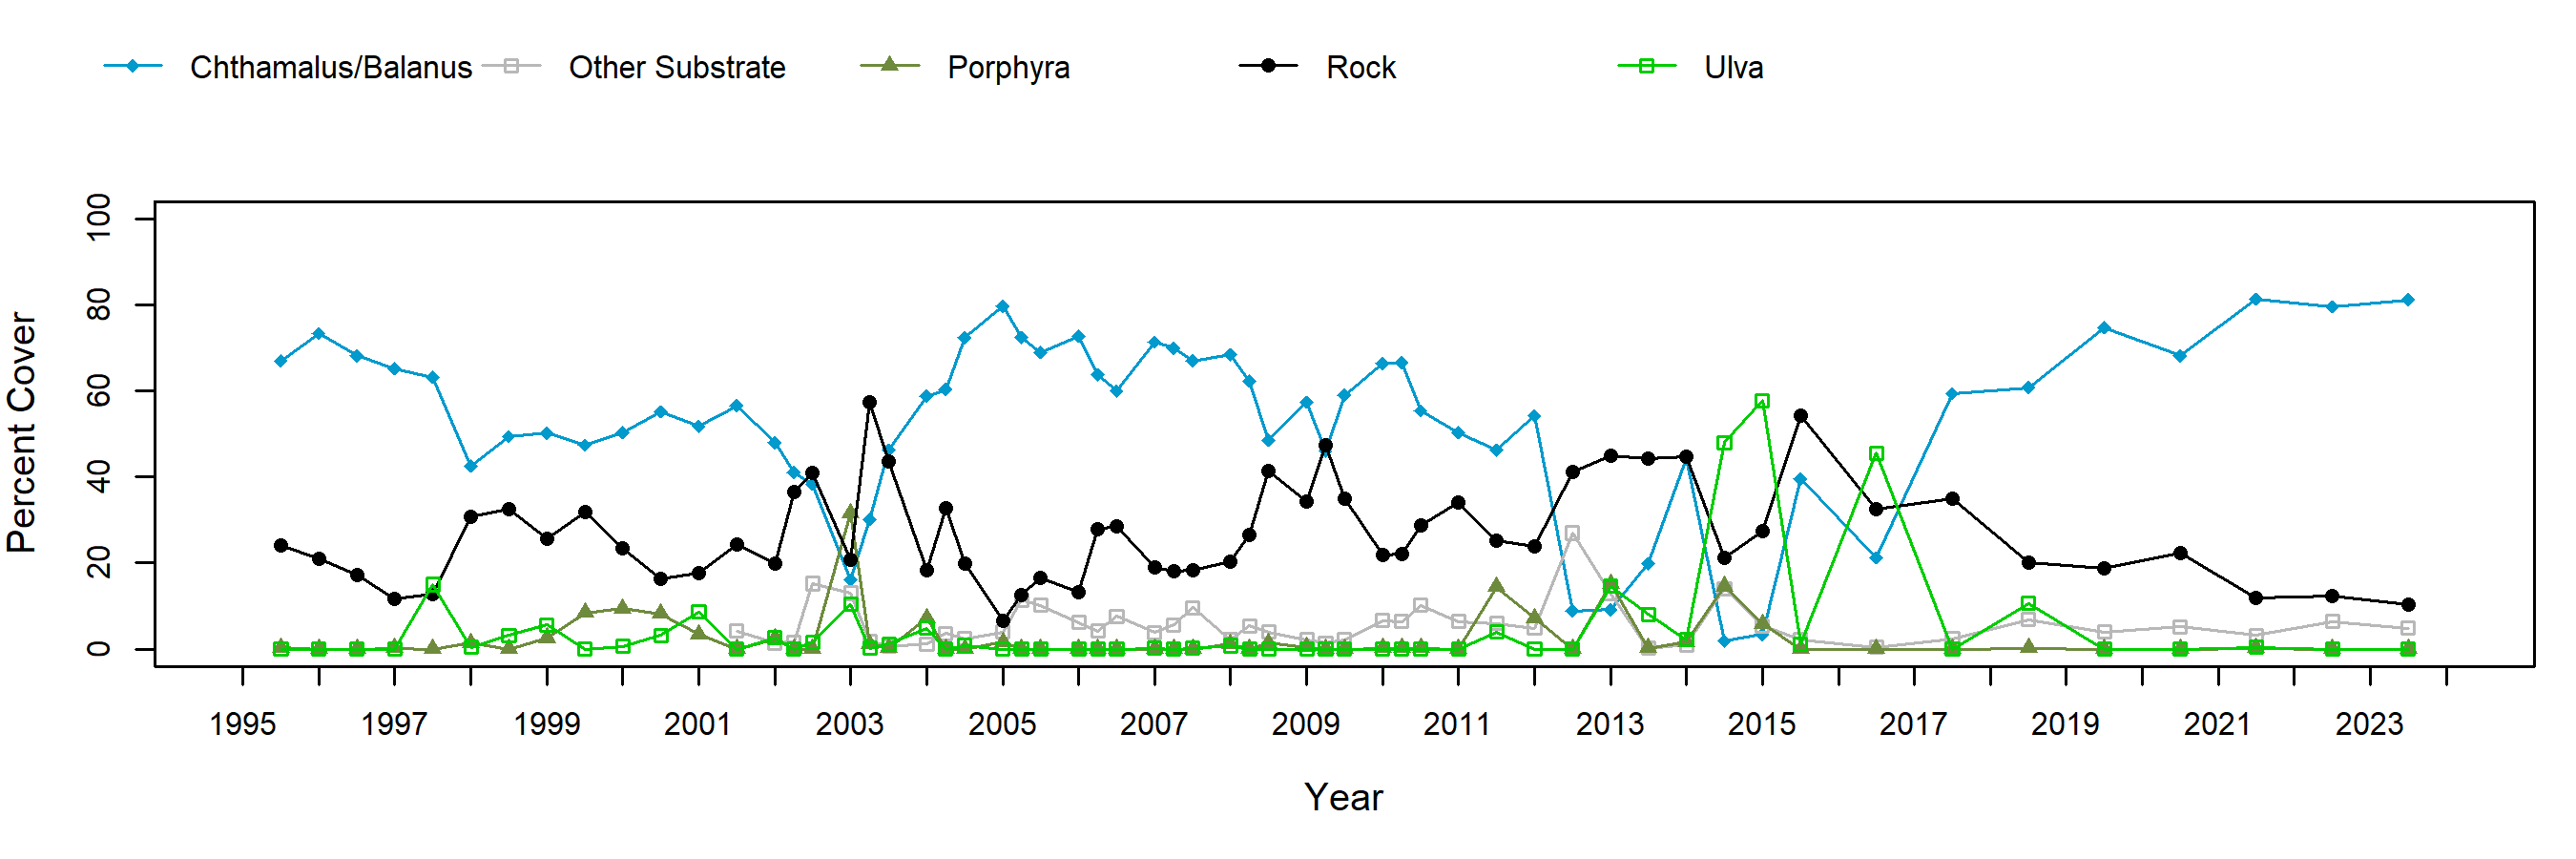
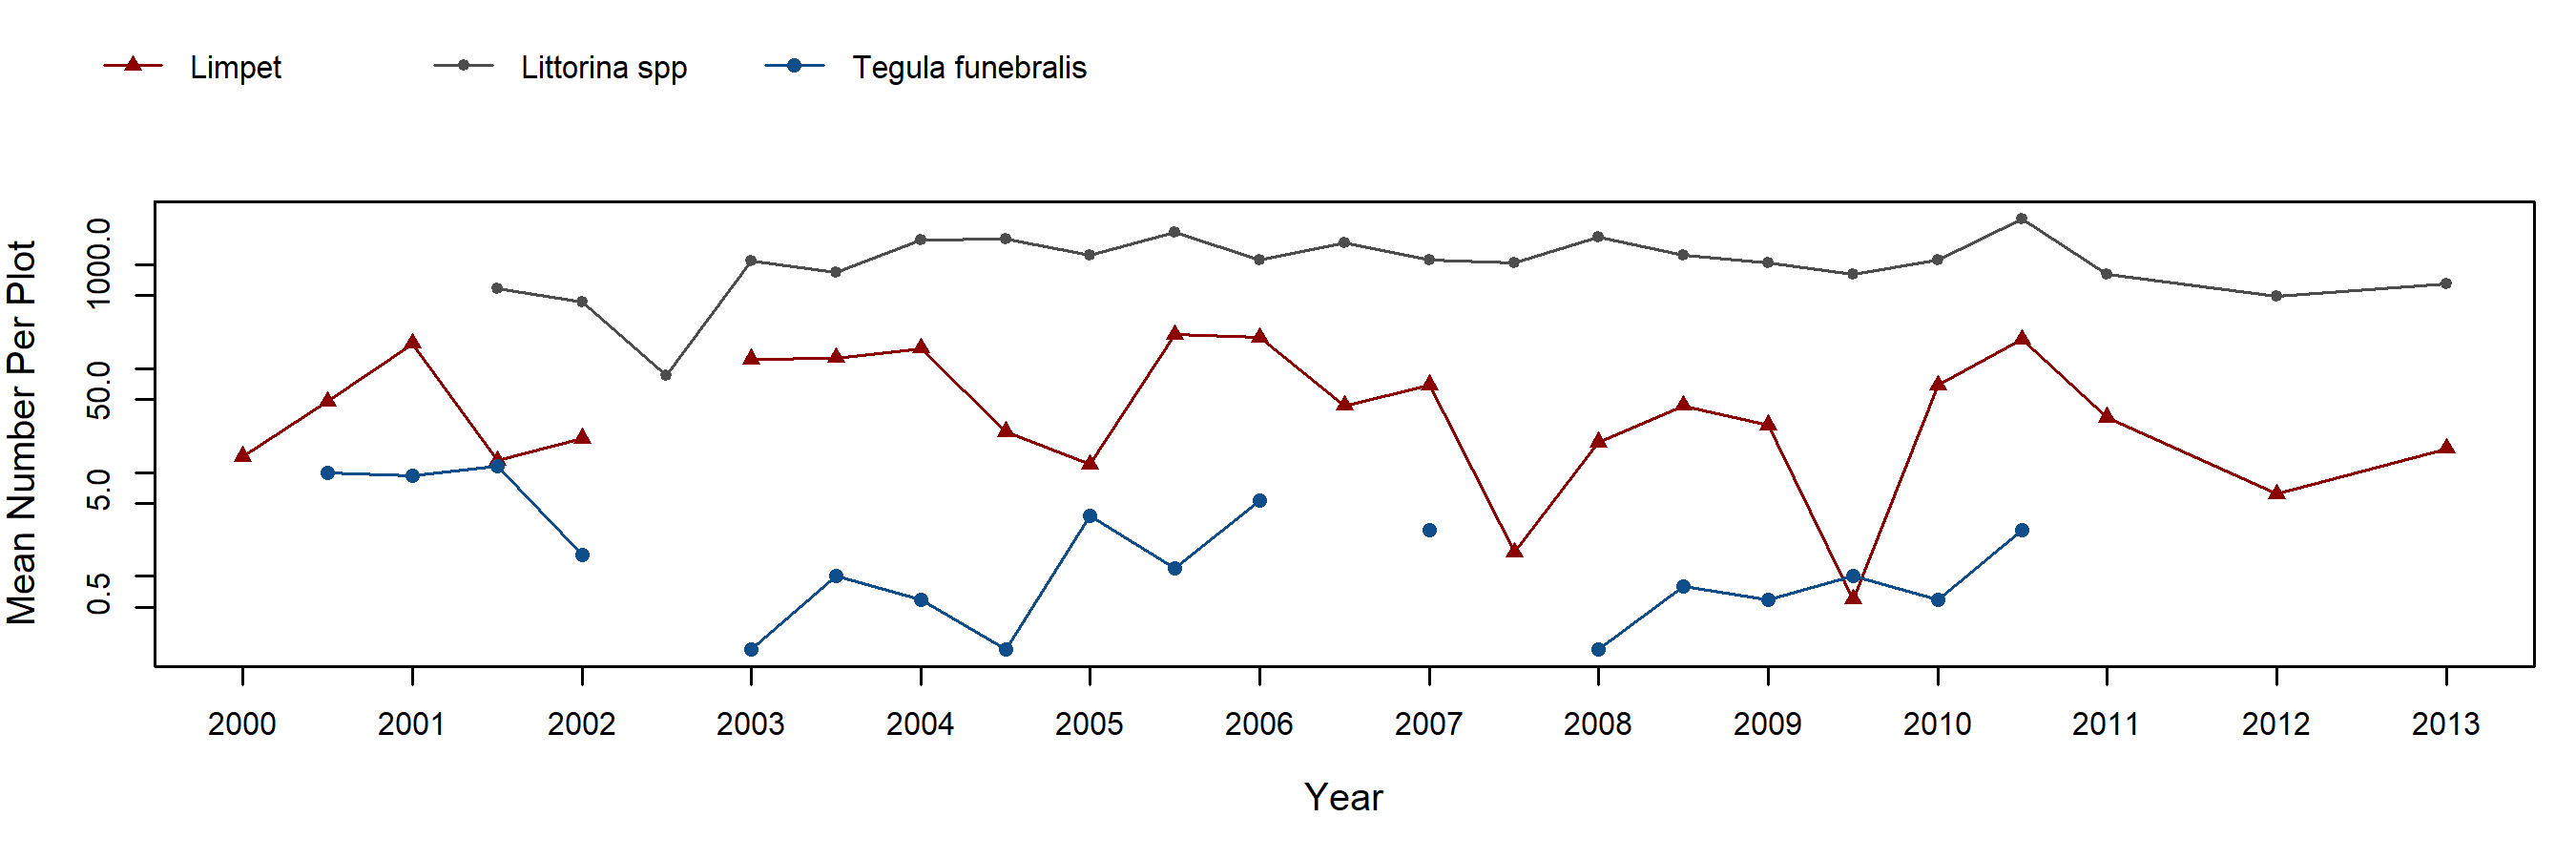
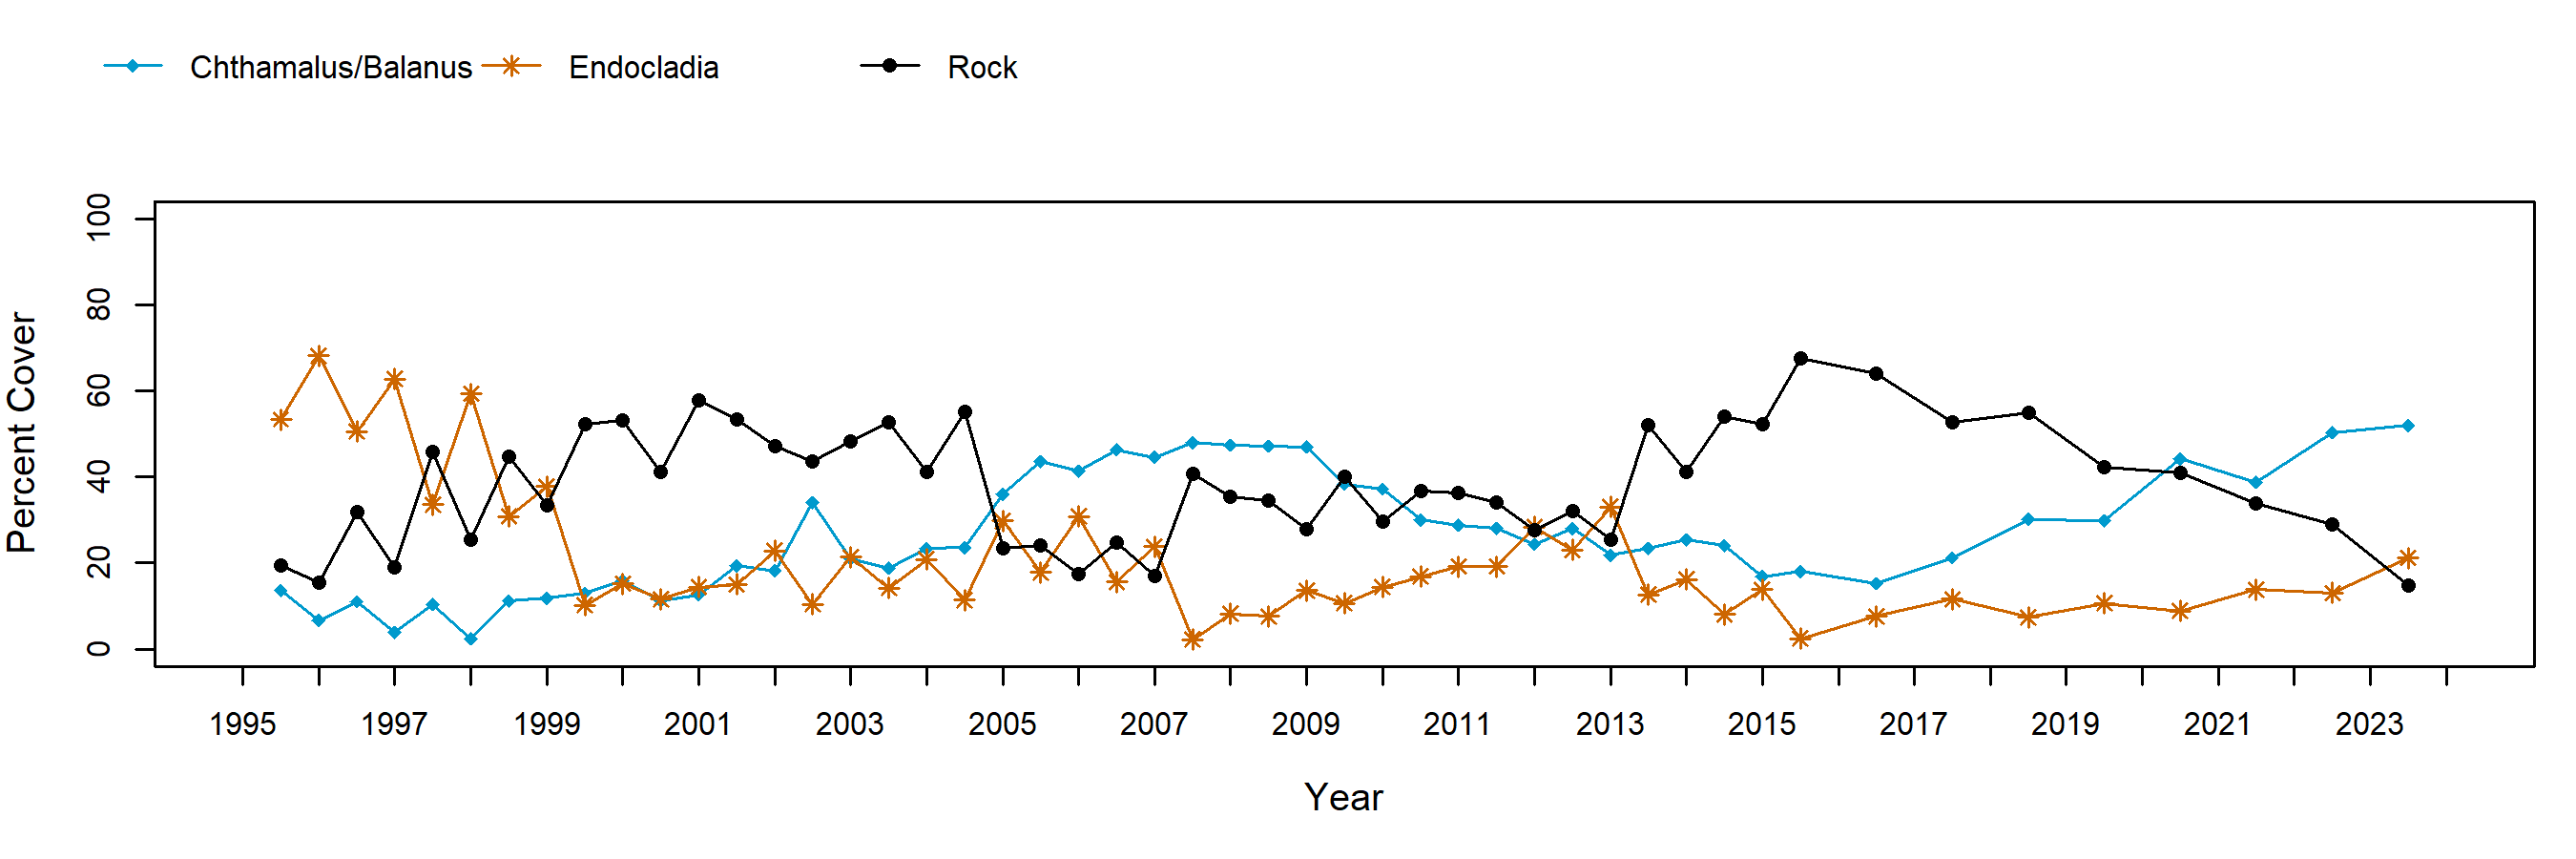
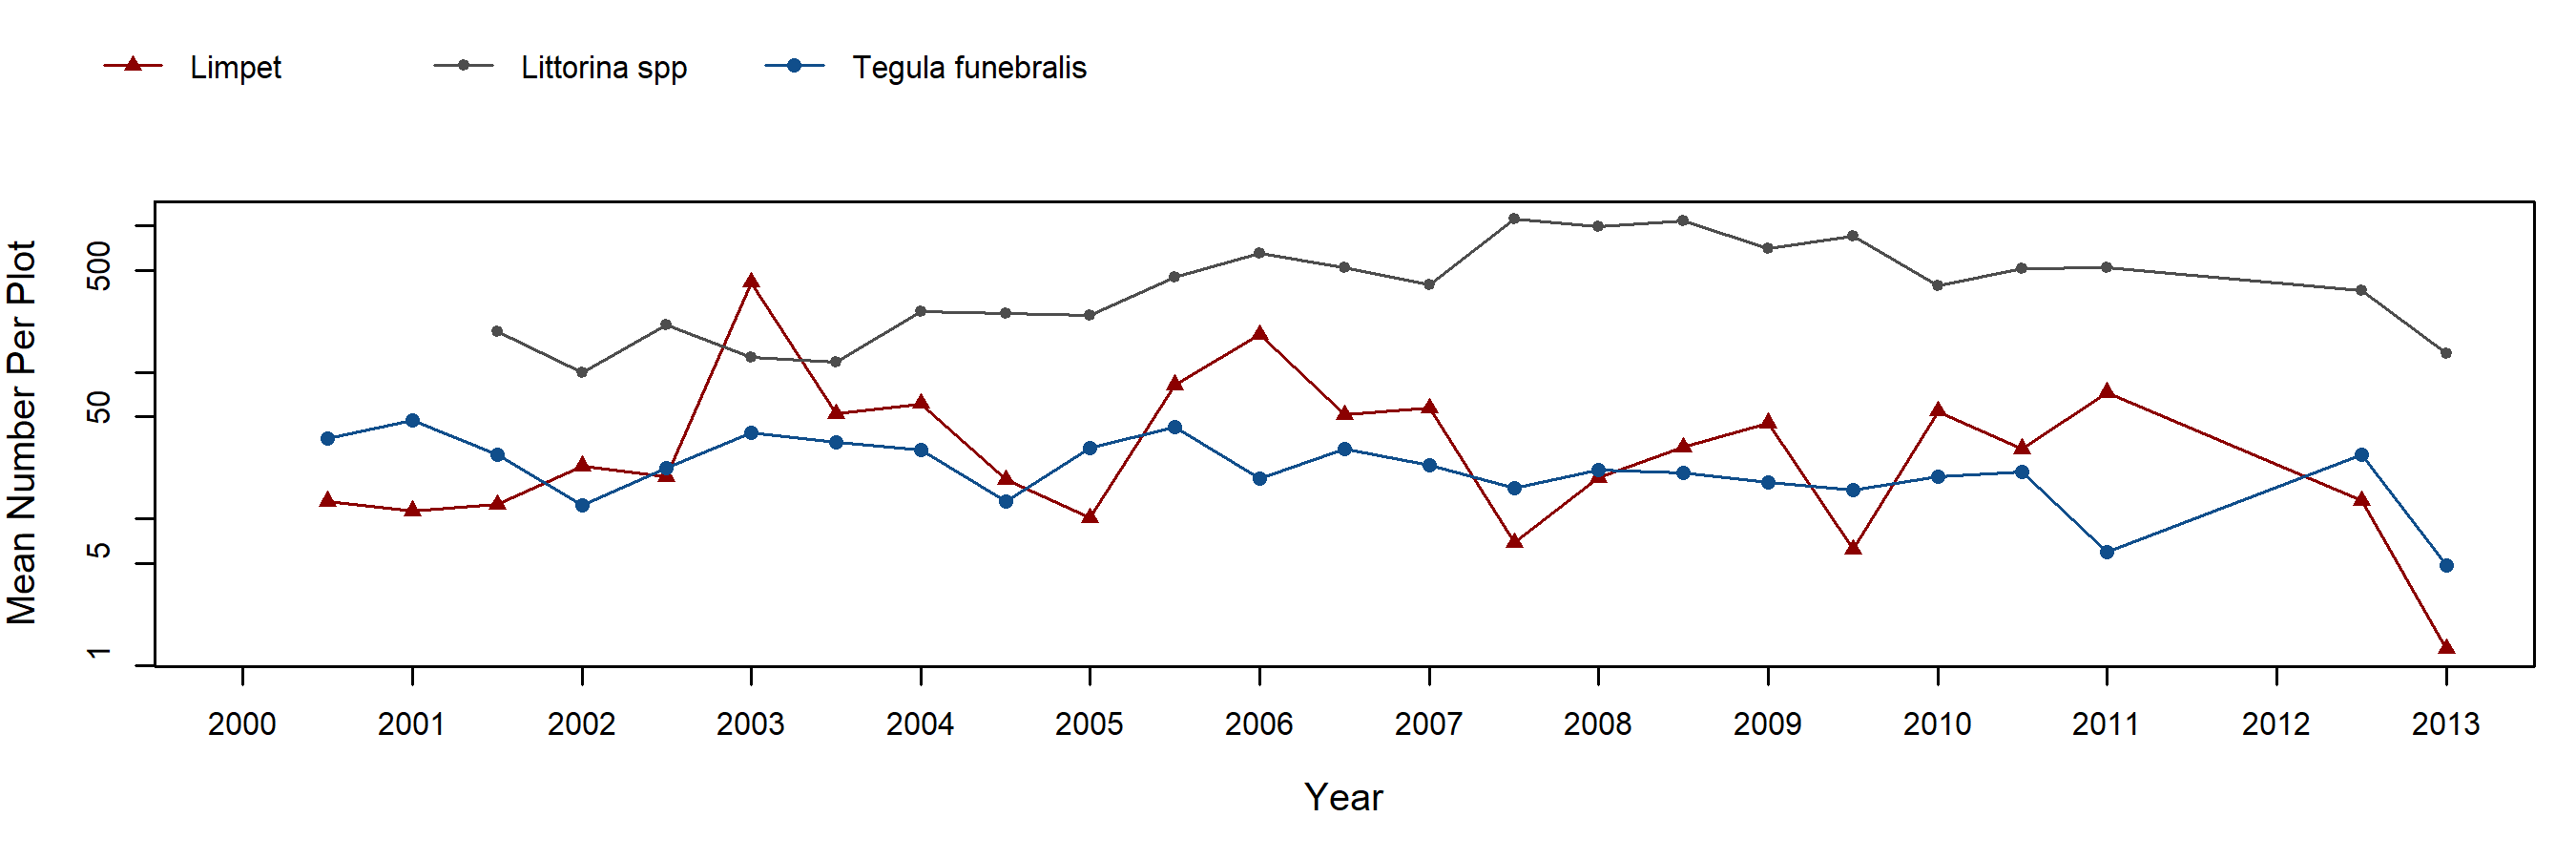
The barnacle plots at Hazards are located in an area heavily influenced by sand, and declines were often associated with scouring events. This was particularly true in spring 2003 and fall 2014, when opportunistic red and green algae, Porphyra and Ulva, colonized large patches of bare space recently cleared by sand scour. The 2014 scouring event nearly wiped out barnacles in these plots. A mixture of Chthamalus and Balanus was present in these plots. Littorines were typically present in very high numbers, often upwards of 1000 individuals per plot, while limpets tended to be an order of magnitude less common.
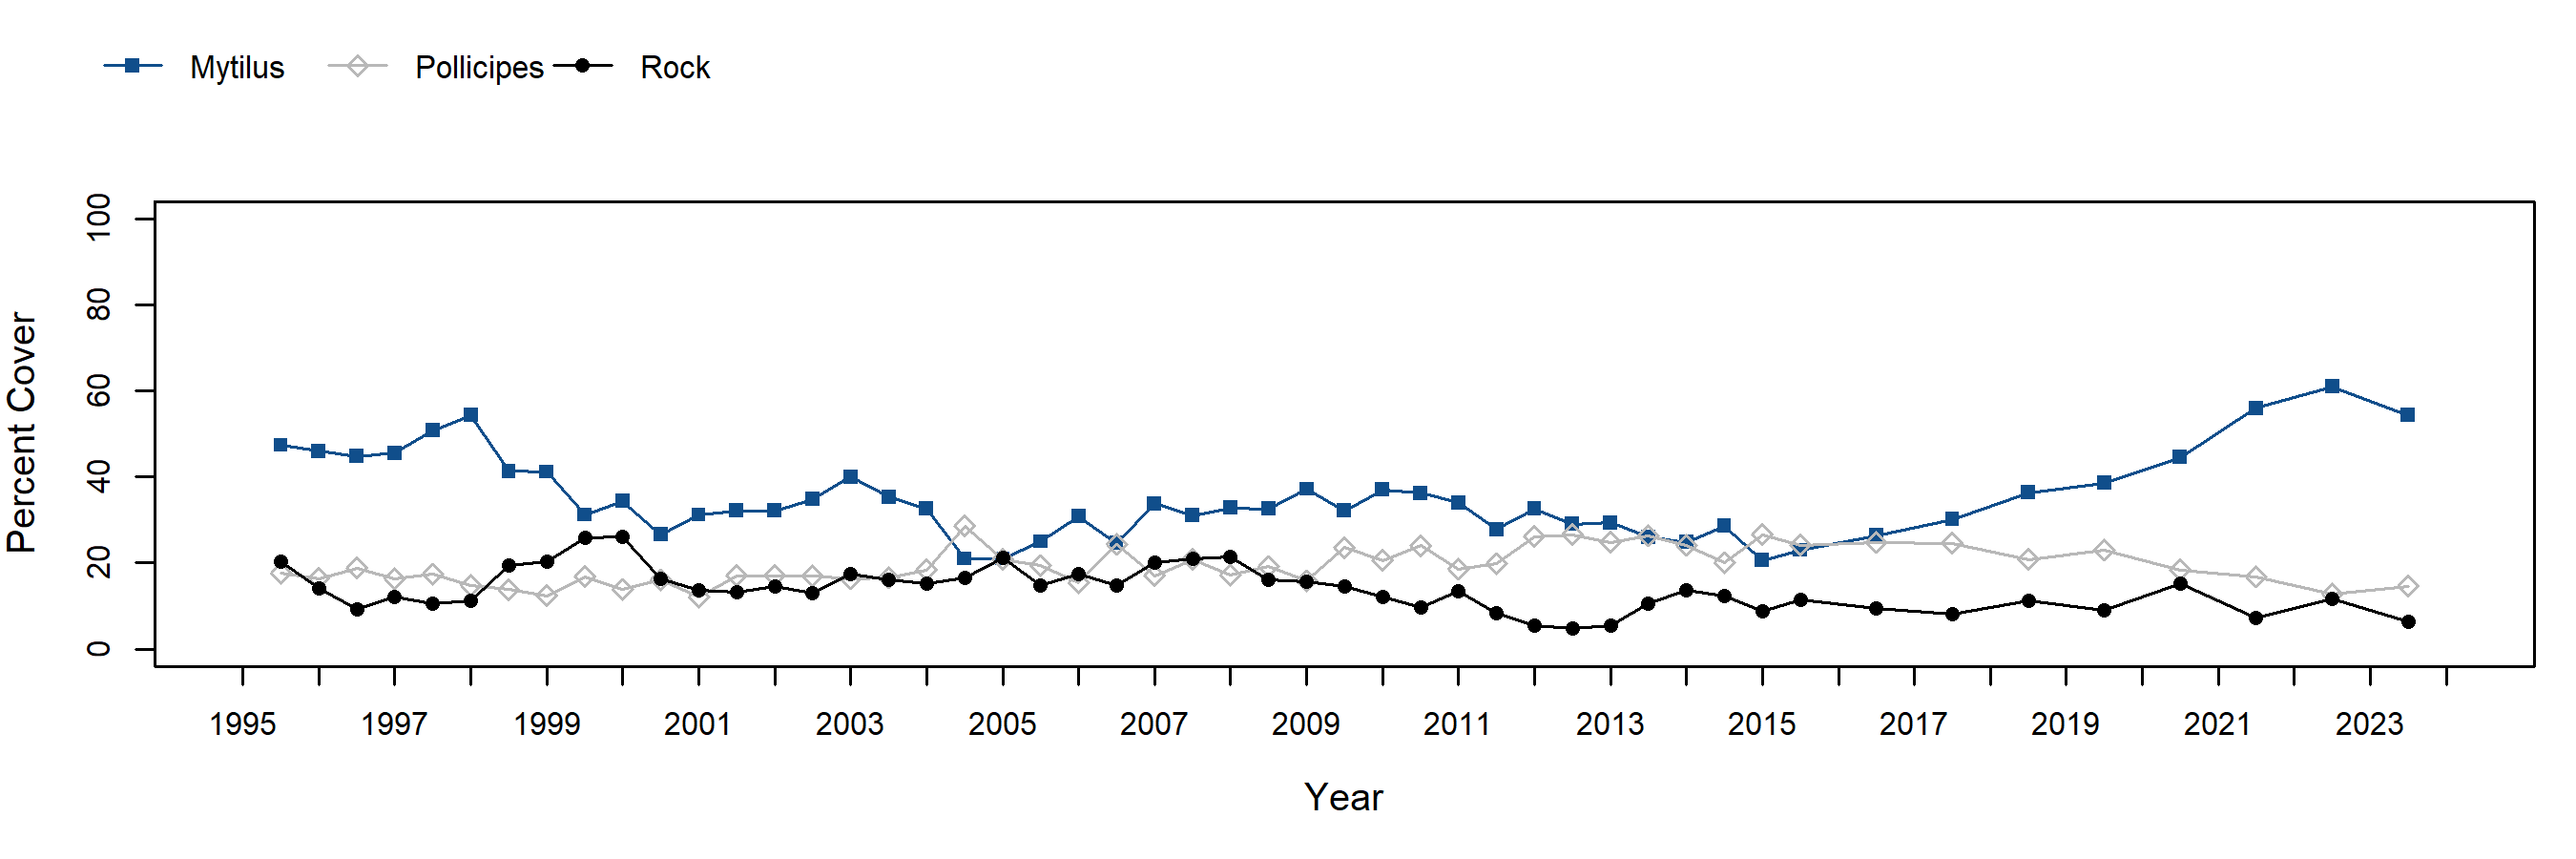
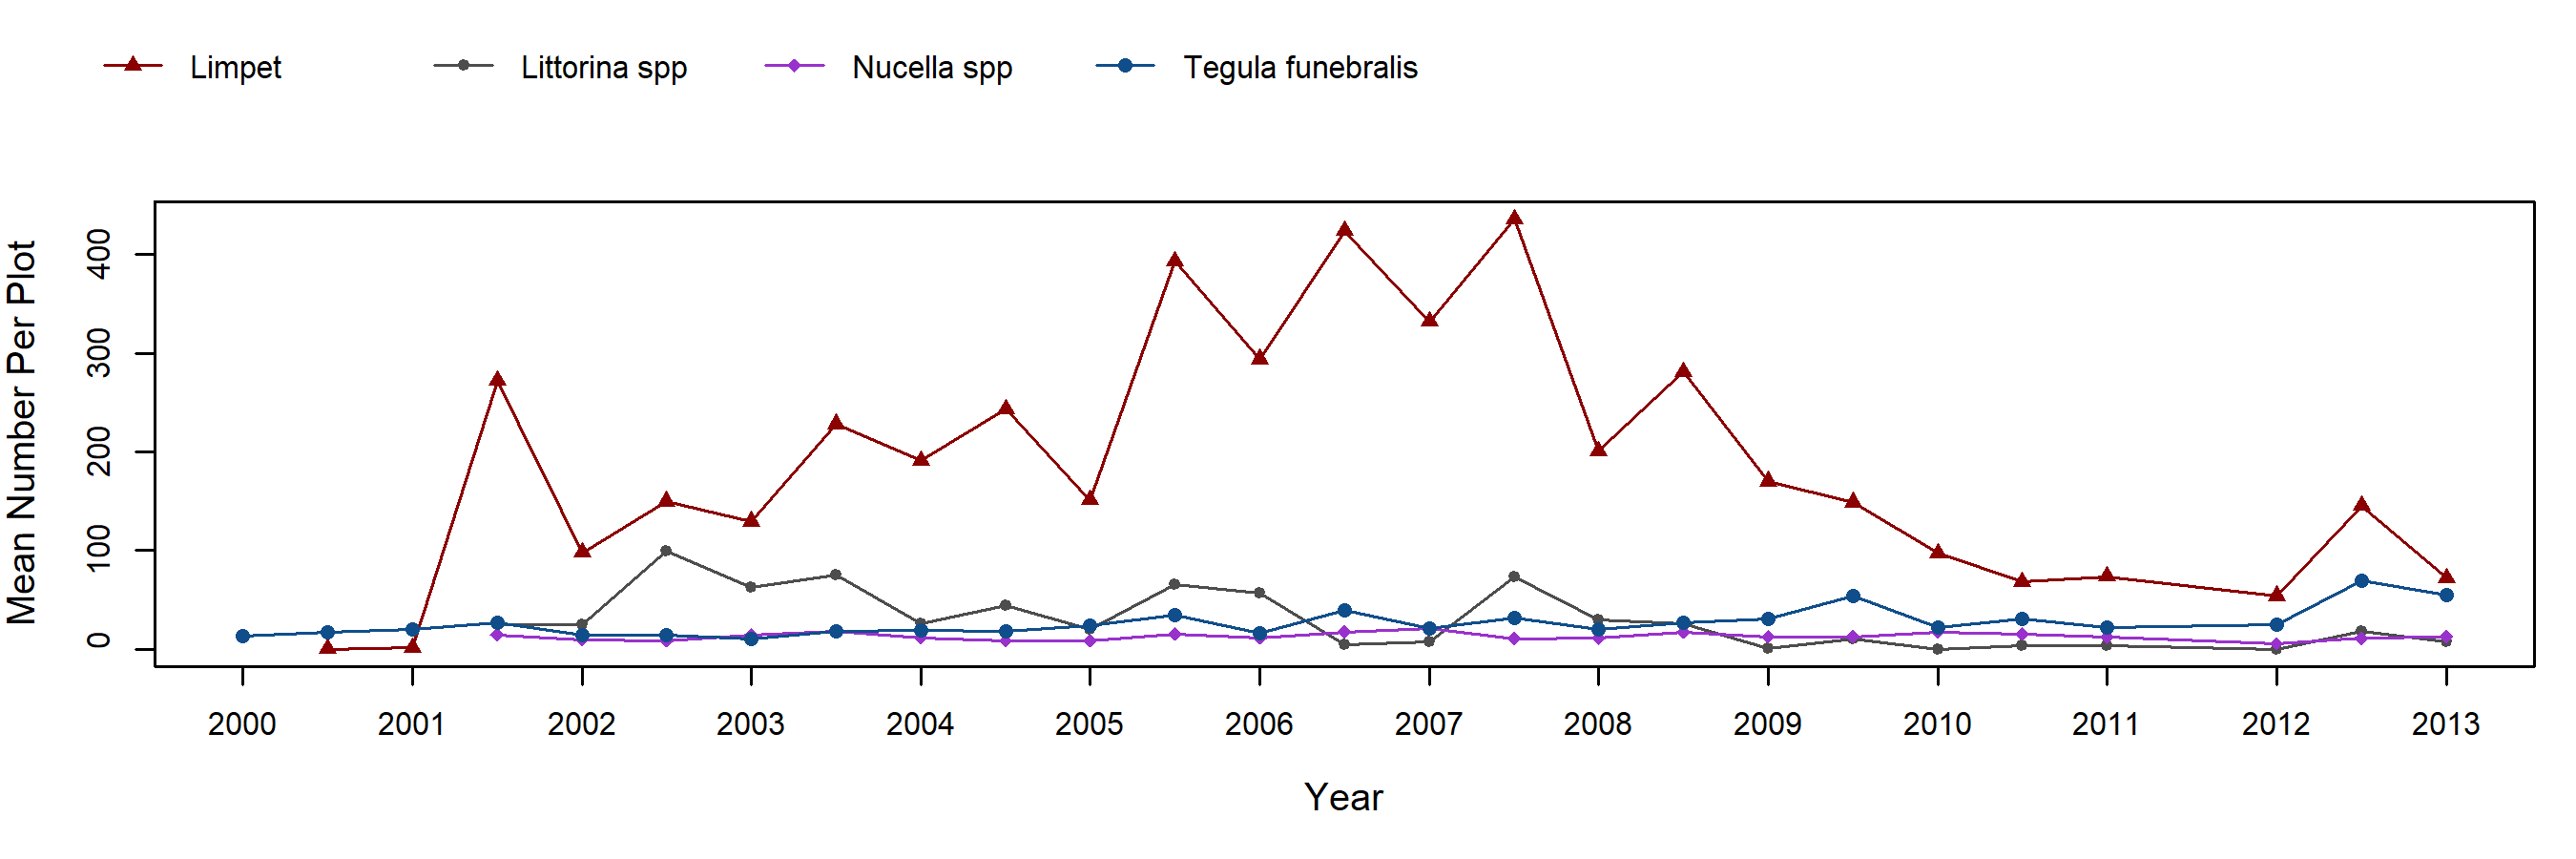
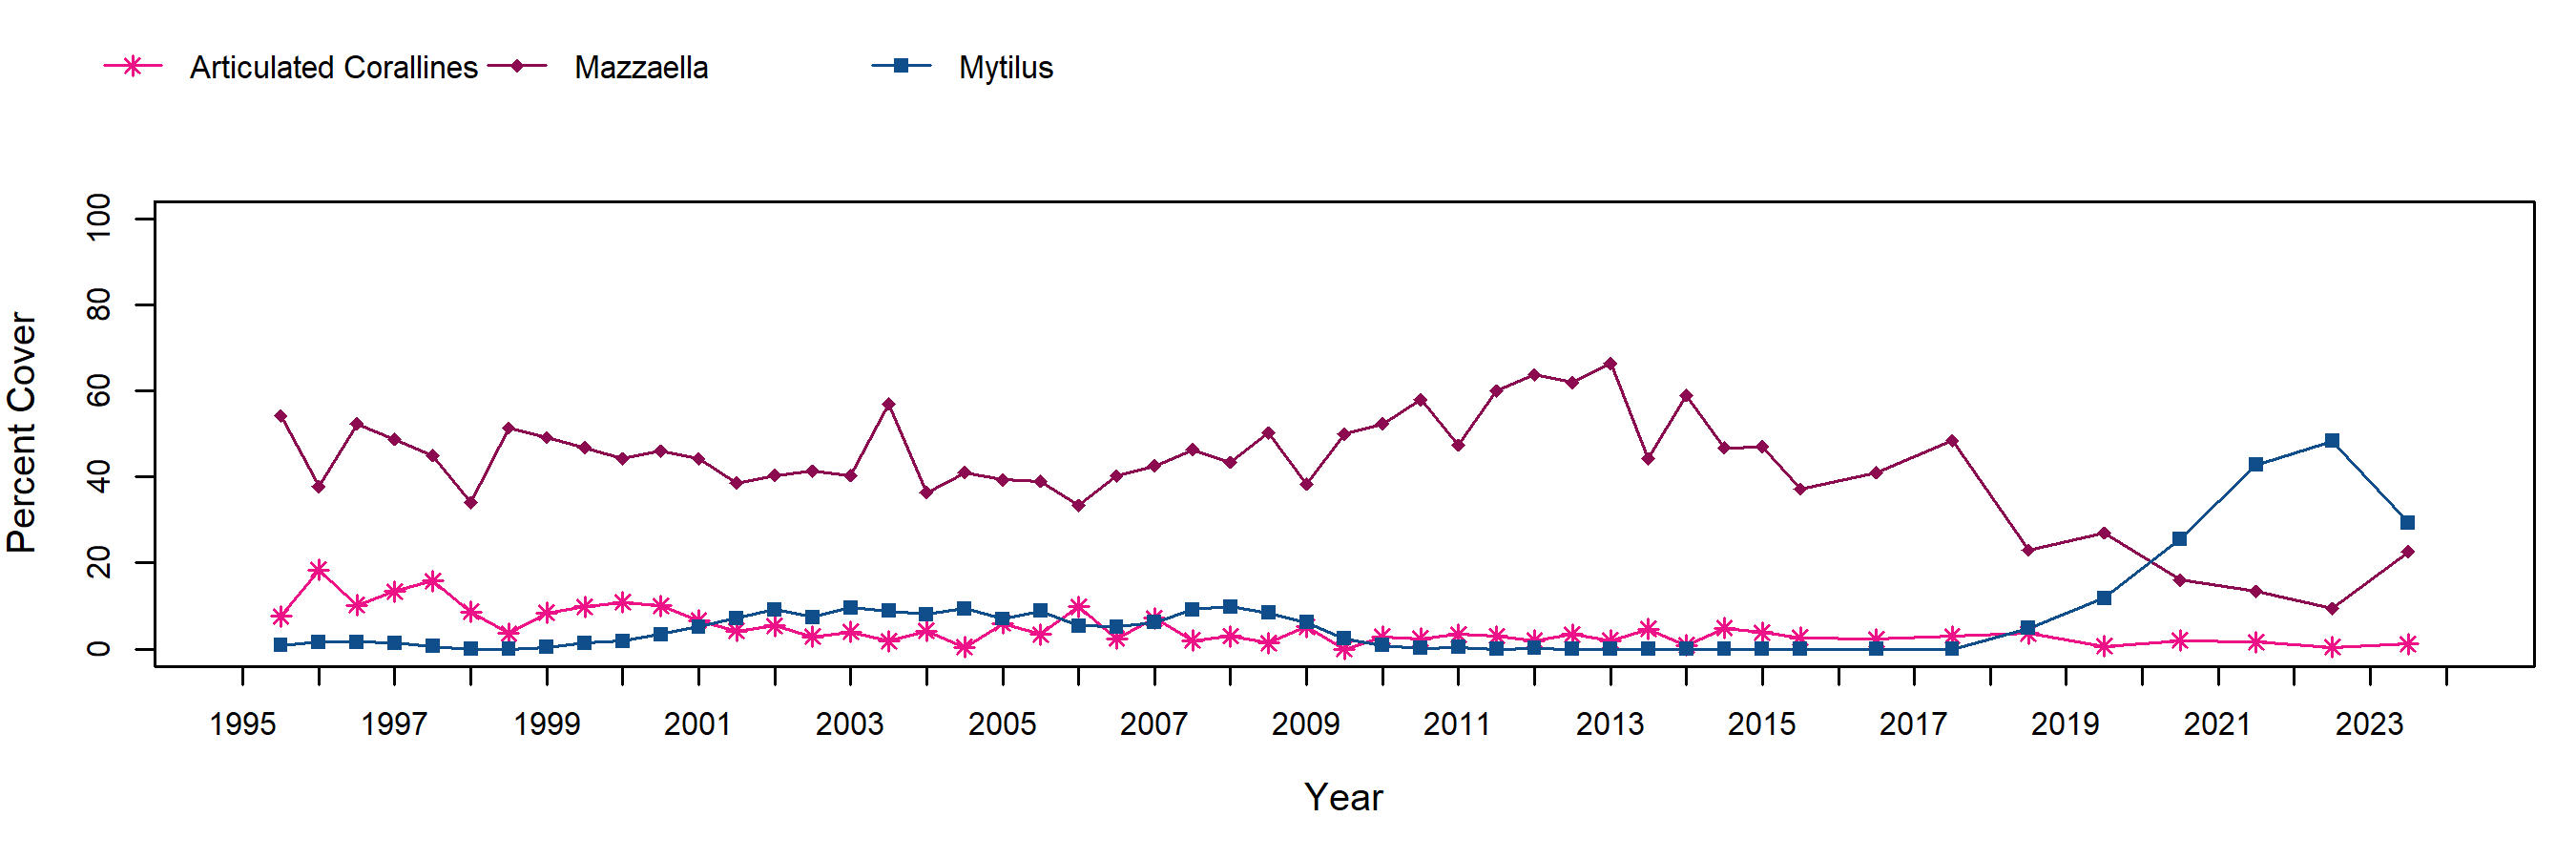
Initial mussel cover was somewhat low at Hazards (approximately 45%) because plots were established fairly high in the mussel zone to make sampling easier when large swells were present at the site. Denser mussel beds were present at Hazards, but were located on exposed outer reefs. An added benefit to placing the mussel plots higher in the intertidal is that Pollicipes cover was fairly high in the plots (almost 20%), so goose barnacles could be monitored along with the mussels. Both Mytilus and Pollicipes cover have been relatively stable at Hazards. Limpets were the most abundant motile invertebrate in the mussel plots and varied seasonally, with higher counts in fall than in spring. Tegula funebralis and Nucella spp. (mostly N. emarginata/ostrina) were also common.
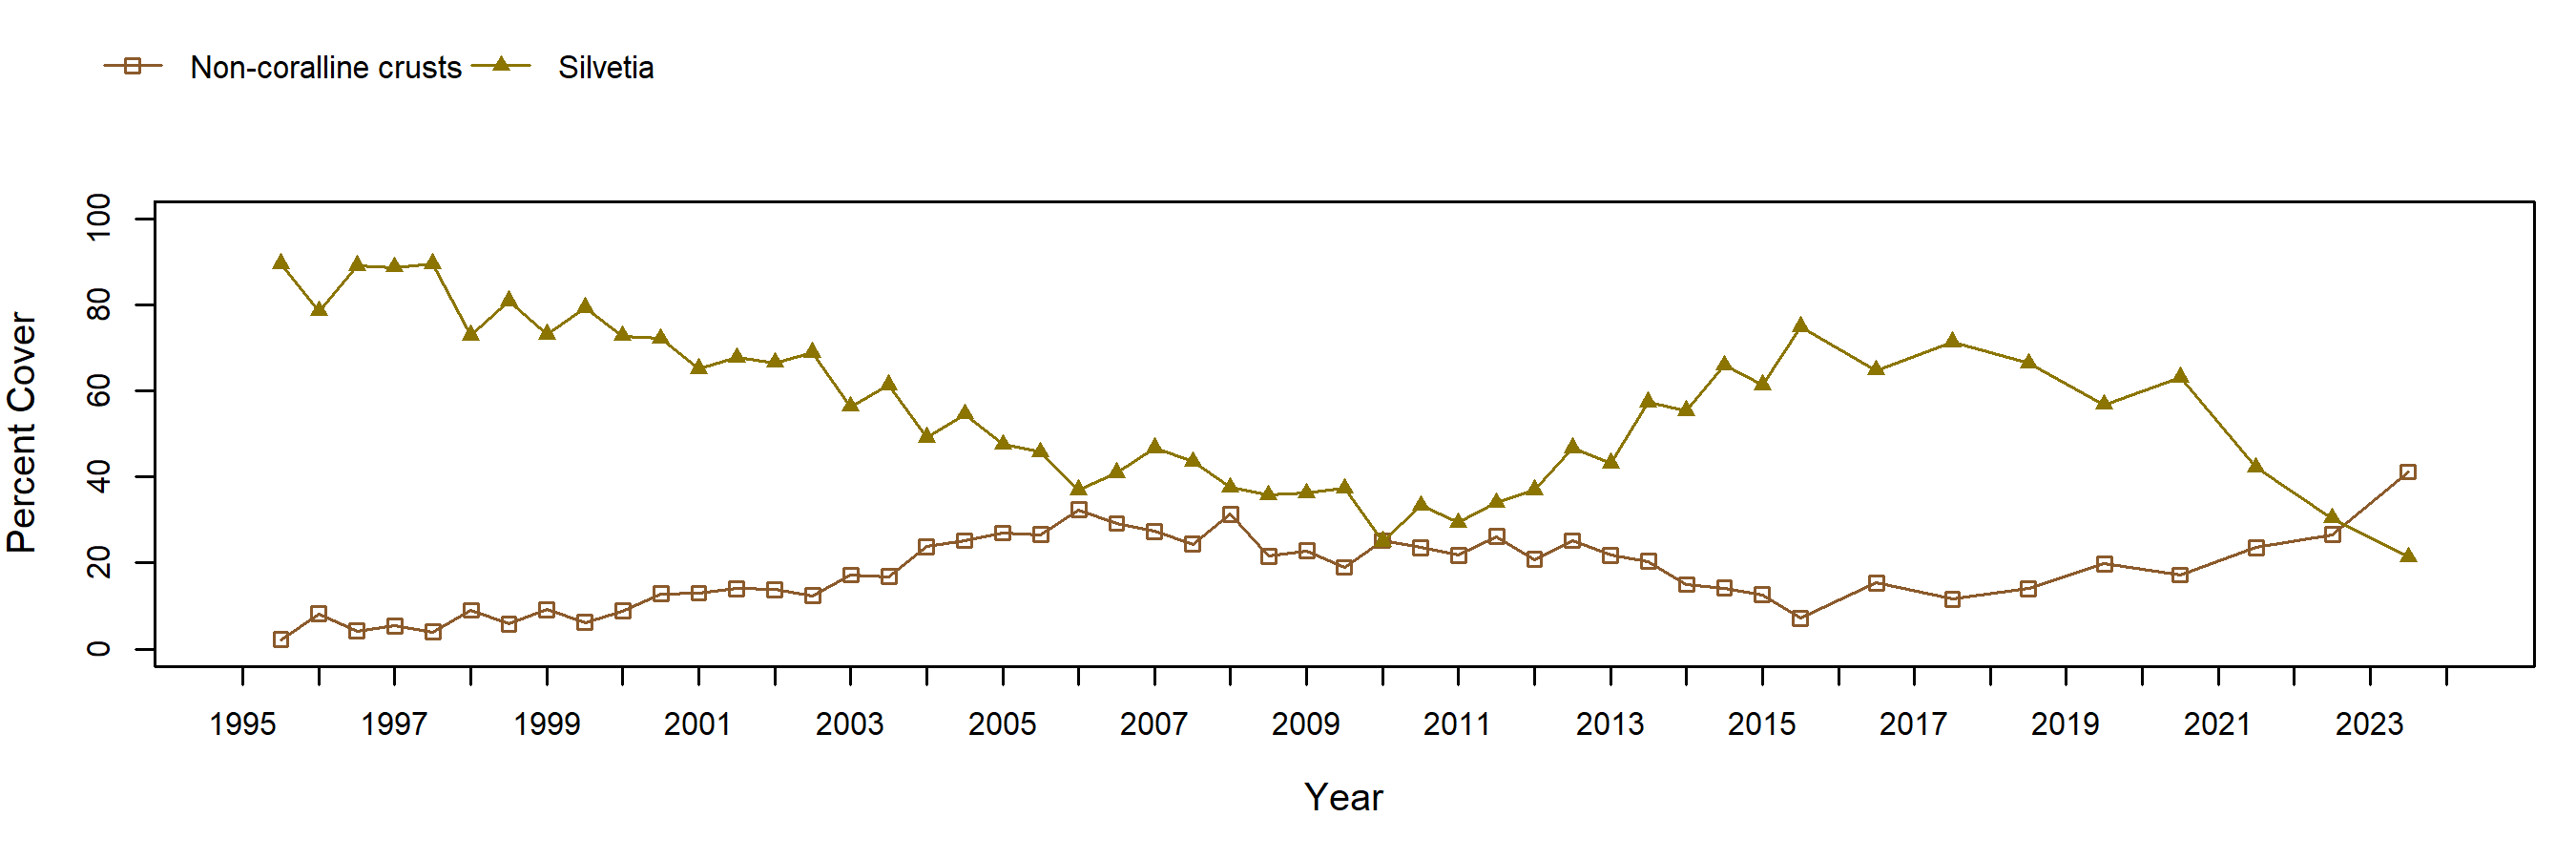
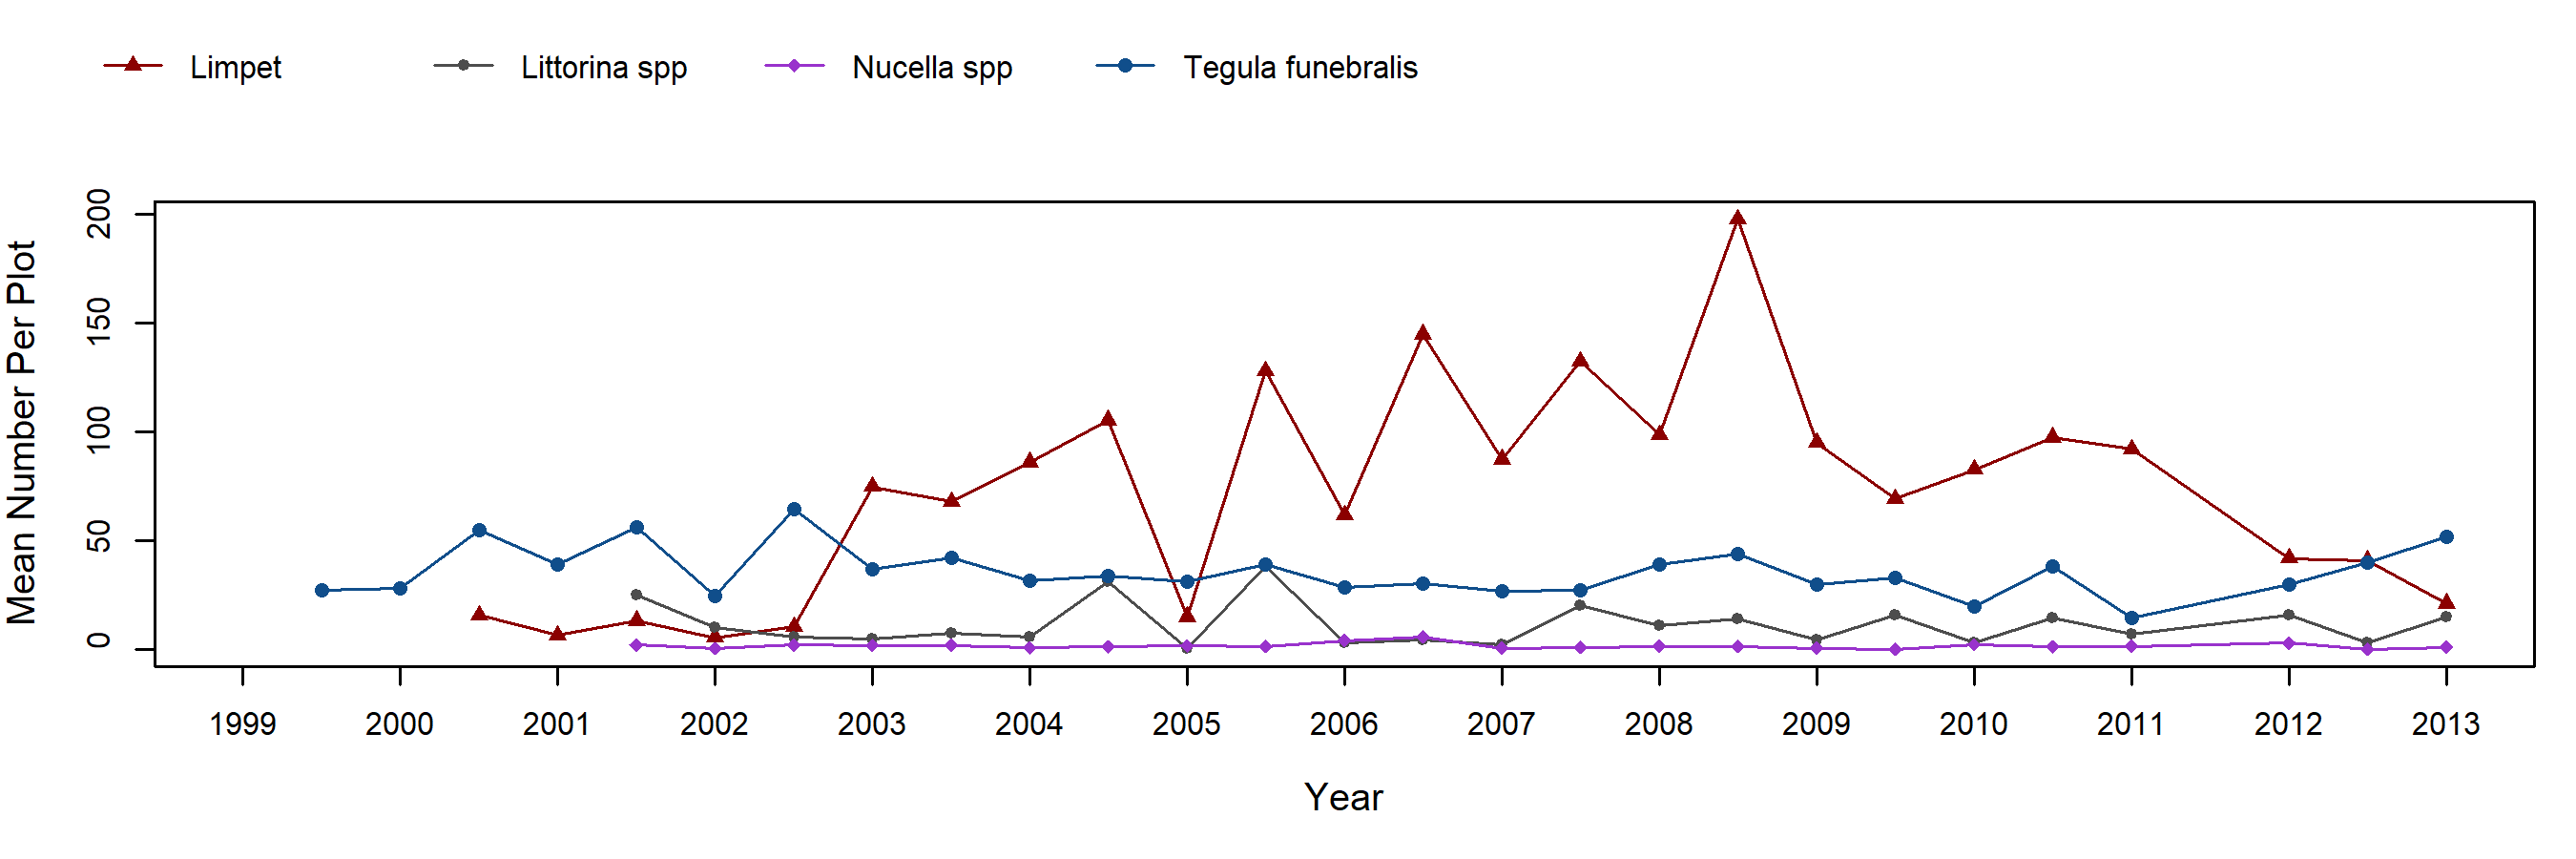
Silvetia declined gradually between 1995-2010, but then steadily recovered and now hovers around 70%. Declines in Silvetia cover were accompanied by increased numbers of limpets, likely due to the additional “open” space (crustose algae covered rock) available for grazing. The turban snail, Tegula funebralis is also common in the Silvetia plots at Hazards.
Endocladia declined during the first few years that it was monitored at Hazards, but has hovered around 10-20% cover since this initial decline. As with many other sites, turfweed cover fluctuated seasonally, with higher cover in spring than in fall. The open space resulting from the reduced cover of Endocladia has been colonized by barnacles, which gradually increased in cover until 2009, then declined somewhat and stabilized around 30% cover. Littorines are the most abundant motile invertebrate present in the Endocladia plots. Tegula funebralis and limpets are also common.
Mean cover of Mazzaella remained relatively constant over time at Hazards, until field sampling ended in 2015. Plots are still photographed and could be scored in the lab if needed. Unlike Pt. Sierra Nevada, the only other site where Mazzaella is targeted, there was no apparent seasonal variation in cover. “Other Red Algae” consisted mainly of Chondracanthus canaliculatus.
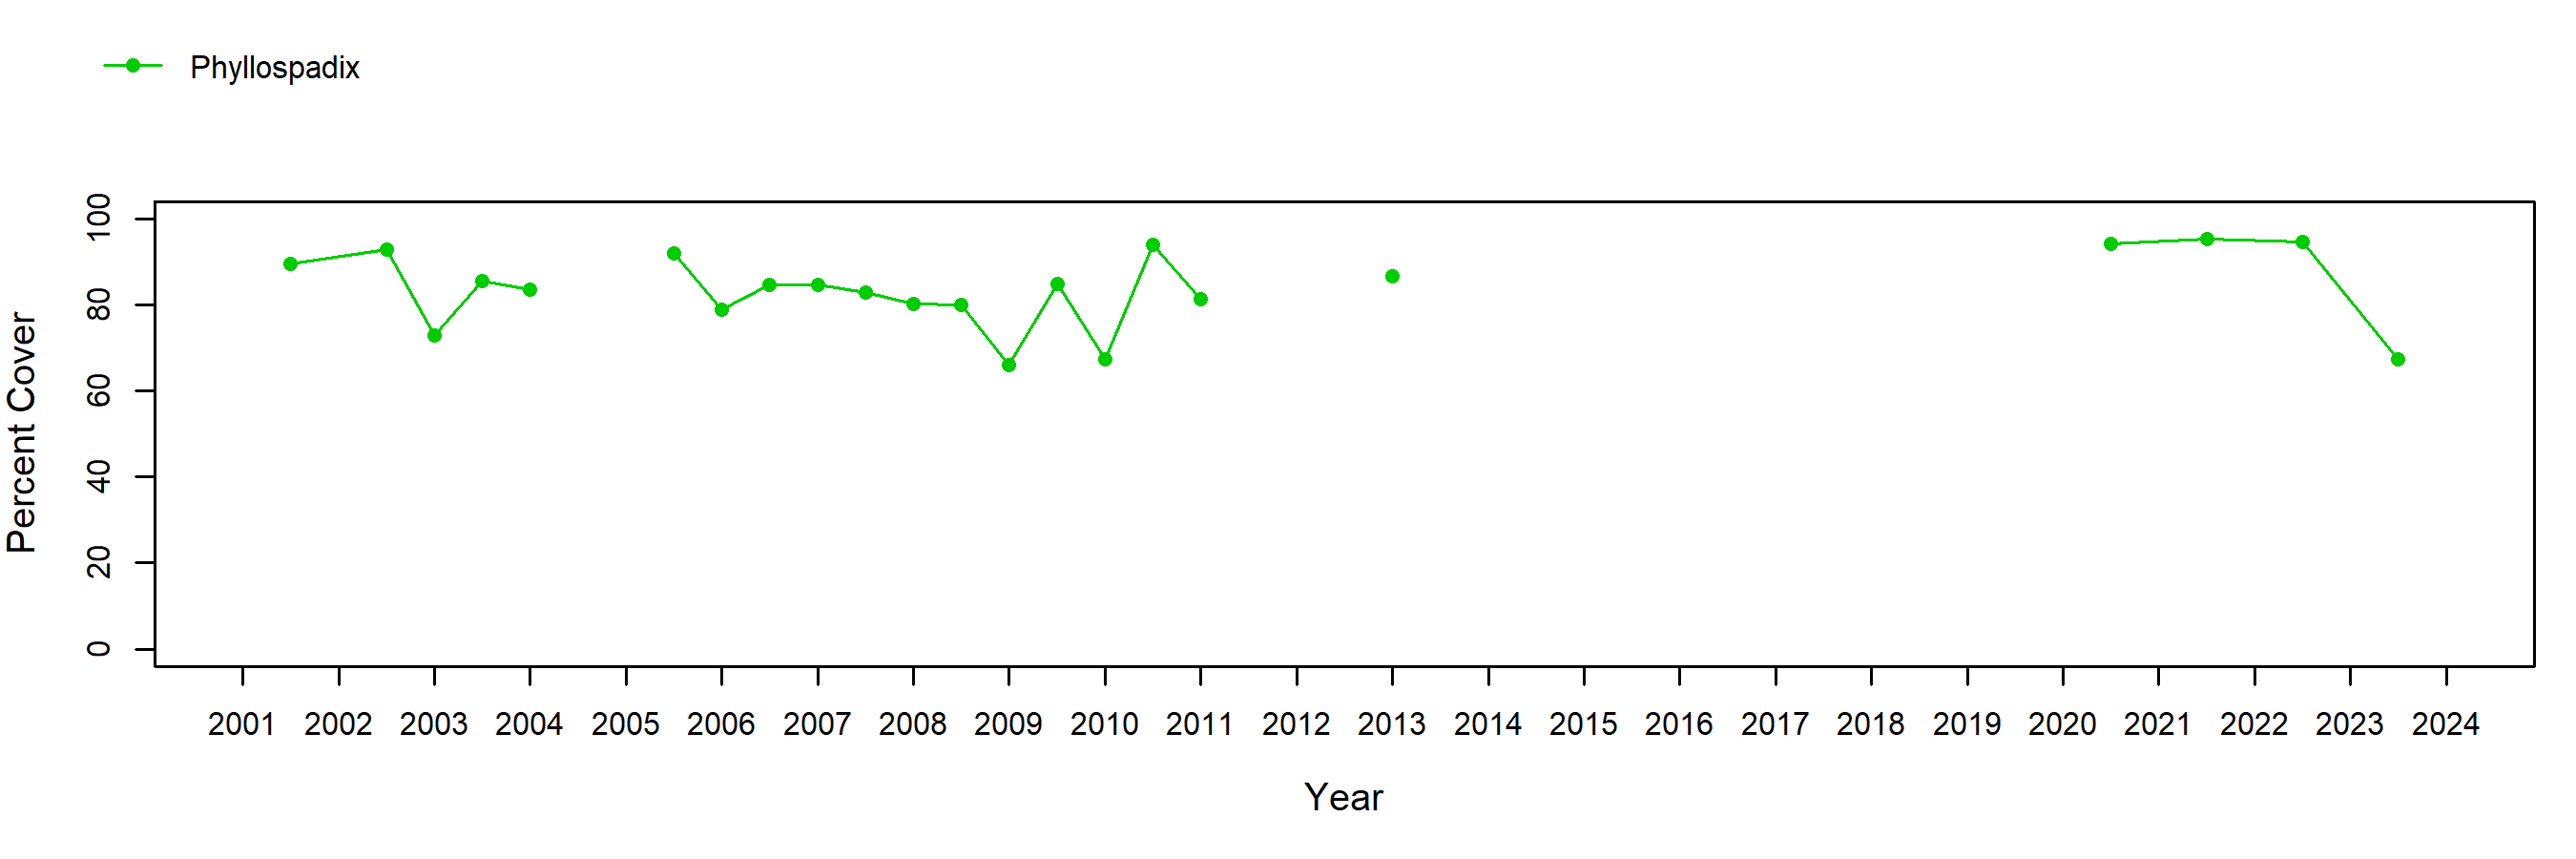
Phyllospadix cover at Hazards remained high over time, although it should be noted that averages are not always based on all three transects. Transects at this site were established in the very low intertidal, and thus cannot always be sampled. In SP02, FA04, FA11, SP12, FA12, FA13, SP14 and FA14 transects were not accessible for sampling. In FA02, SP03, SP09, FA09 and FA10 only the highest transect could be sampled. In FA05, SP06, FA07, FA08, and SP10 only two transects were accessible. These transects have not been sampled since 2013 due to access limitations.
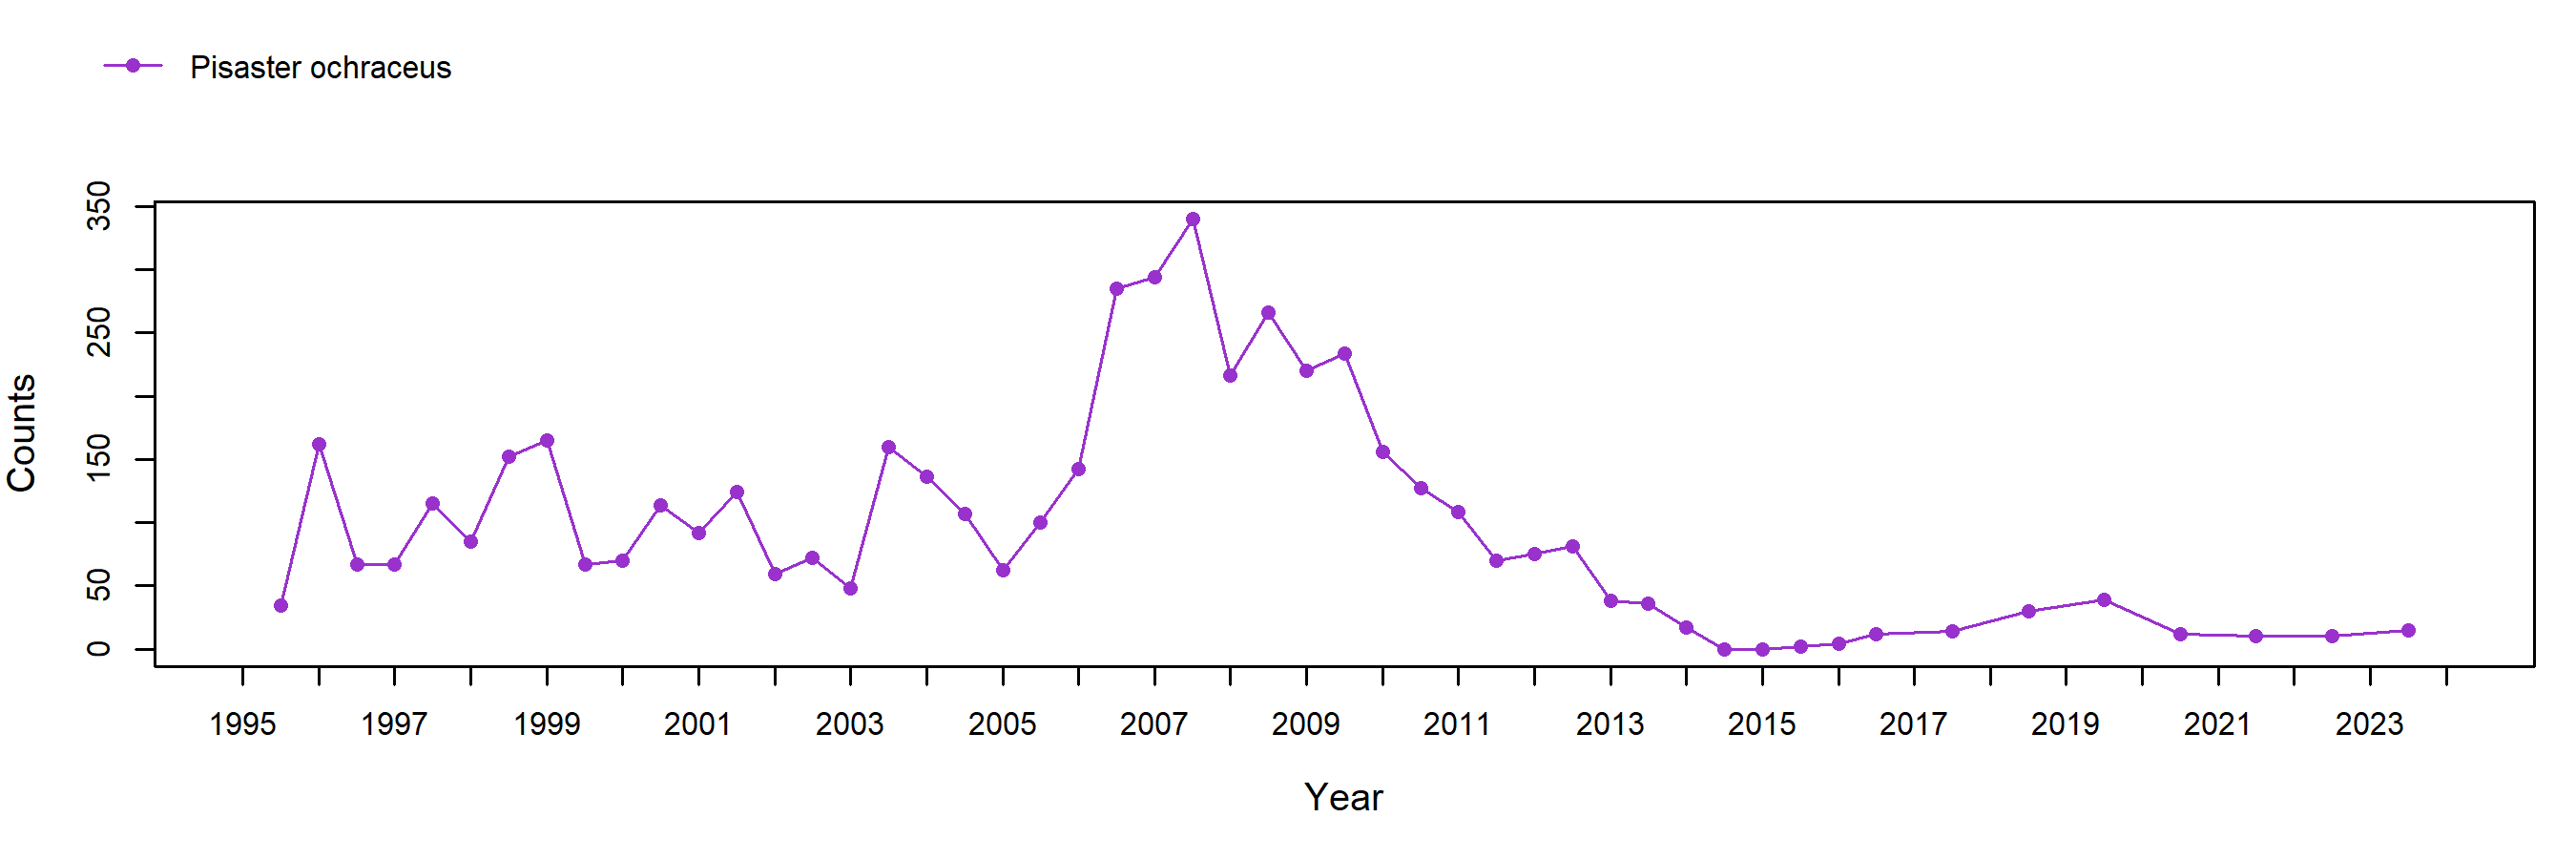
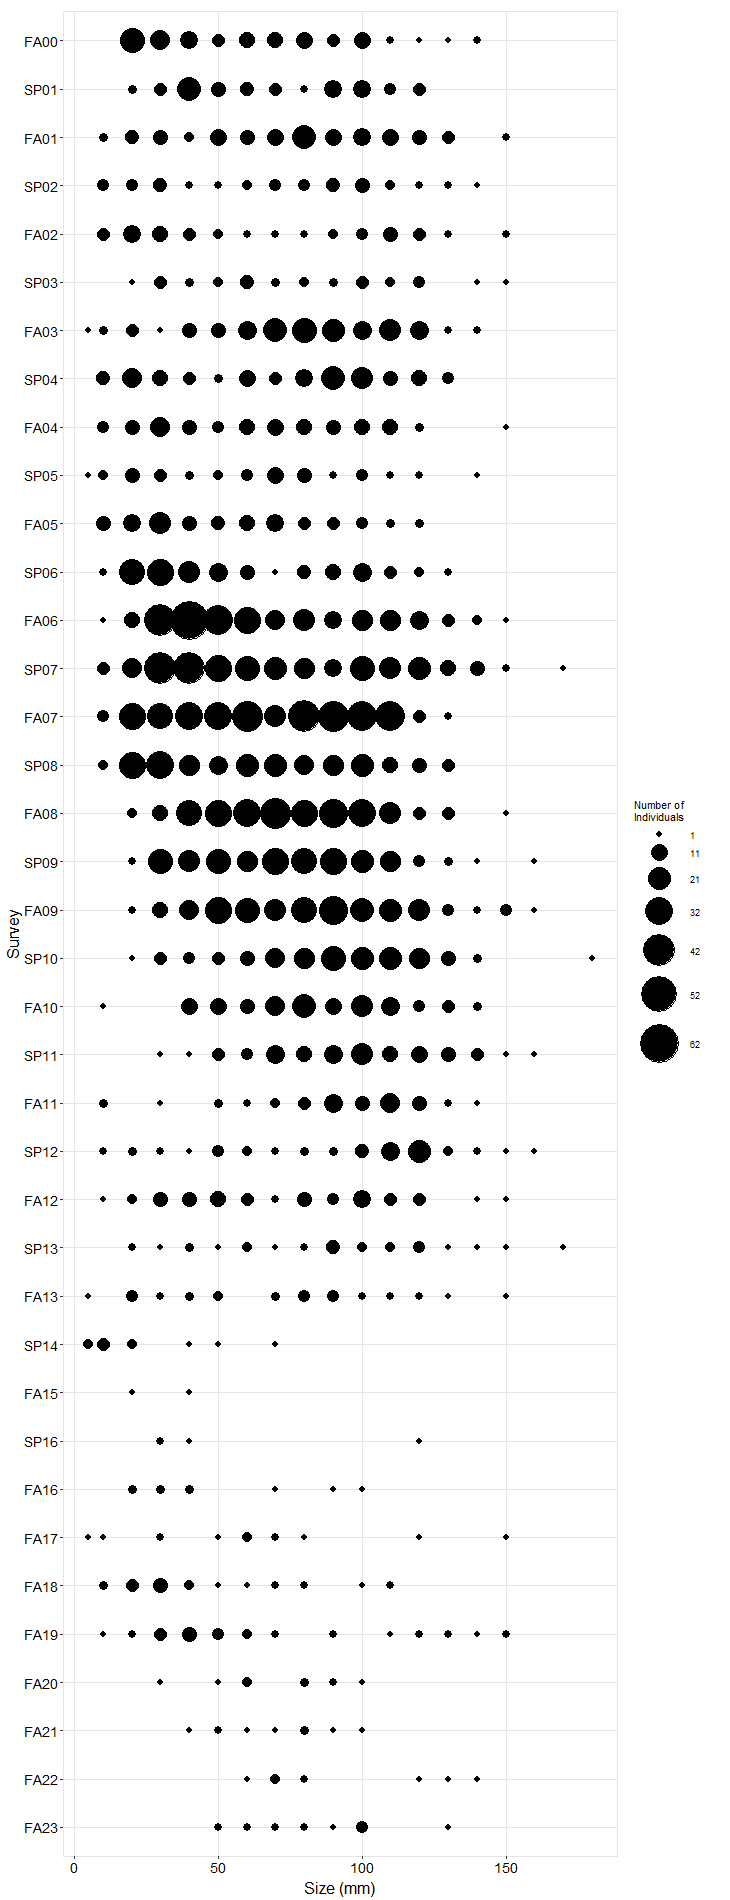
Pisaster ochraceus were abundant but variable for the first several years they were monitored at Hazards. Numbers increased substantially in 2006/2007, and size data suggest that this increase may have been due to a large recruitment event just before this period as large numbers of juveniles were recorded. In 2008, a declining trend began, and counts of ochre stars are currently quite low, following recent further decline due to sea star wasting syndrome. In addition, the plots were buried in sand from early August 2014 through mid-September 2014, as evidenced by data collected from our temperature logger (which is located at the edge of plot 1), extremely high scour seen throughout the plots, and an enormous berm of drift found just above the sea star and barnacle plots in fall 2014. This sand burial and subsequent scour likely impacted the sea star counts at this site, as healthy stars were found outside the plots. The number of ochre stars counted has increased slightly in recent years, but they are still much less common than they were in 2007.
Photo Plots
Below are the trends observed for each Photo Plot target species at this site. Long-Term percent cover trend graphs also include any species that reached a minimum of 25% cover during any single point in time within a given target species assemblage. Breaks in trend lines represent missed sampling events. For additional species observed that did not meet this 25% threshold, please use the Interactive Map.
For motile invertebrate Species Counts, a mean across all plots was calculated, and only those species with a value of at least 5 individuals for at least one sample are shown. Due to time constraints, motile invertebrate counts have not been done at most sites since 2012. For motile invertebrate size trend graphs by site, please use the Interactive Map.
Chthamalus/Balanus (Acorn Barnacles) - percent cover
Chthamalus/Balanus (Acorn Barnacles) - motile invertebrate counts
Mytilus (California Mussel) - percent cover
Mytilus (California Mussel) - motile invertebrate counts
Silvetia (Golden Rockweed) - percent cover
Silvetia (Golden Rockweed) - motile invertebrate counts
Endocladia (Turfweed) - percent cover
Endocladia (Turfweed) - motile invertebrate counts
Mazzaella (Iridescent Weed)
Transects
Below are the trends observed for each Transect target species at this site. Long-Term trend graphs show all species that reached a minimum of 25% cover during any single point in time within a given target species assemblage. Breaks in trend lines represent missed sampling events.
Phyllospadix (Surfgrass)
Species Counts and Sizes
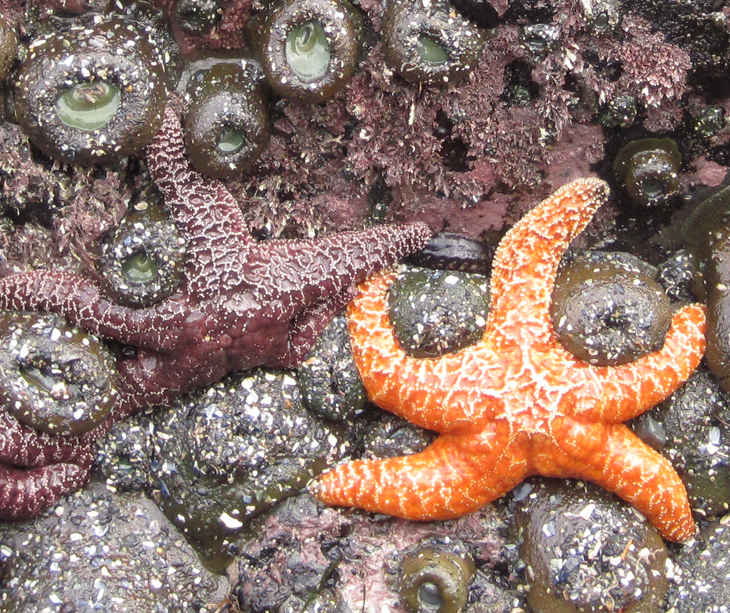
Species Counts and Sizes (where recorded) for Pisaster are shown below for this site. At some sites, other sea star species and Katharina are counted in addition to Pisaster. The sum of all individuals across all plots is displayed. Note that data gaps are represented by breaks in long-term count trend lines, but are not shown in size plots.
Pisaster (Ochre Star) - counts
Pisaster (Ochre Star) - sizes
Sites home
Interactive Map
pacificrockyintertidal.org home
