Little Harbor Long-Term trends | MARINe
Little Harbor Long-Term trends
See below for trend graphs
In order to standardize species resolution across all MARINe groups, and over time, some species (typically rare) were lumped for graphical presentation of Long-Term monitoring data. See lumped categories for definitions (some variation occurs between methods and over time).
Long-Term Monitoring Surveys at Little Harbor were established in 1995, and are done by volunteers; field data have been collected, but not scored nor entered into database.
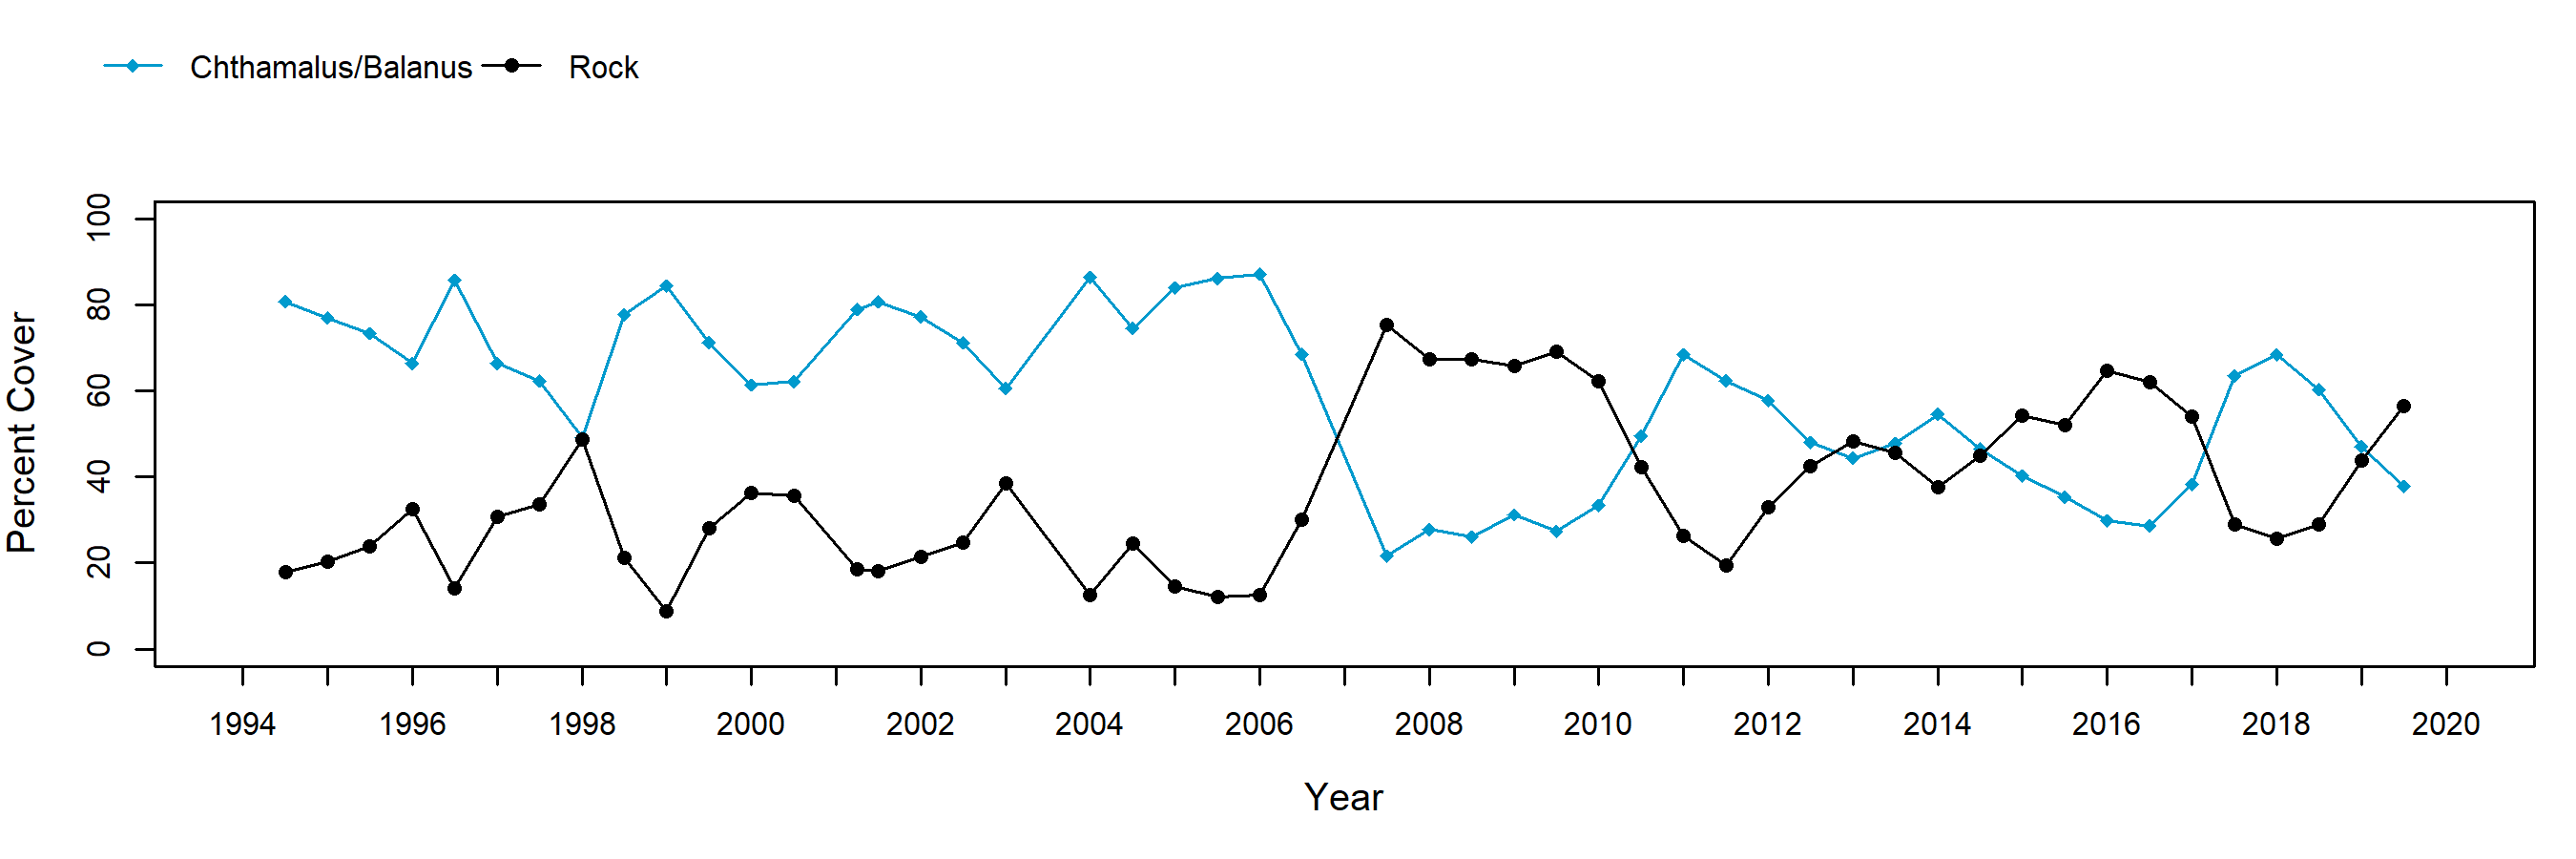
Barnacle plots at Little Harbor consist primarily of Chthamalus dalli/fissus (species were not distinguished). Cover of Chthamalus varied inversely with rock cover nearly perfectly. Barnacle cover declined and recovered in several cycles from 1994 to 2008, including declines coincident with the 1997-1998 El Niño followed by rapid recovery during the subsequent La Niña. Chthamalus cover dropped precipitously from Fall 2006 to Fall 2007, apparently due to sand/cobble scour from major storm(s).
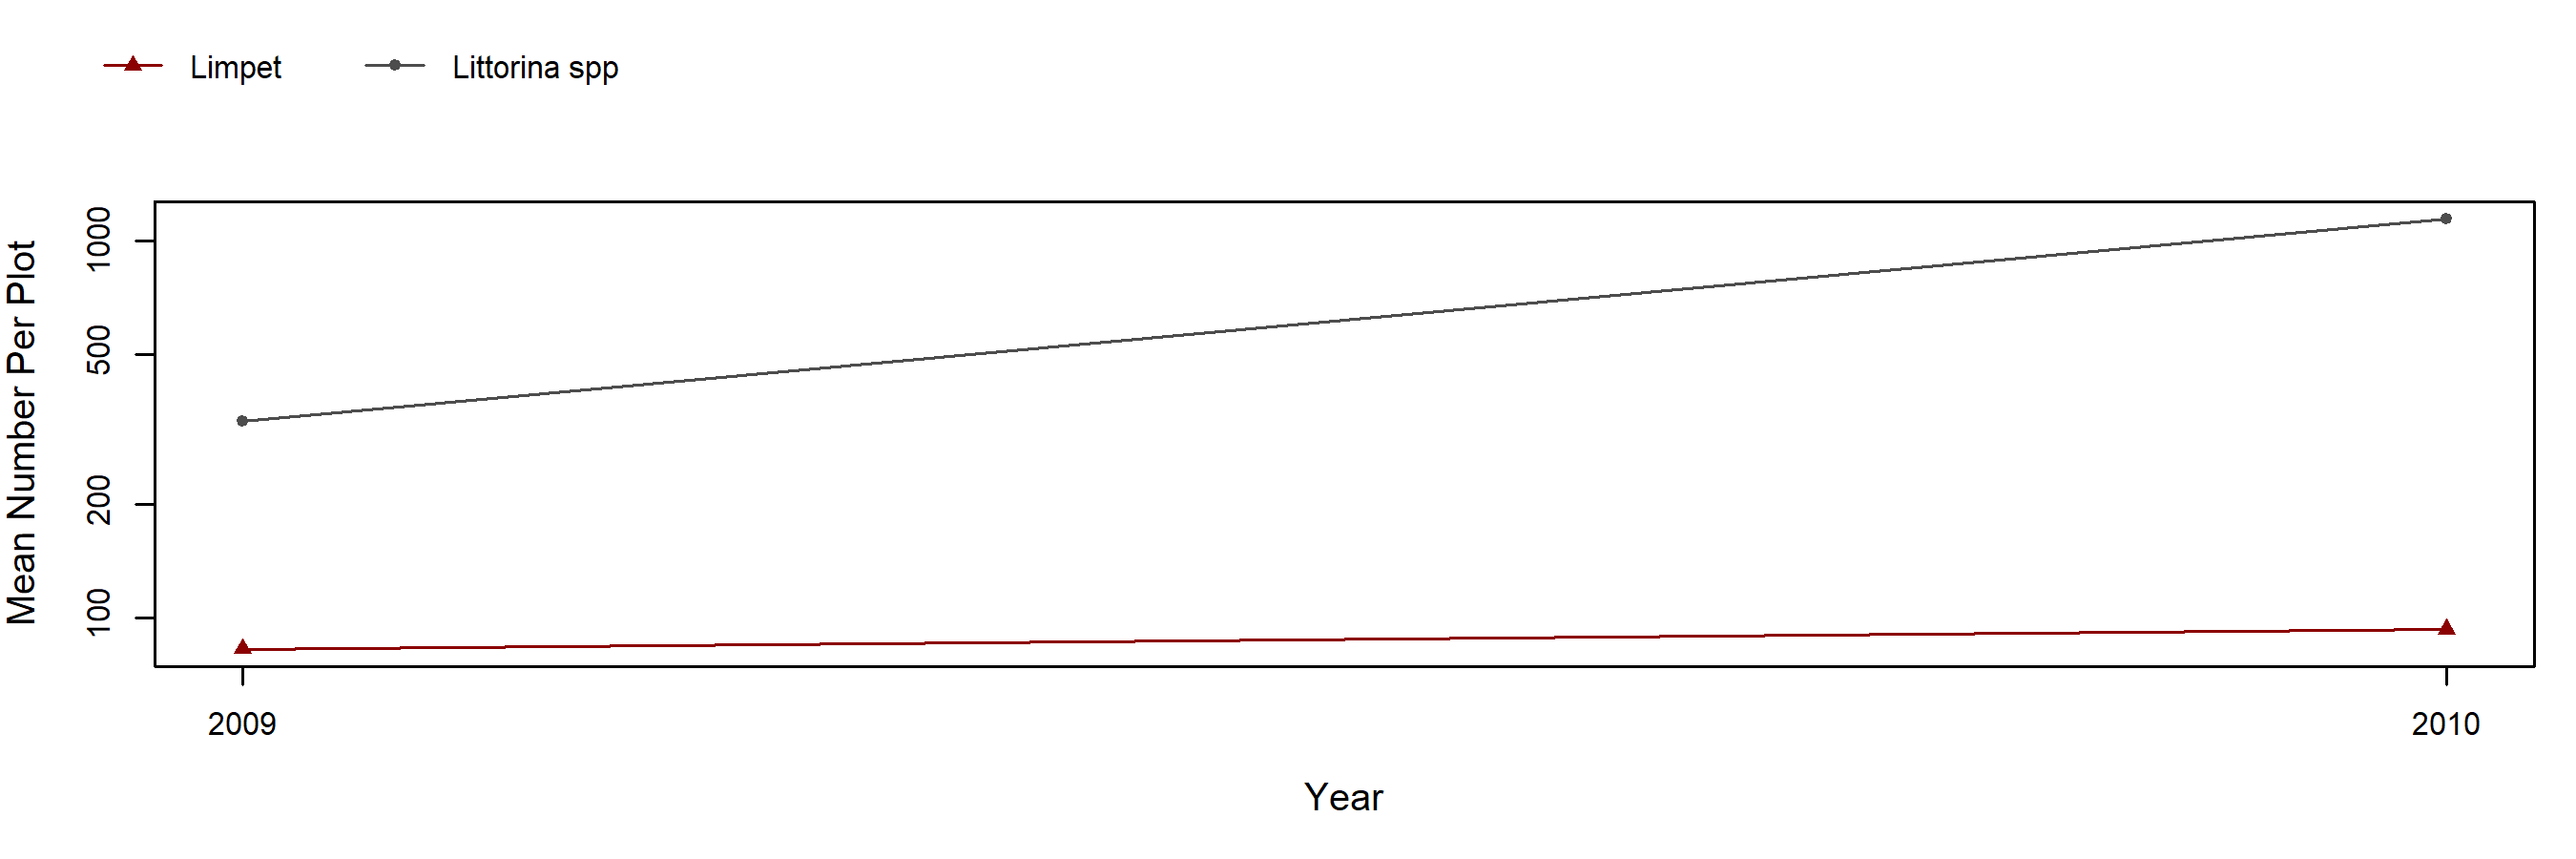
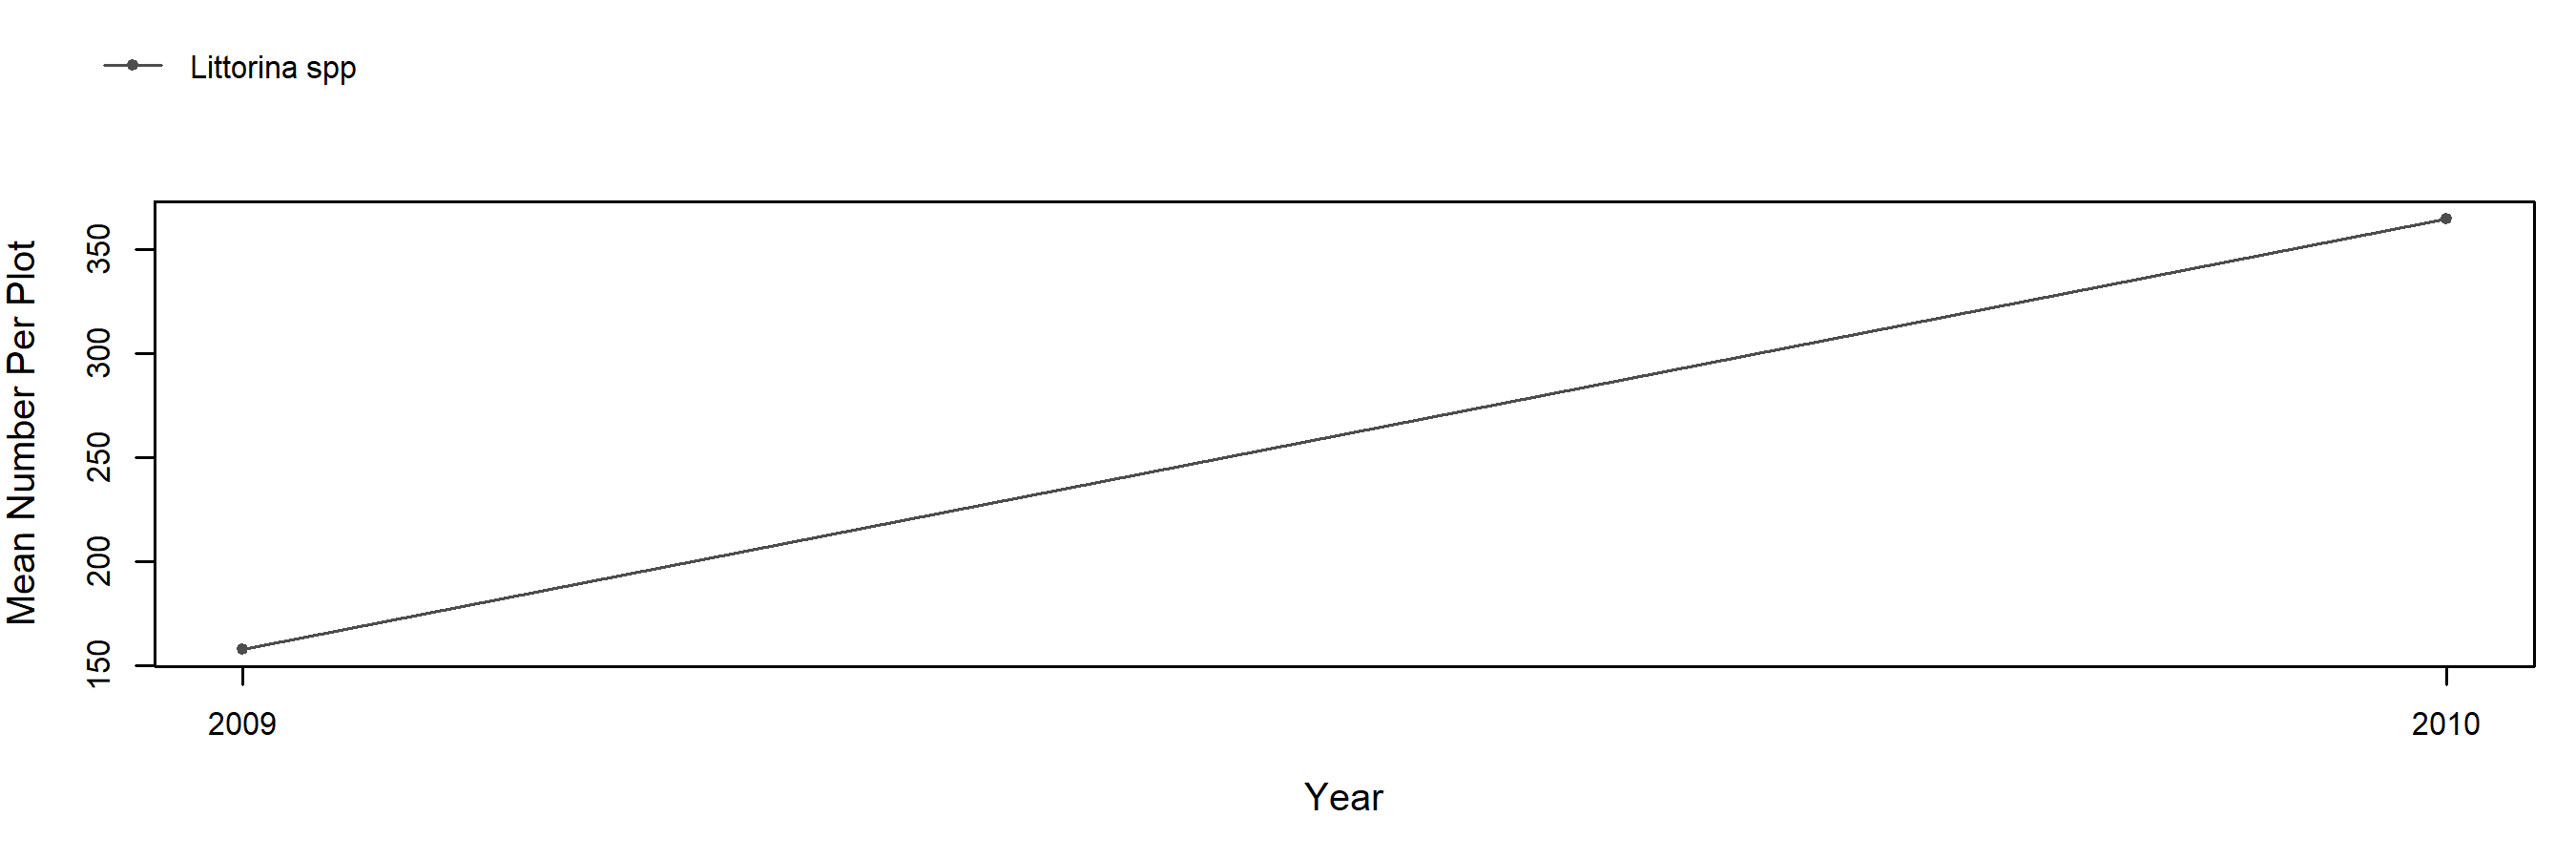
Annual motile invertebrate counts were initiated in barnacle plots in 2009. Littorina spp. were abundant in 2009-2010, with much lower numbers of limpets in these plots.
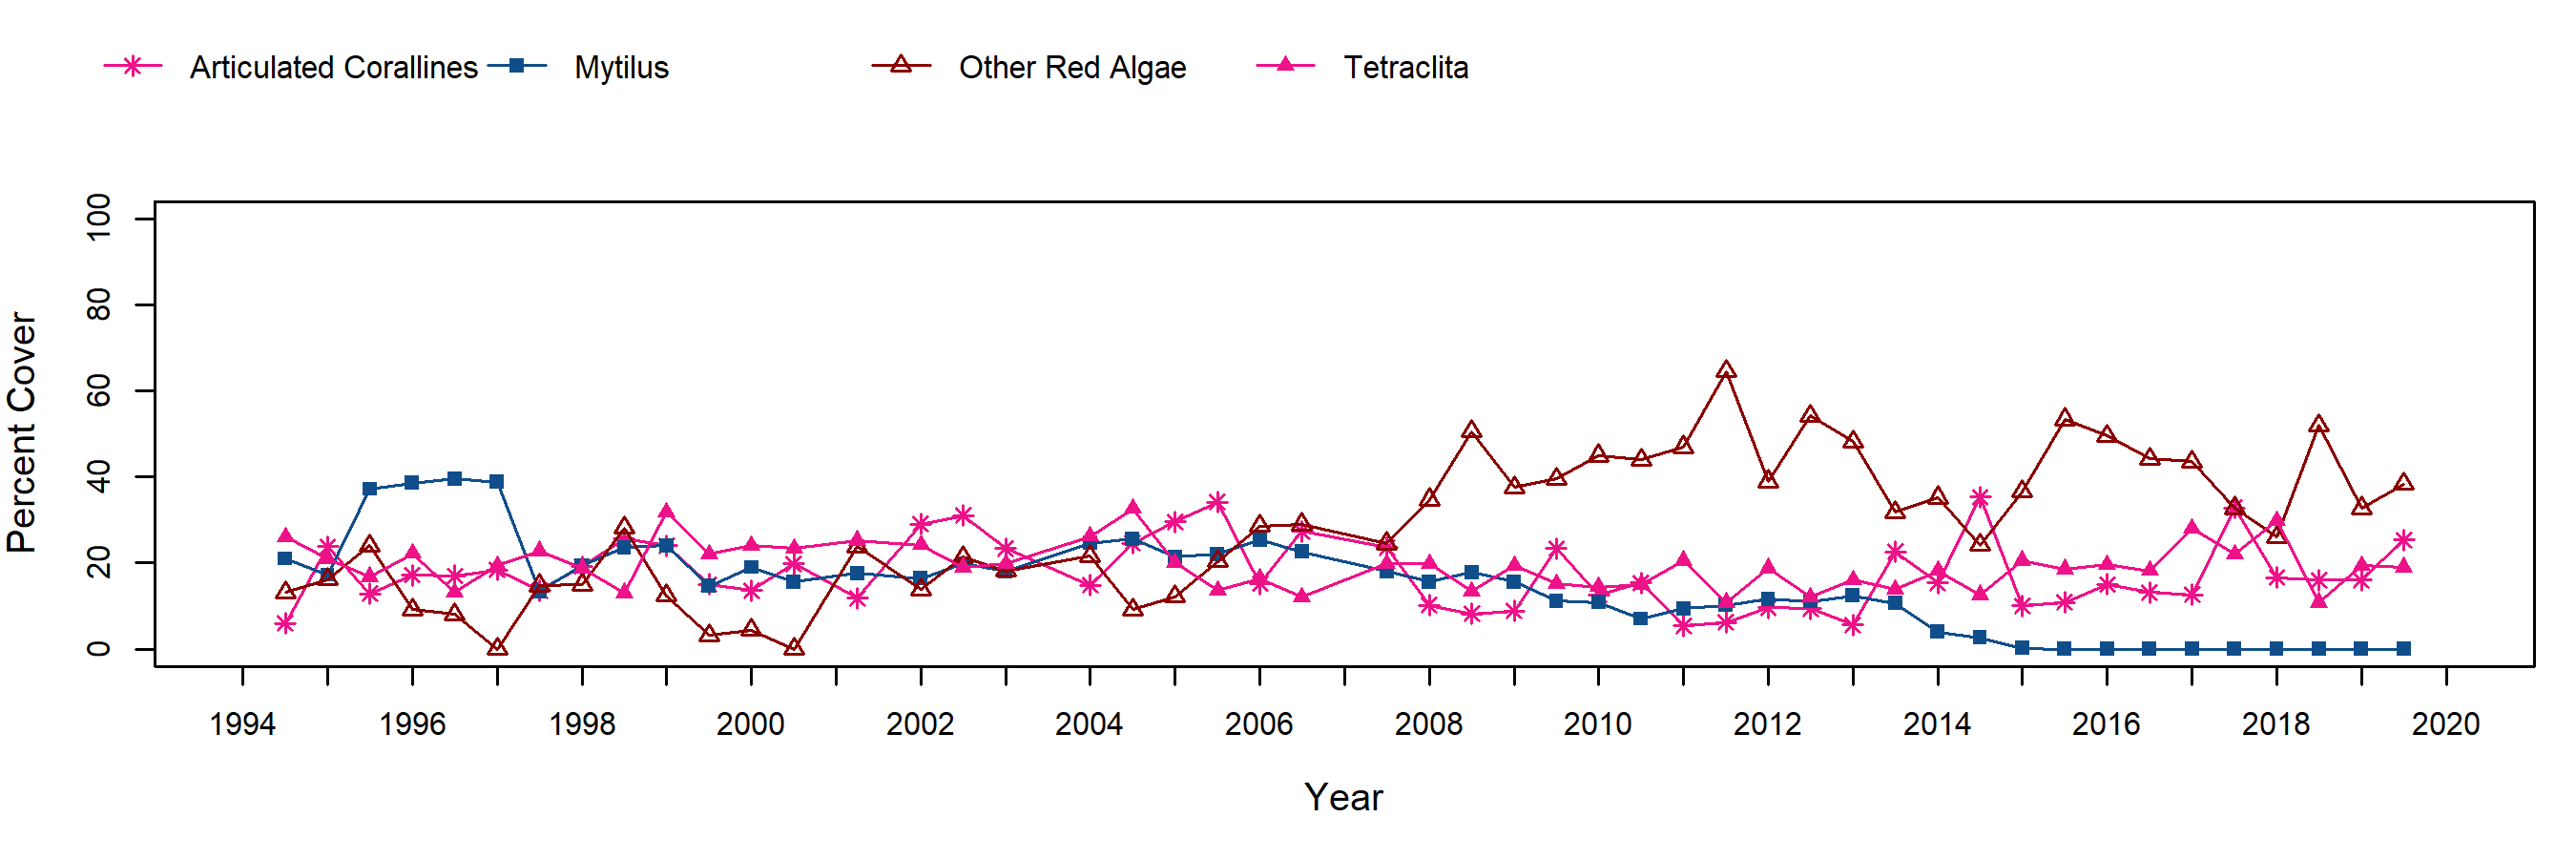
Mytilus cover in mussel plots was in the 15-25% range for all years except 1995-1997 when cover was ~40%. Articulated corallines, other red algae, and Tetraclita, generally made up the remainder of cover within the plots.
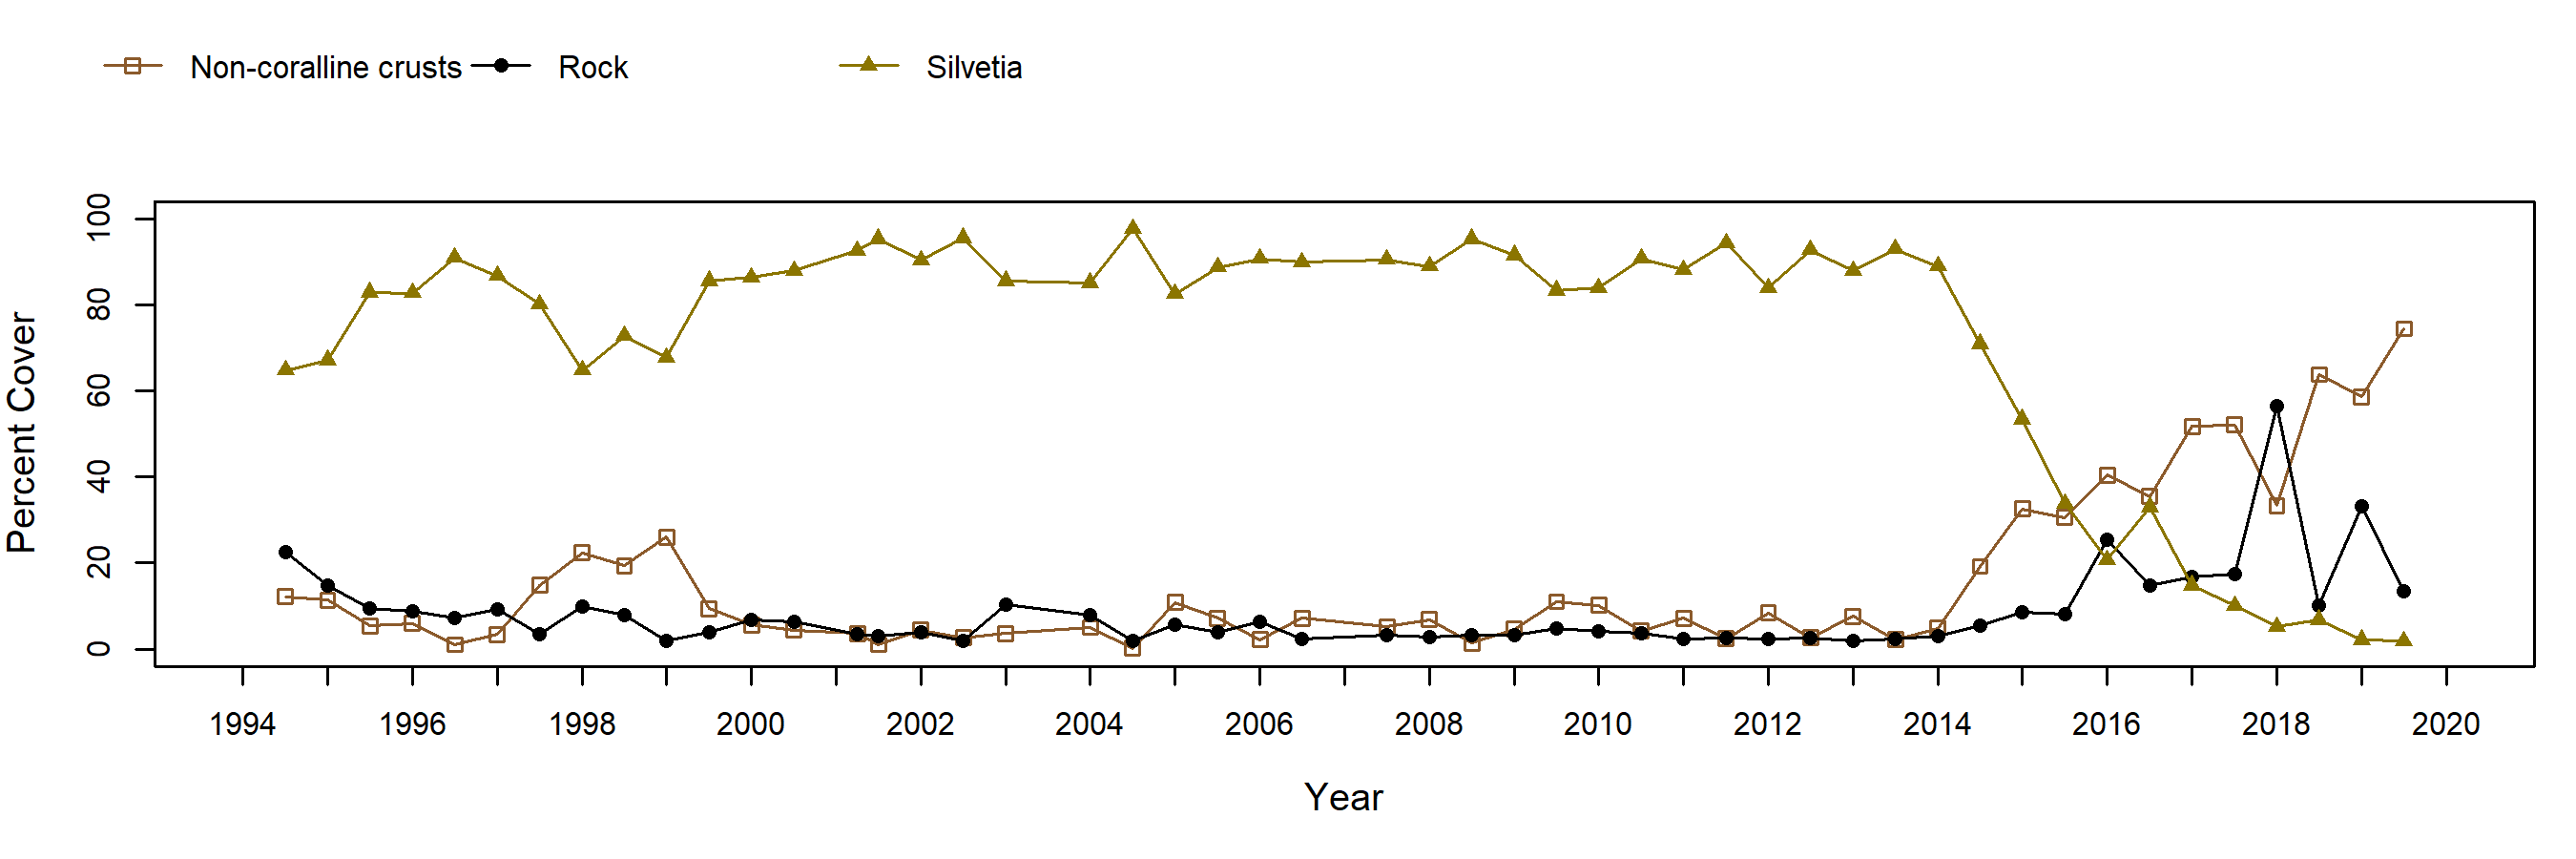
Silvetia cover in Silvetia plots predominated at 60-95% levels from 1994-2008, with non-coralline crust cover varying inversely. Declines in Silvetia cover were coincident with the 1997-1998 El Niño followed by recovery during the 1999-2000 La Niña.
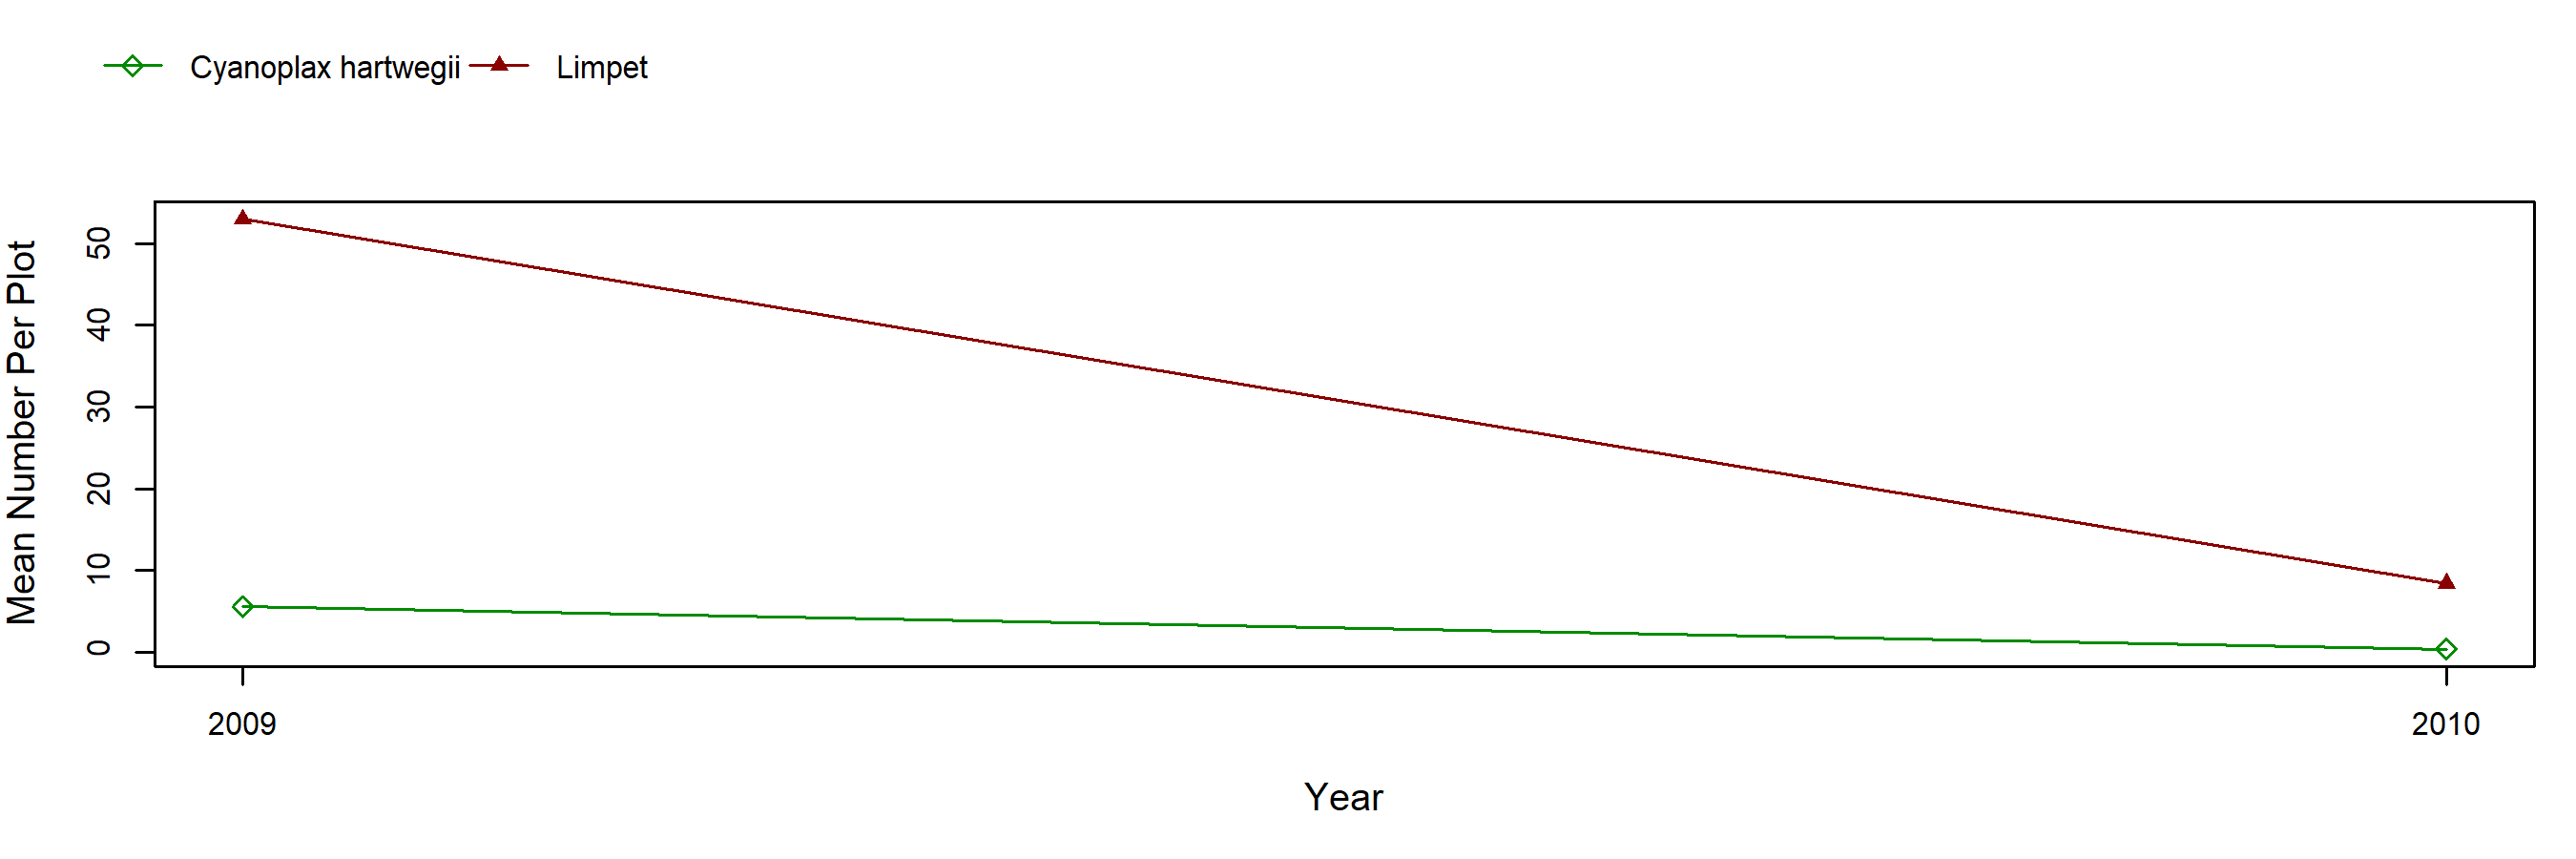
Annual motile invertebrate counts were initiated in Silvetia plots in 2009. Motile invertebrates were typically found beneath the Silvetia canopy. Limpets declined from 2009 to 2010, while Cyanoplax chitons were consistently few in number.
Rock (above barnacles) plots were established in 2009. Periwinkles Littorina spp. increased in number from 2000 to 2010.
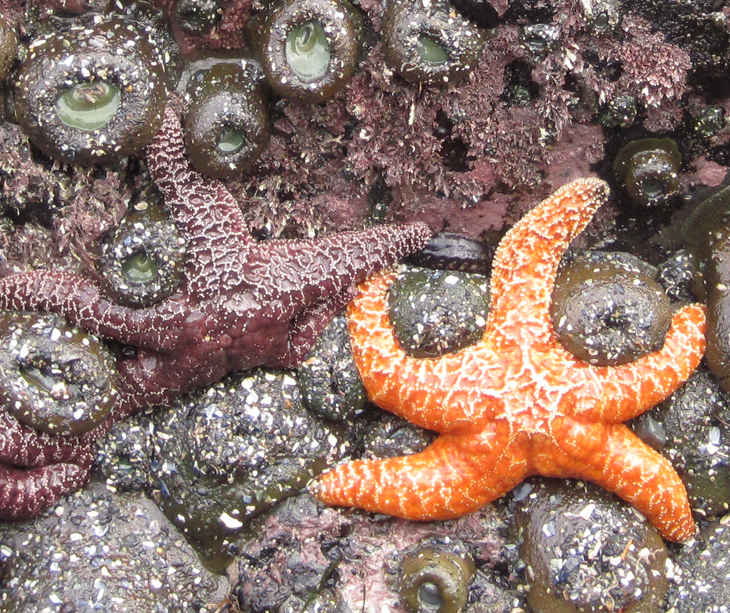
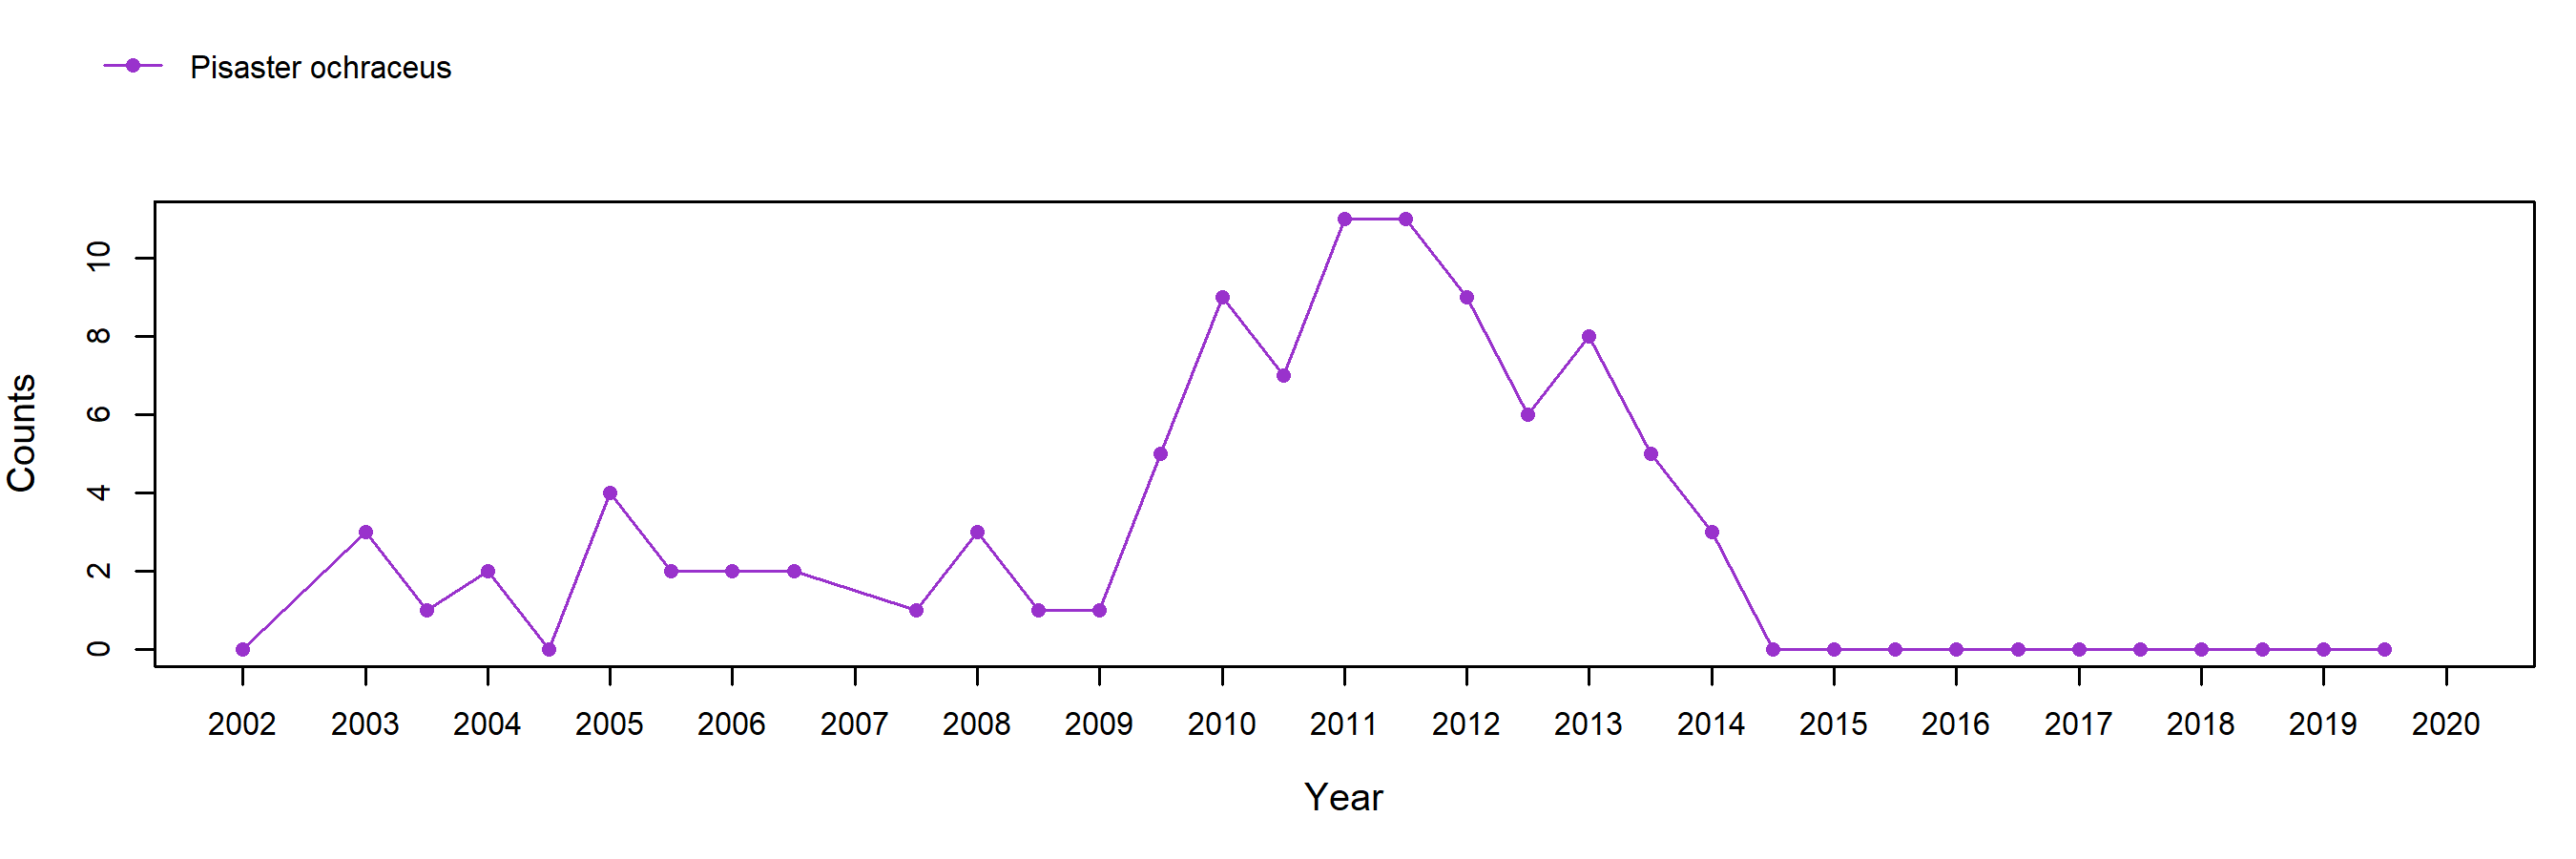
Ochre seastars (Pisaster ochraceus) were rare from Spring 2002 to Spring 2009, after which 5-9 mostly small (50-70 mm radius) stars were found site-wide in Fall 2009 to Spring 2010. Southern California seastars experienced catastrophic declines associated with warm-water periods starting in the late 1970’s due to a bacterial “wasting” disease. Some recovery has been evident in recent years.
Photo Plots
Below are the trends observed for each Photo Plot target species at this site. Long-Term percent cover trend graphs also include any species that reached a minimum of 25% cover during any single point in time within a given target species assemblage. Breaks in trend lines represent missed sampling events. For additional species observed that did not meet this 25% threshold, please use the Interactive Map.
For motile invertebrate Species Counts, a mean across all plots was calculated, and only those species with a value of at least 5 individuals for at least one sample are shown. Due to time constraints, motile invertebrate counts have not been done at most sites since 2012. For motile invertebrate size trend graphs by site, please use the Interactive Map.
Chthamalus/Balanus (Acorn Barnacles) - percent cover
Chthamalus/Balanus (Acorn Barnacles) - motile invertebrate counts
Mytilus (California Mussel)
Silvetia (Golden Rockweed) - percent cover
Silvetia (Golden Rockweed) - motile invertebrate counts
Rock (Above Barnacles) - motile invertebrate counts
Species Counts and Sizes
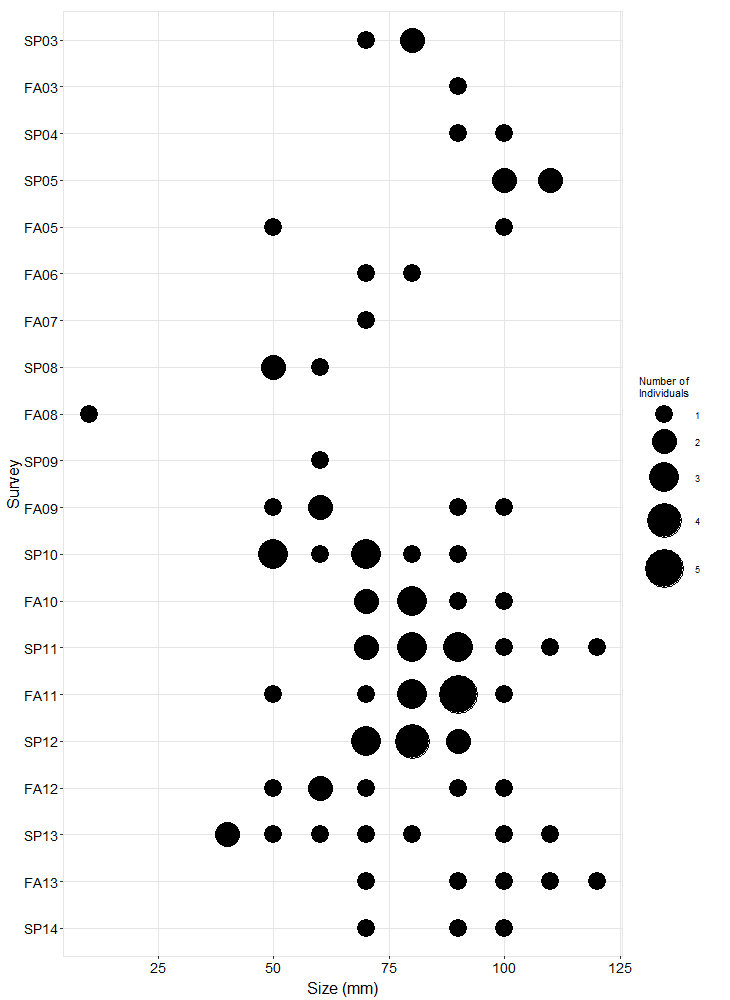
Species Counts and Sizes (where recorded) for Pisaster are shown below for this site. At some sites, other sea star species and Katharina are counted in addition to Pisaster. The sum of all individuals across all plots is displayed. Note that data gaps are represented by breaks in long-term count trend lines, but are not shown in size plots.
Pisaster (Ochre Star) - counts
>
Pisaster (Ochre Star) - sizes