In order to standardize species resolution across all MARINe groups and over time, some species (typically rare) were lumped for graphical presentation of Long-Term monitoring data. See lumped categories for definitions (some variation occurs between methods and over time).
If you experience any barriers accessing the trend graphs below, please contact (pacificr@ucsc.edu) for help.
Photo Plots

Below are the trends observed for each Photo Plot target species at this site. Long-Term percent cover trend graphs also include any species that reached a minimum of 25% cover during any single point in time within a given target species assemblage. Breaks in trend lines represent missed sampling events. For additional species observed that did not meet this 25% threshold, please use the Graphing Tool.
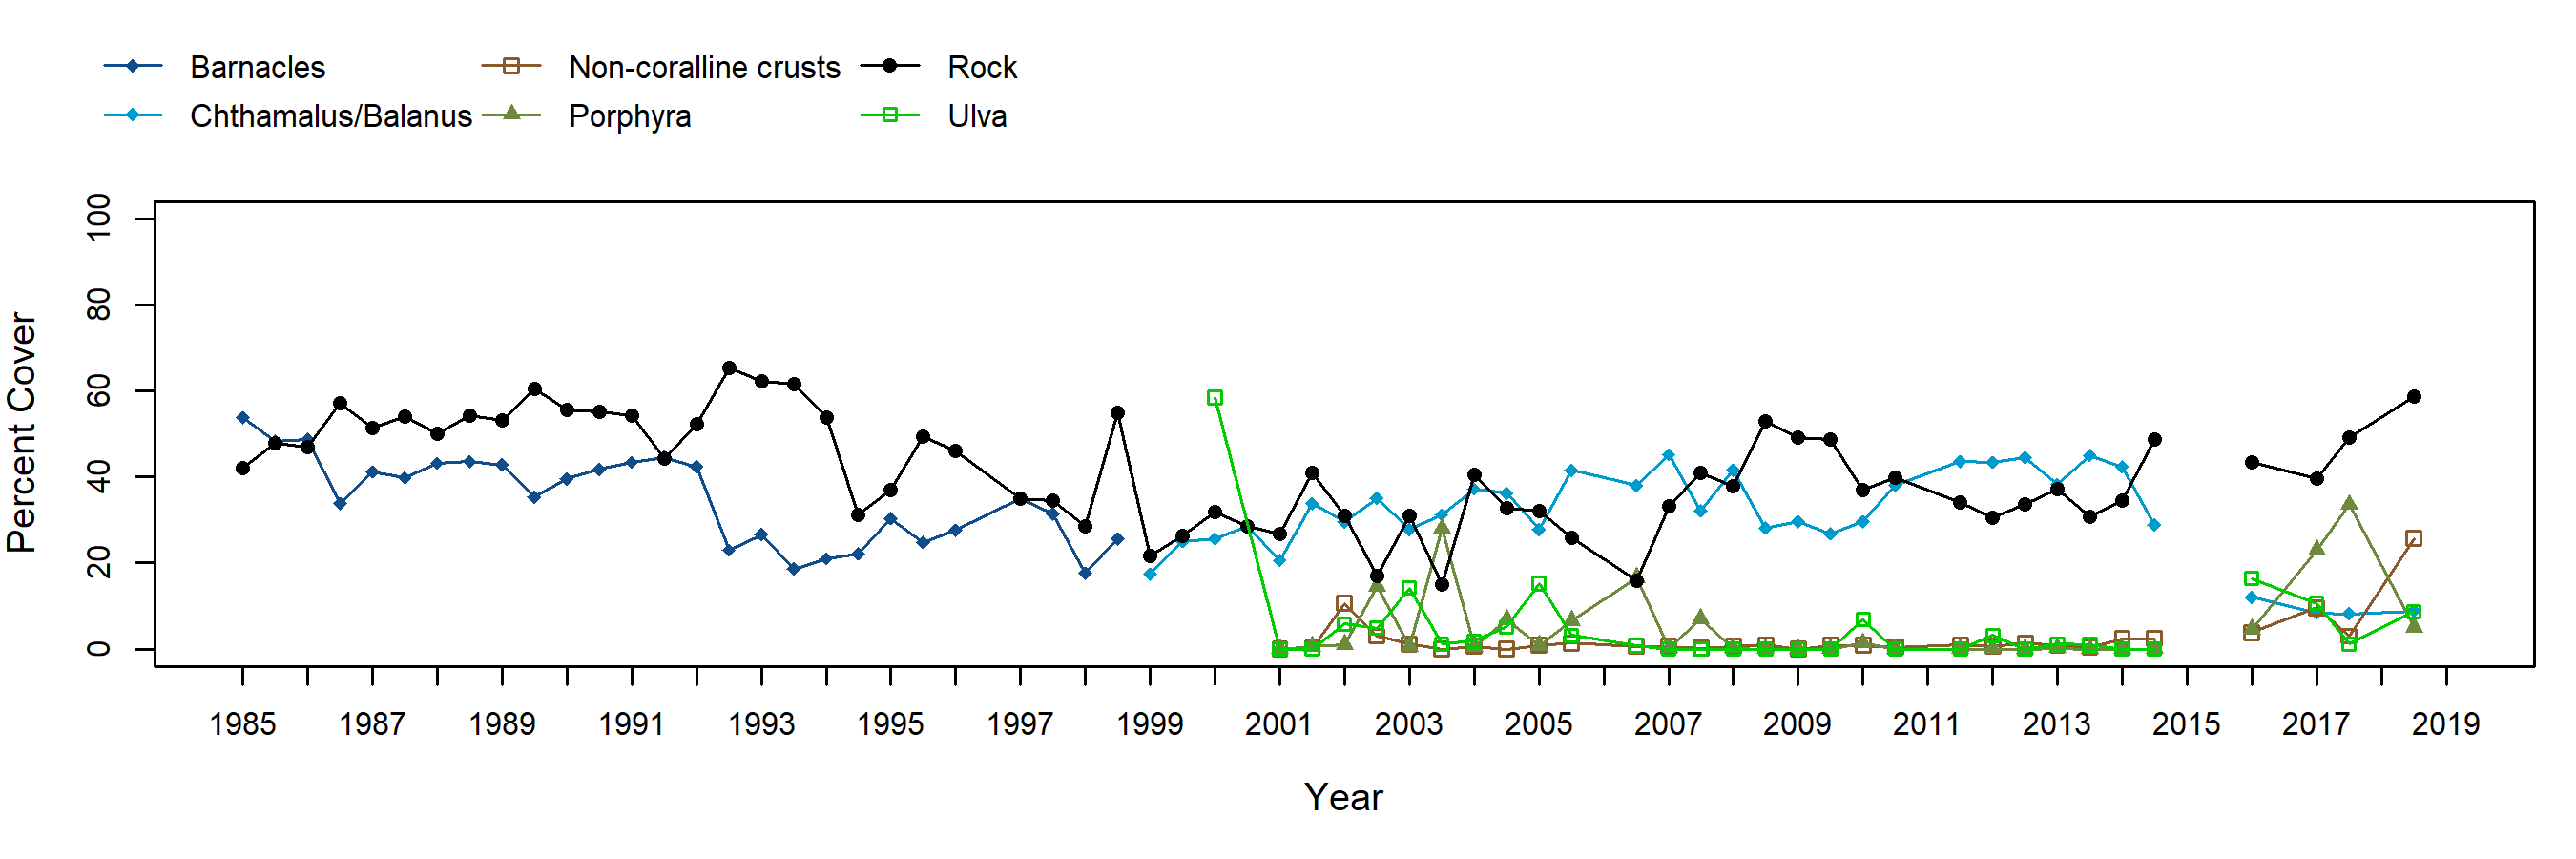
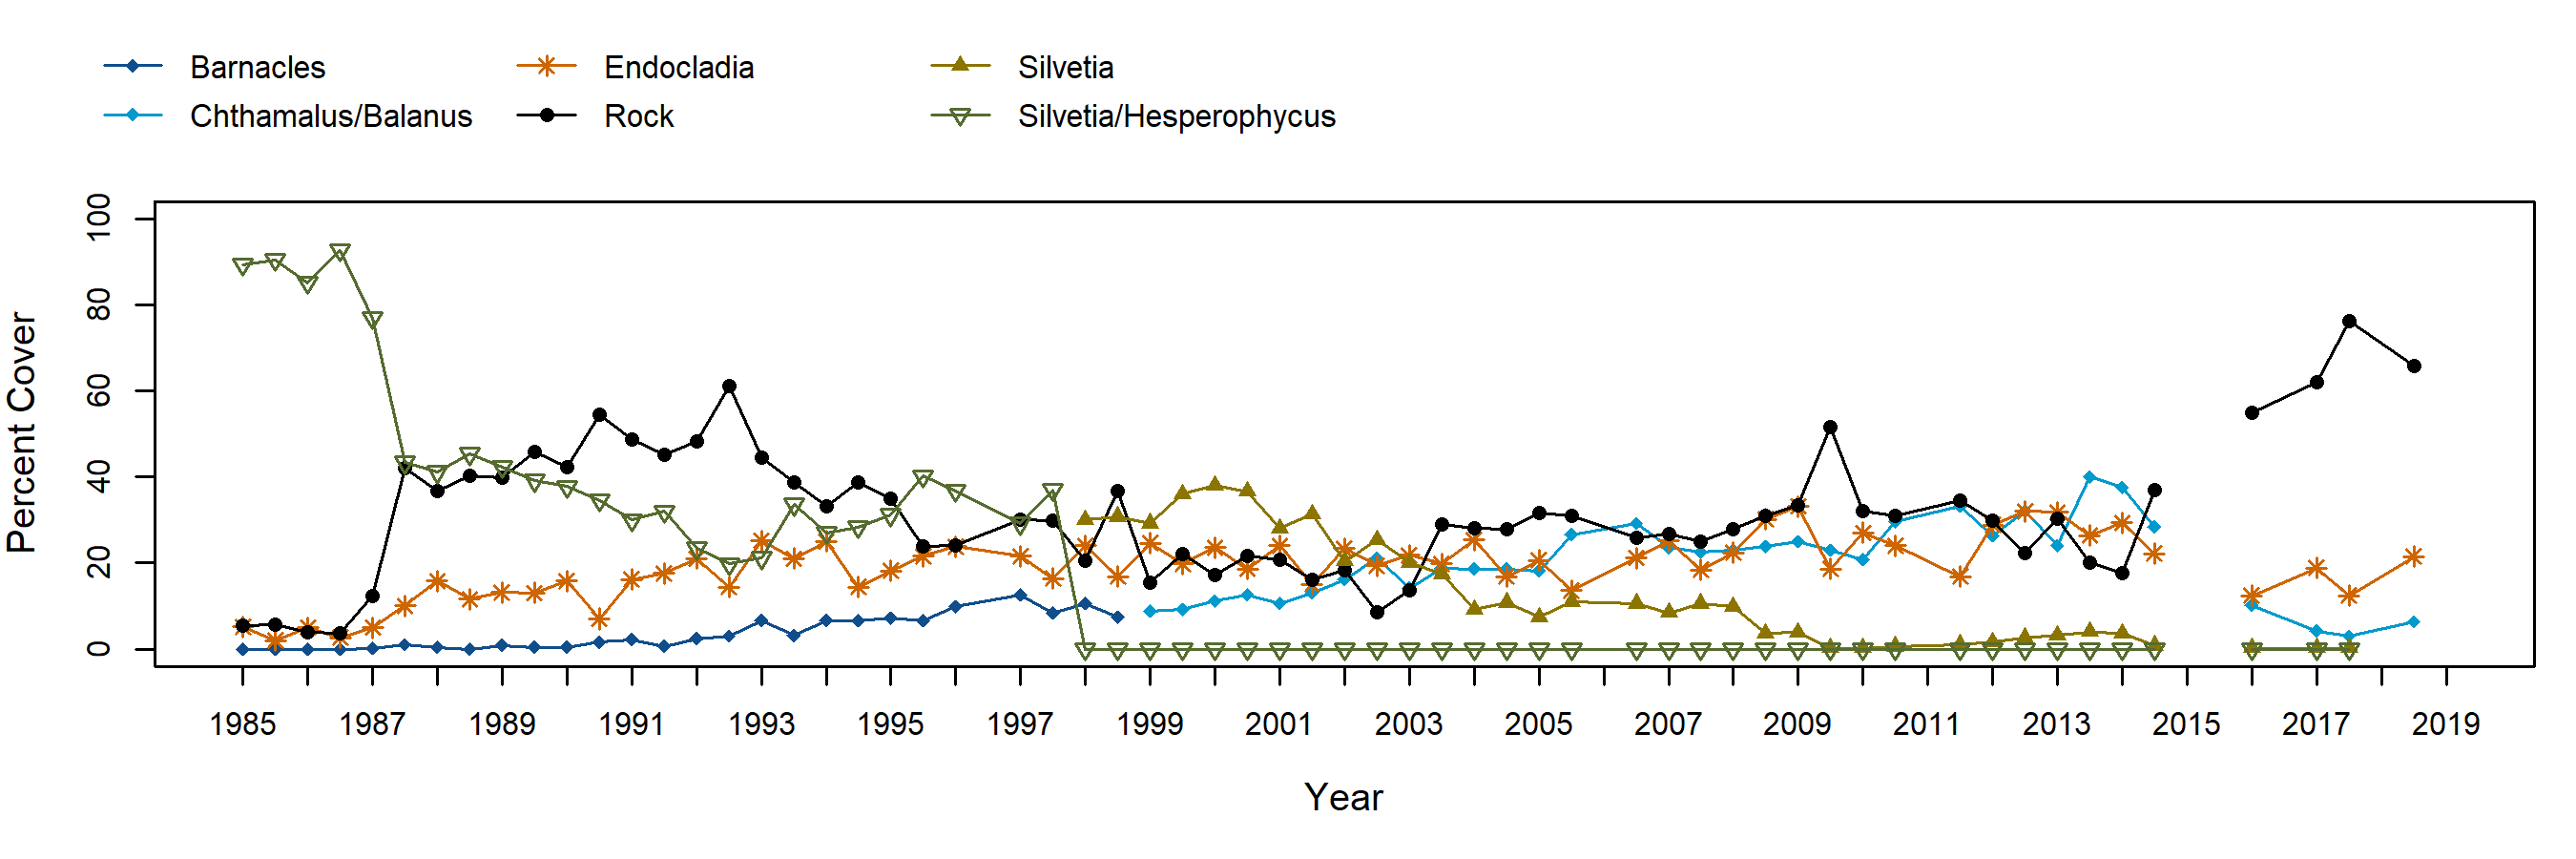
Chthamalus/Balanus (Acorn Barnacles) – percent cover
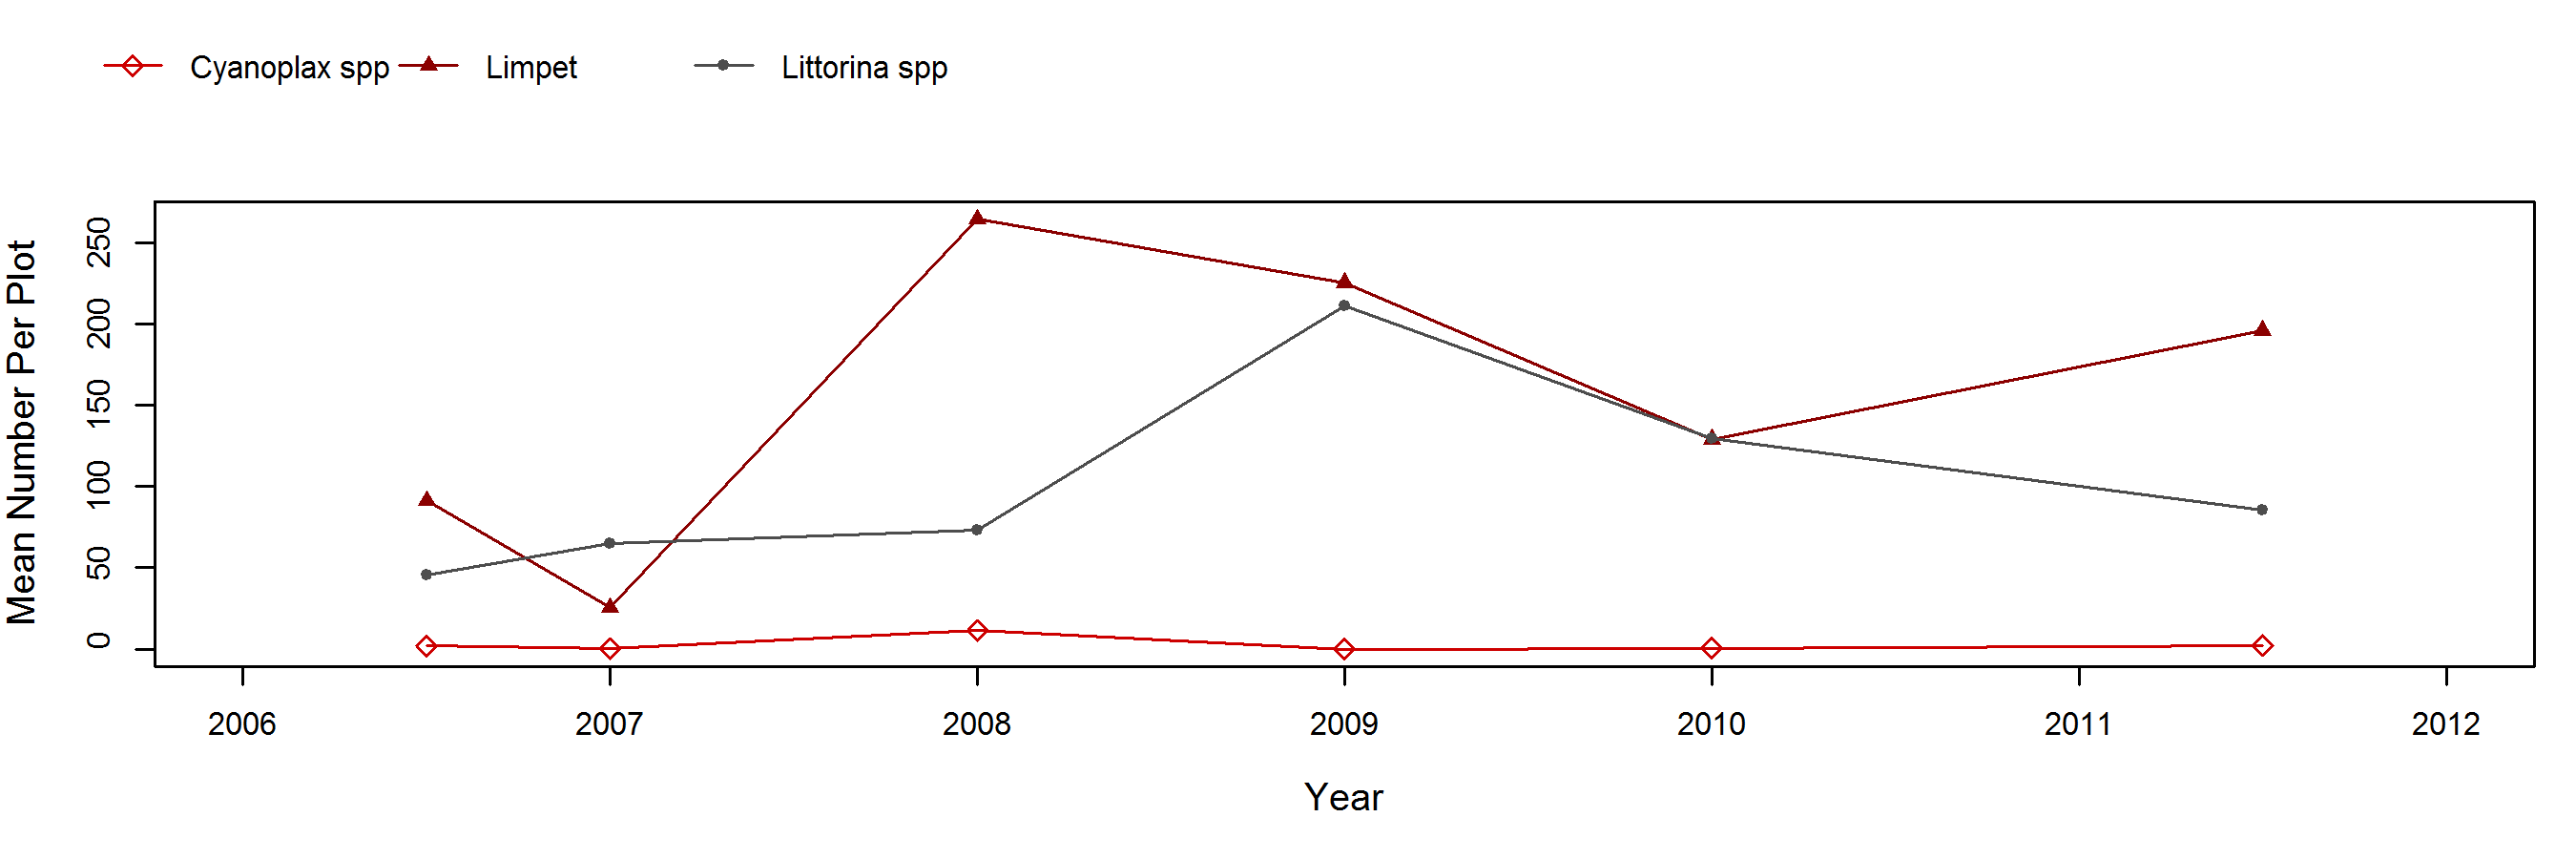
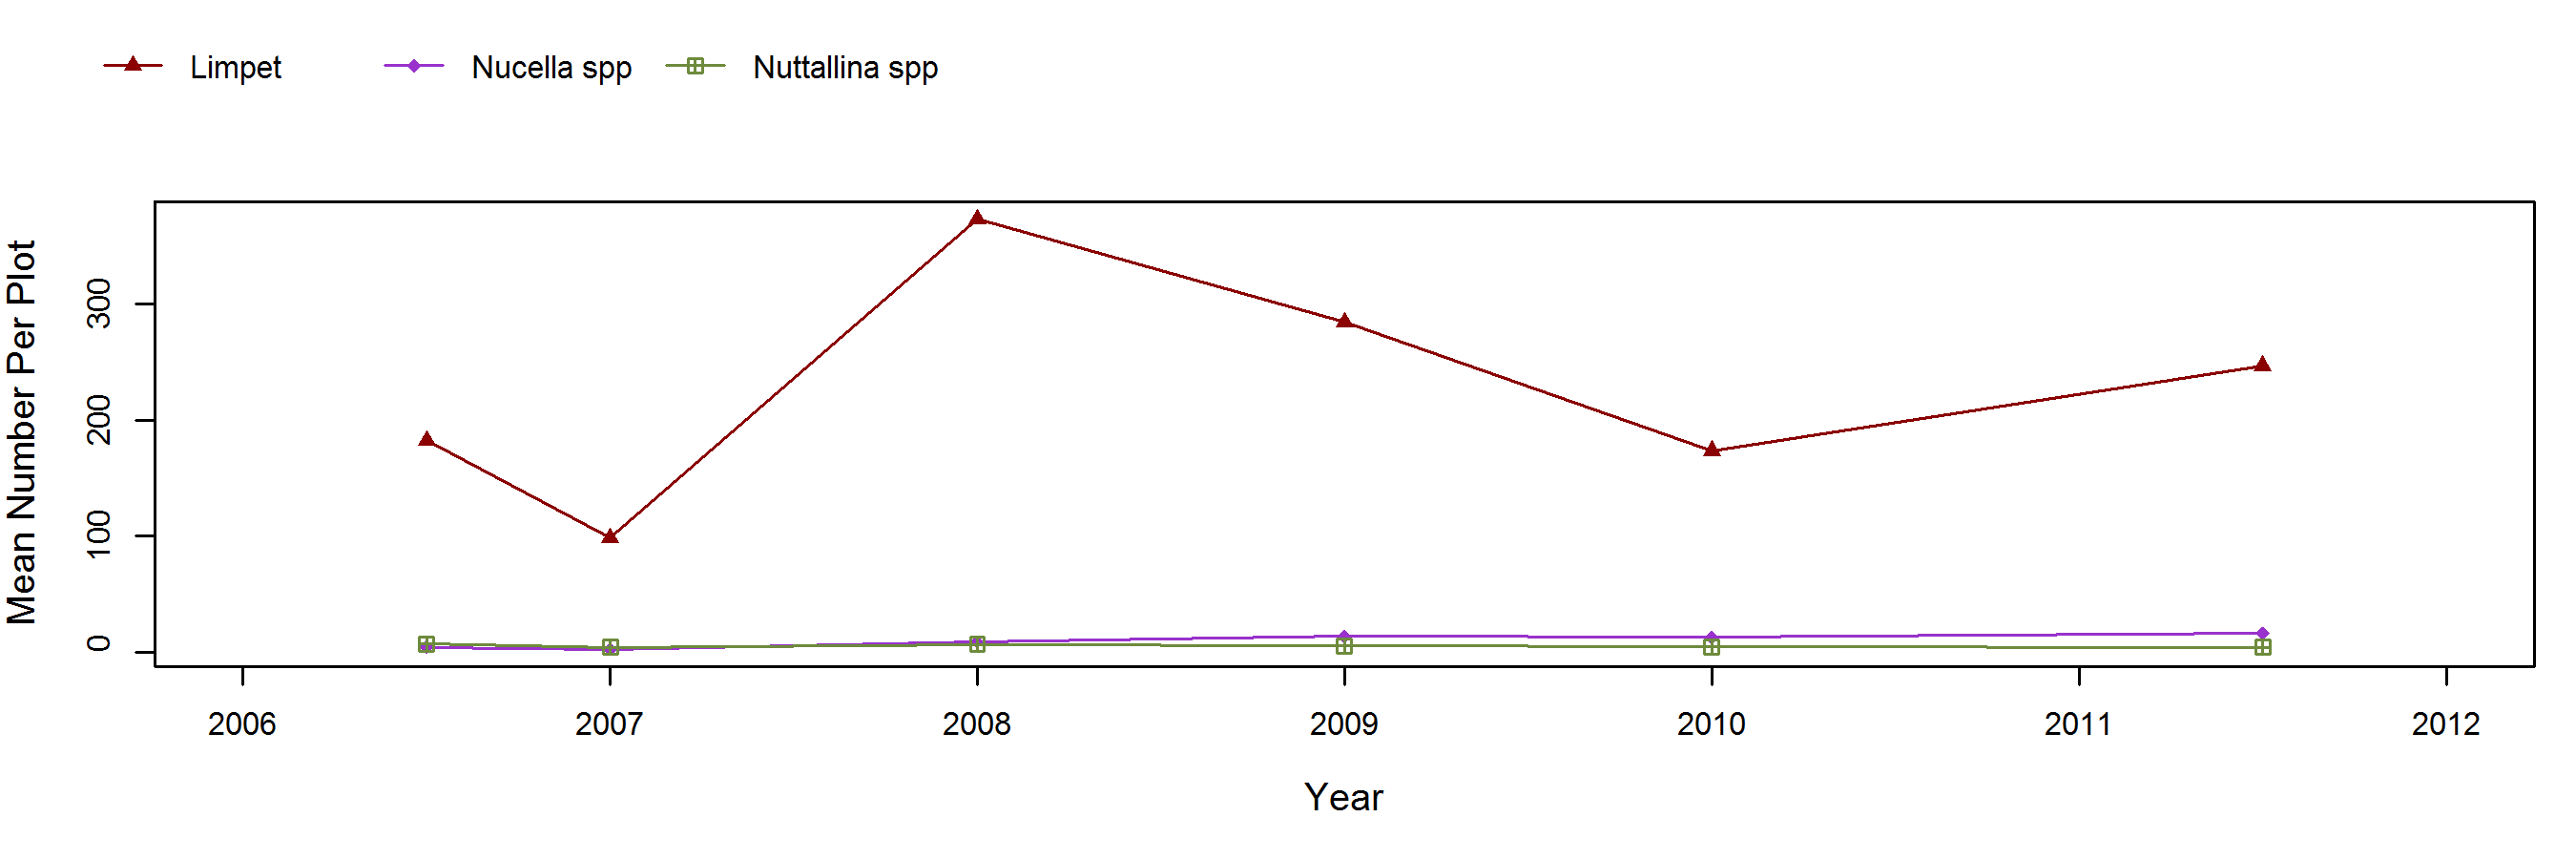
Chthamalus/Balanus (Acorn Barnacles) – motile invertebrate counts
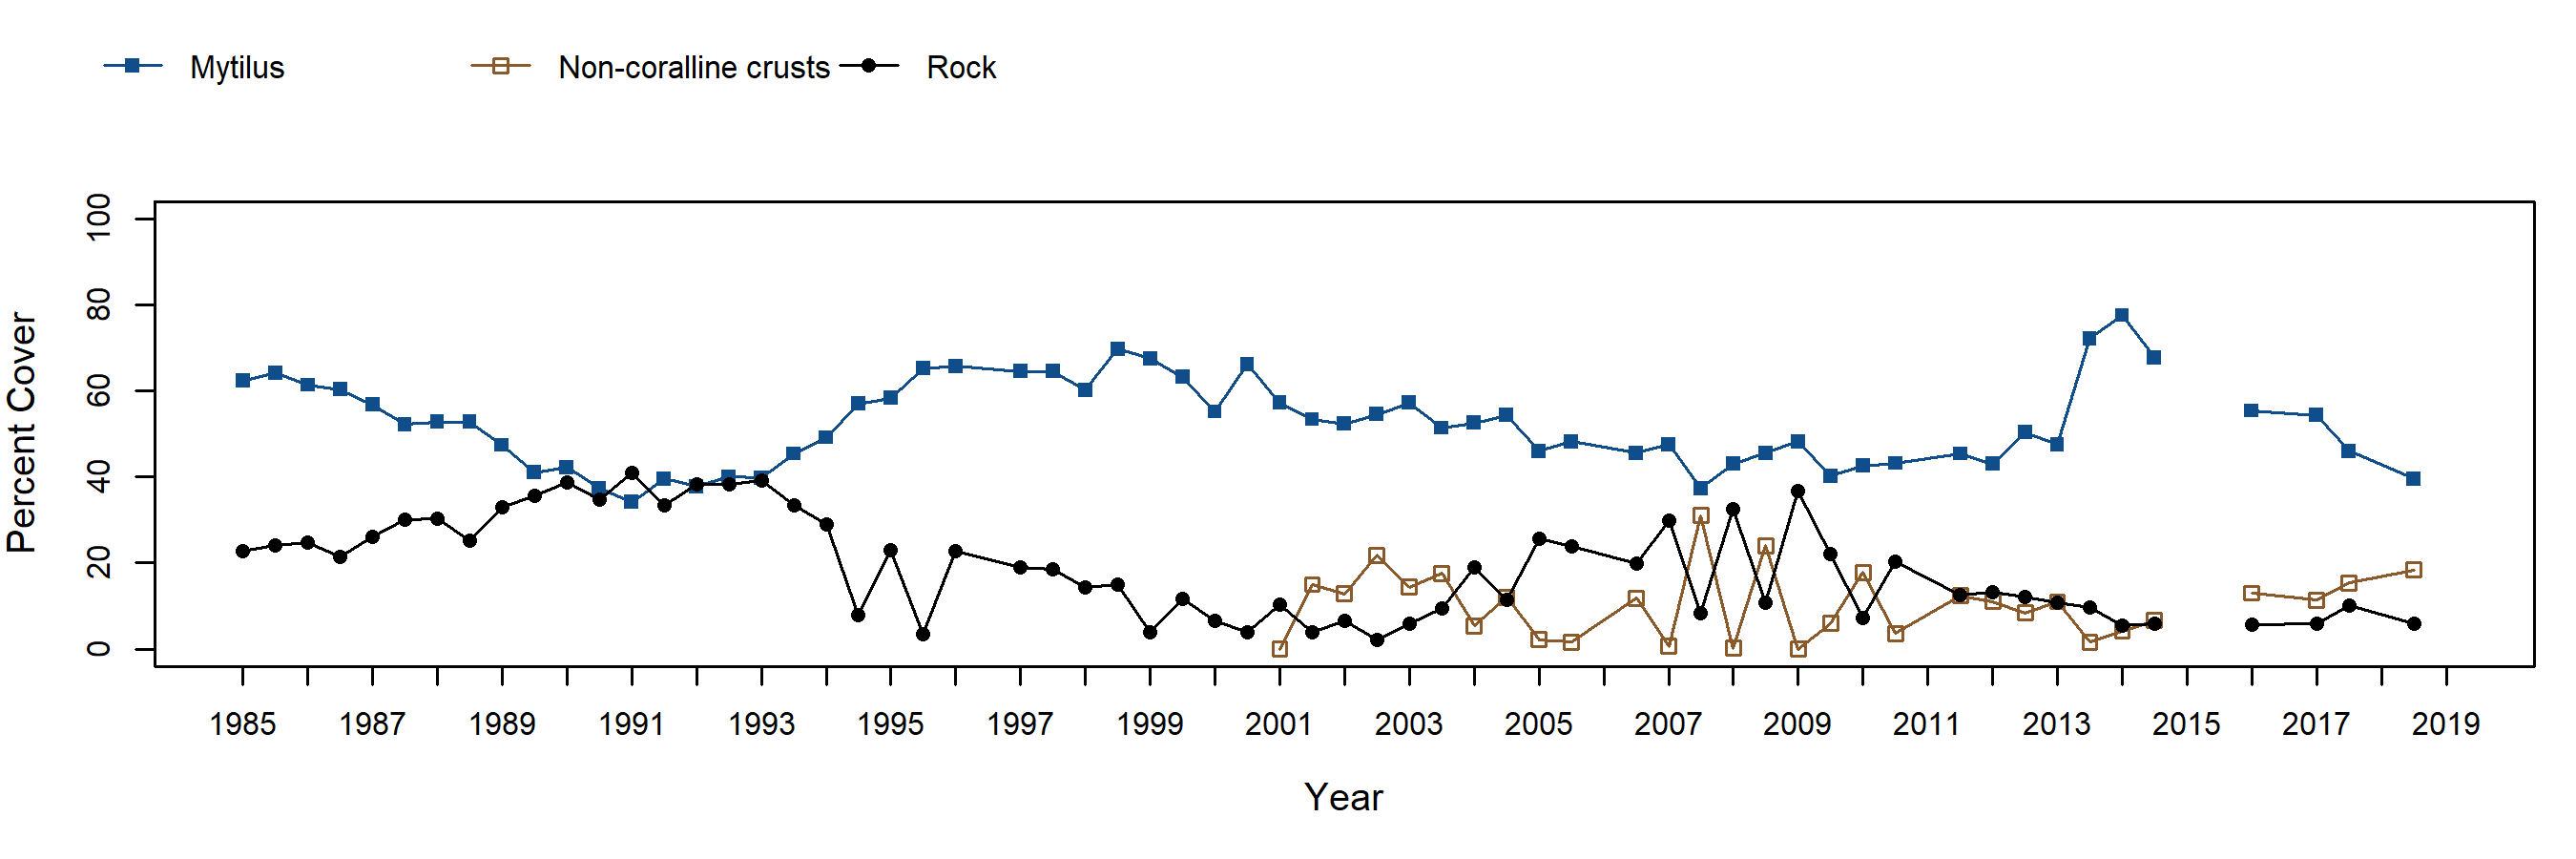
Mytilus (California Mussel) – percent cover
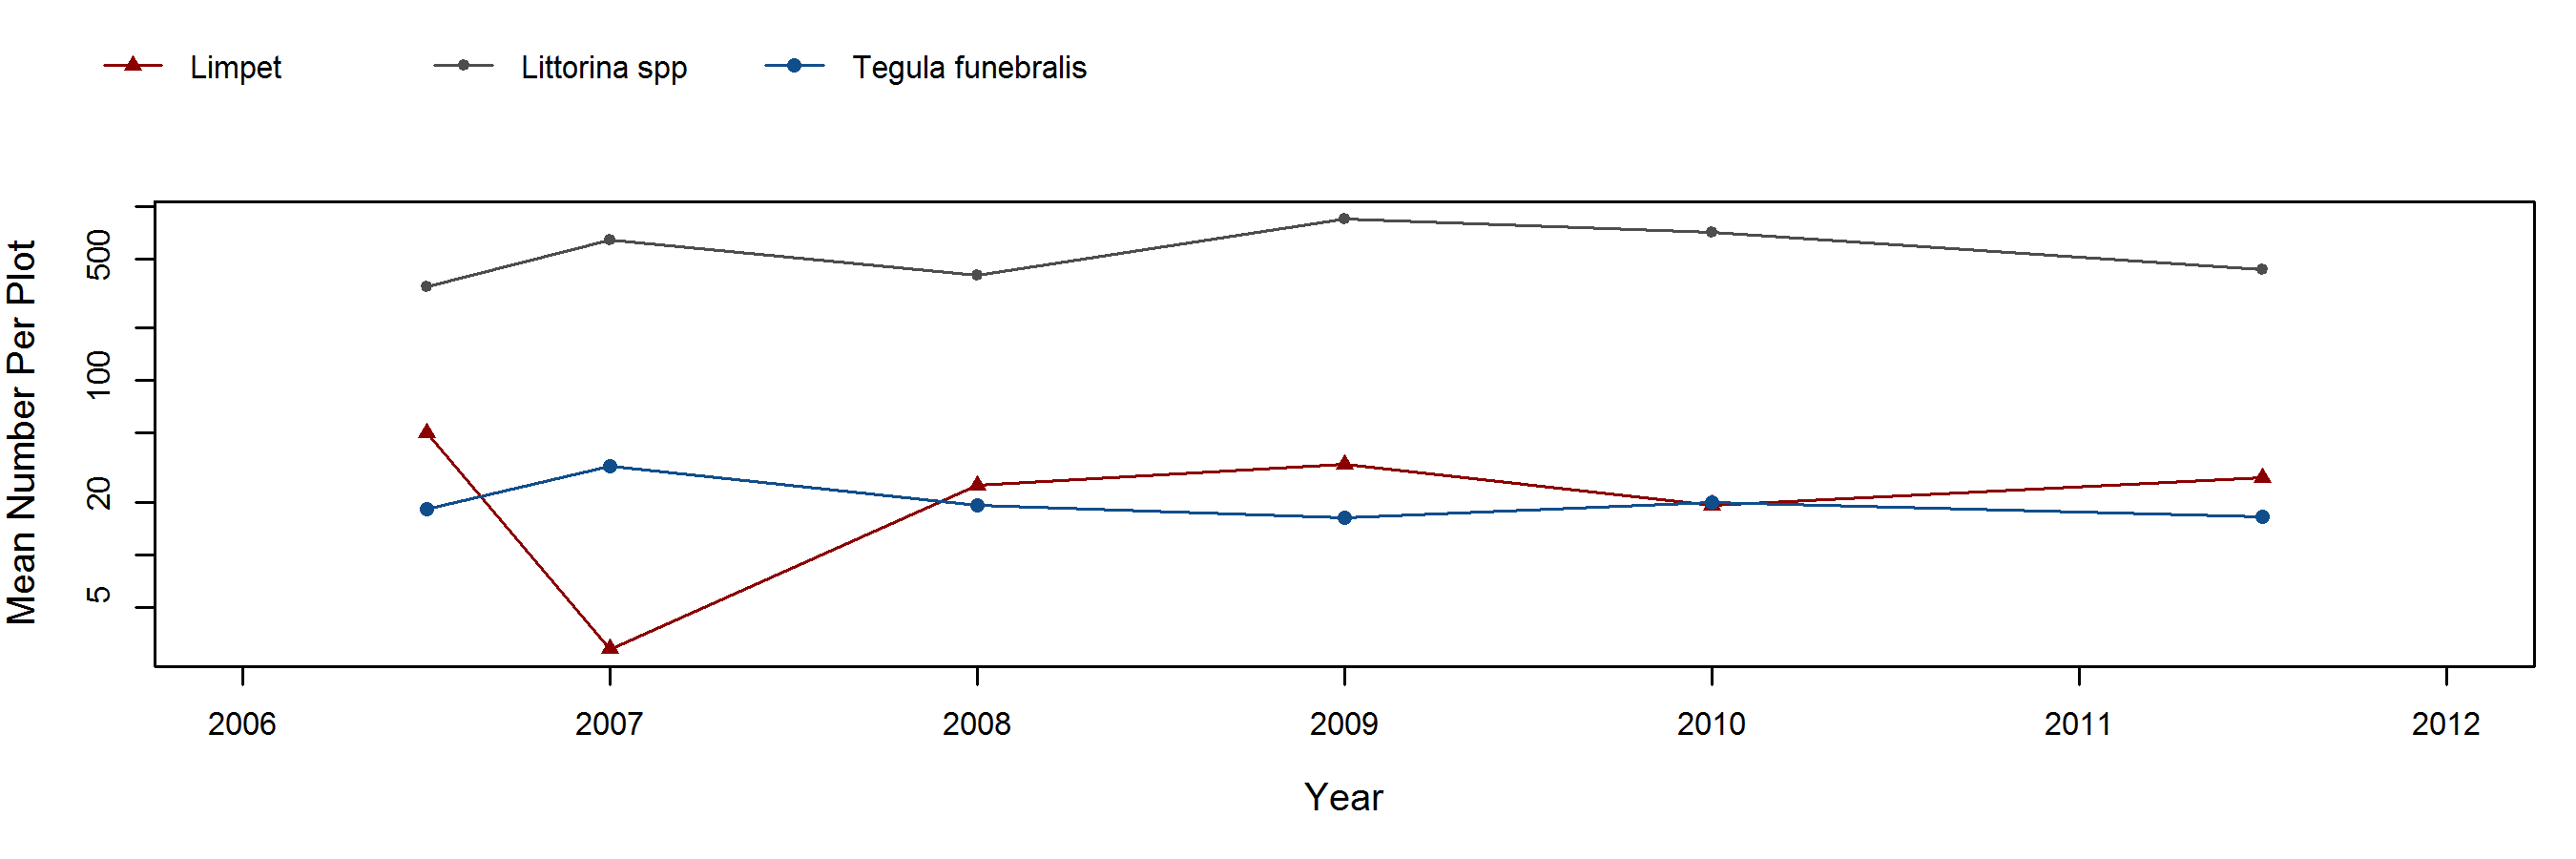
Mytilus (California Mussel) – motile invertebrate counts
Silvetia (Golden Rockweed) – percent cover
Silvetia (Golden Rockweed) – motile invertebrate counts
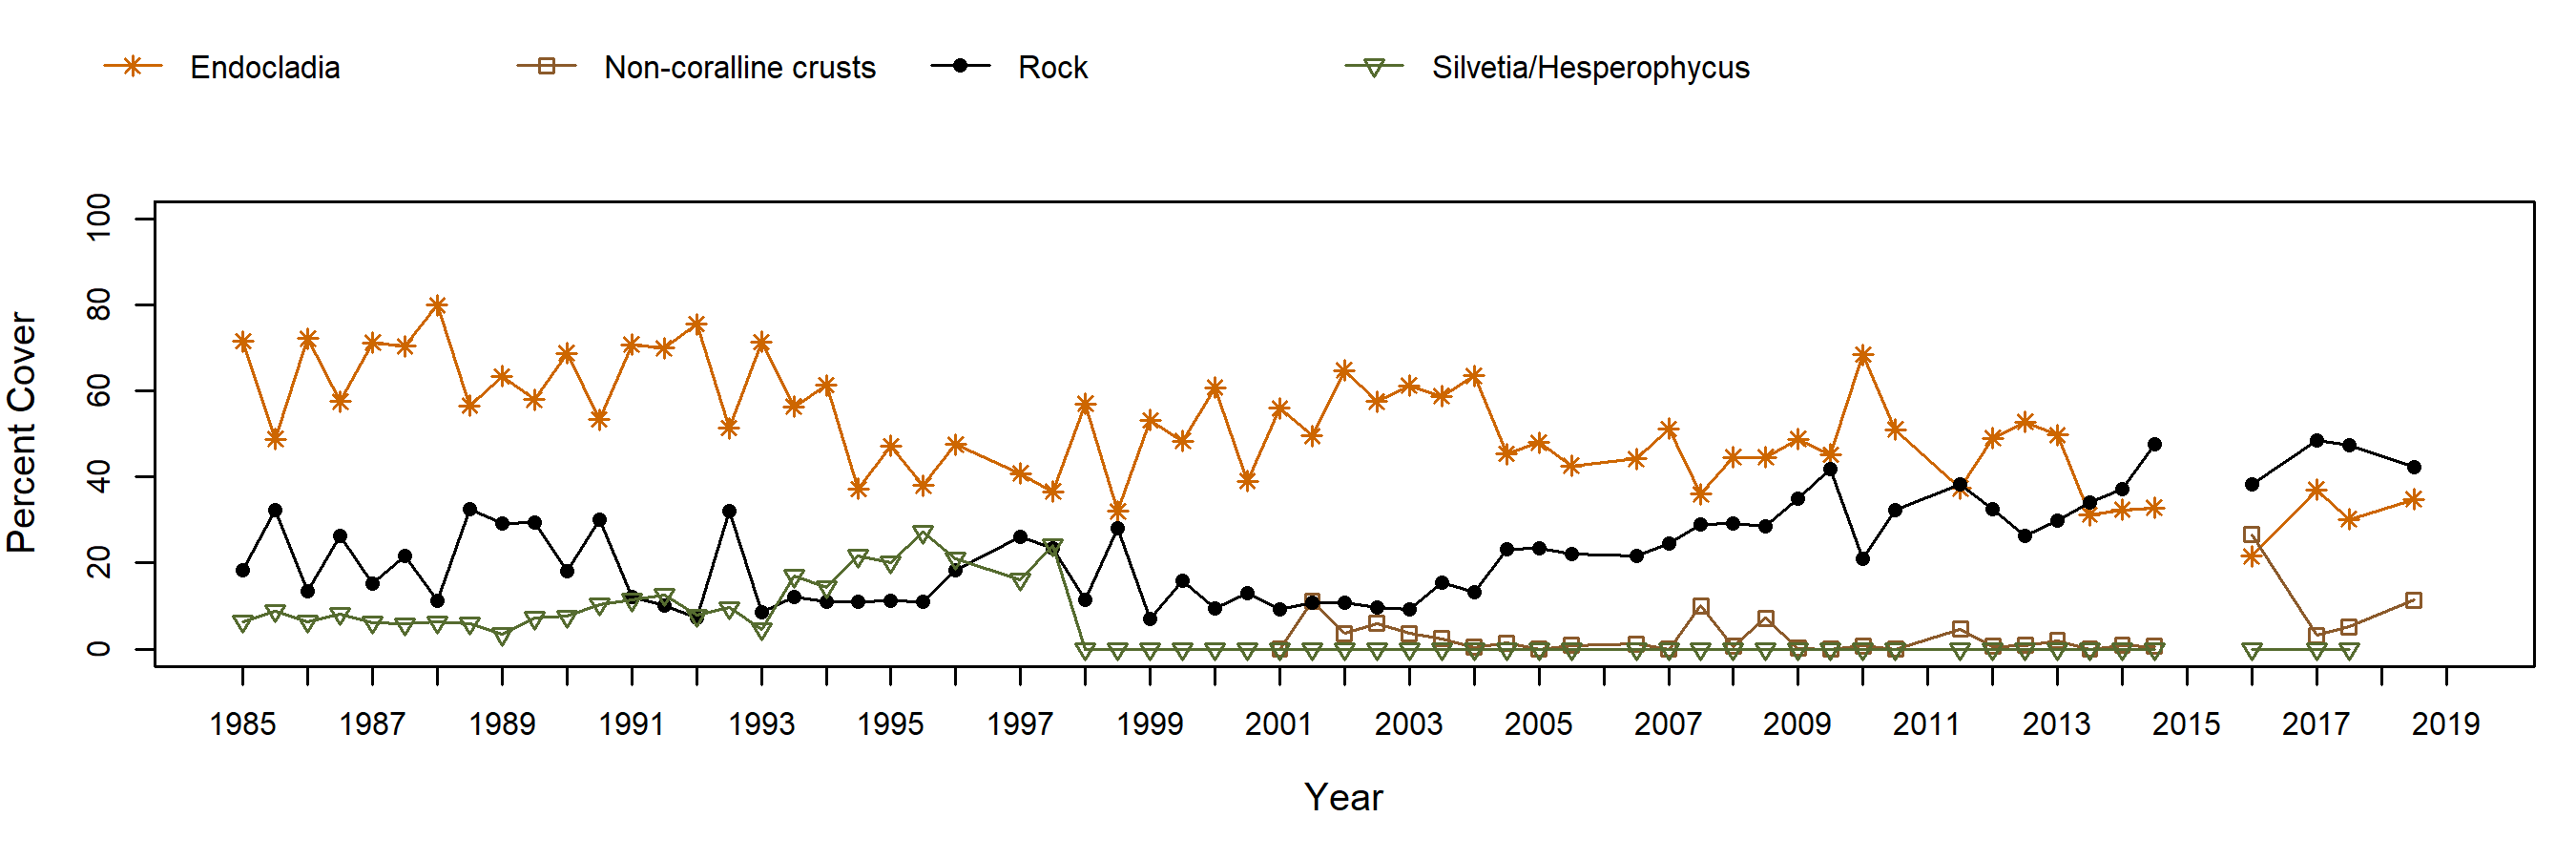
Endocladia (Turfweed) – percent cover
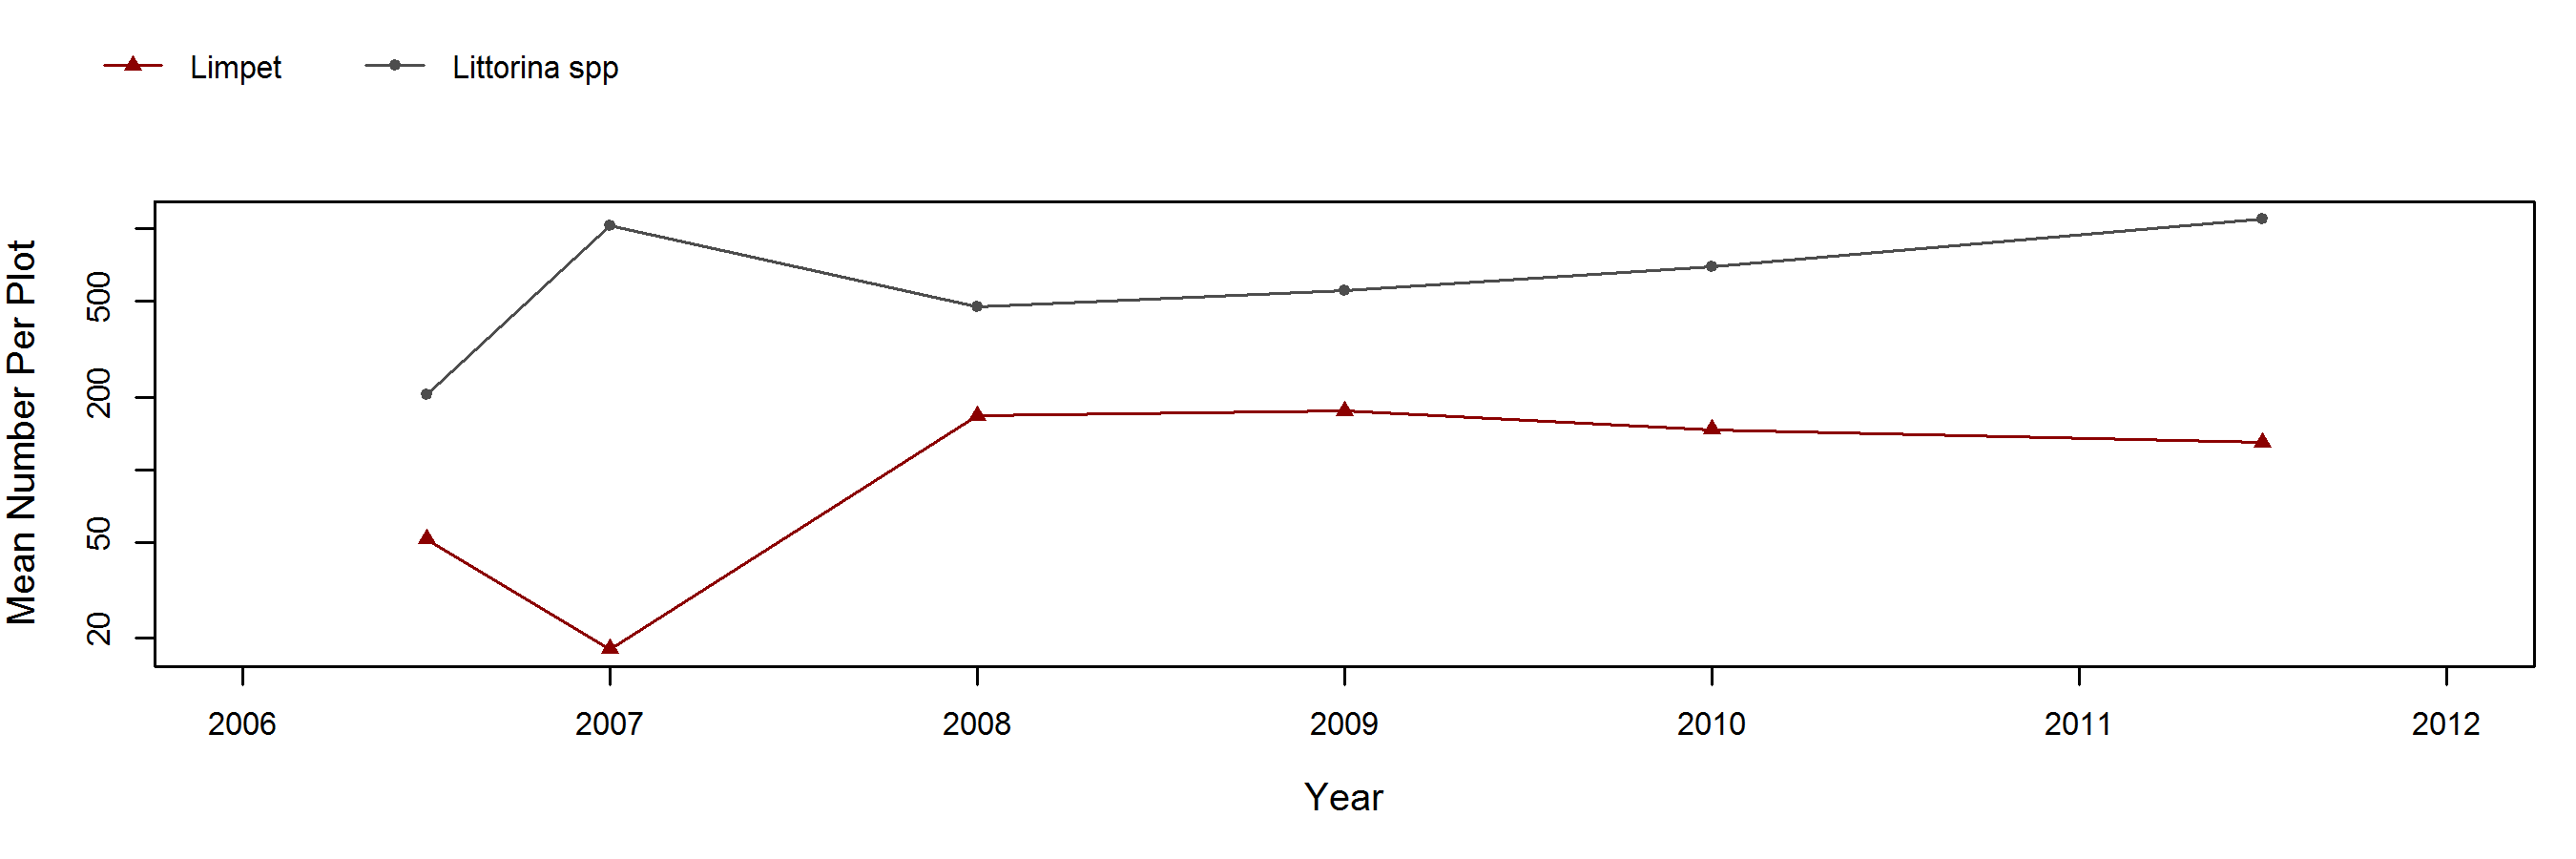
Endocladia (Turfweed) – motile invertebrate counts