Long-Term Monitoring Trend Graphs
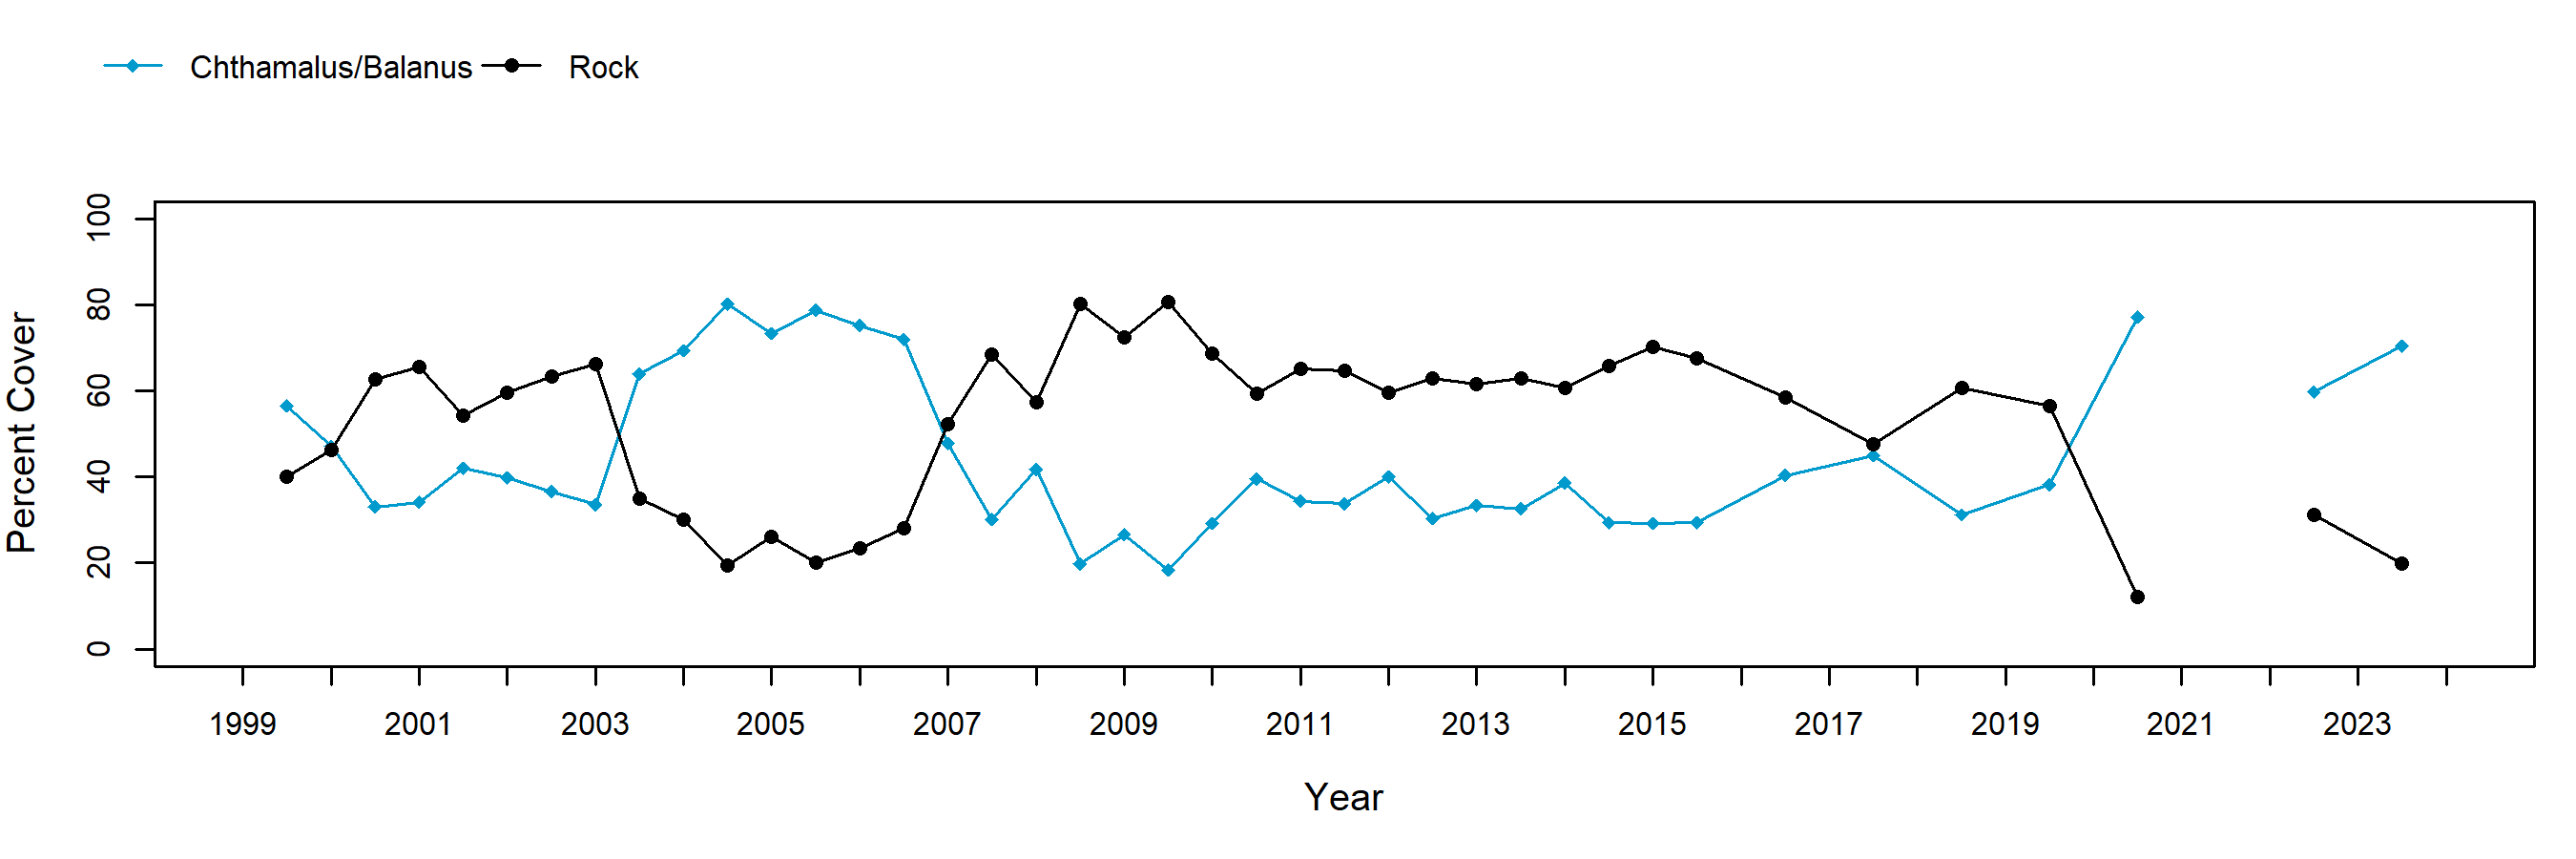
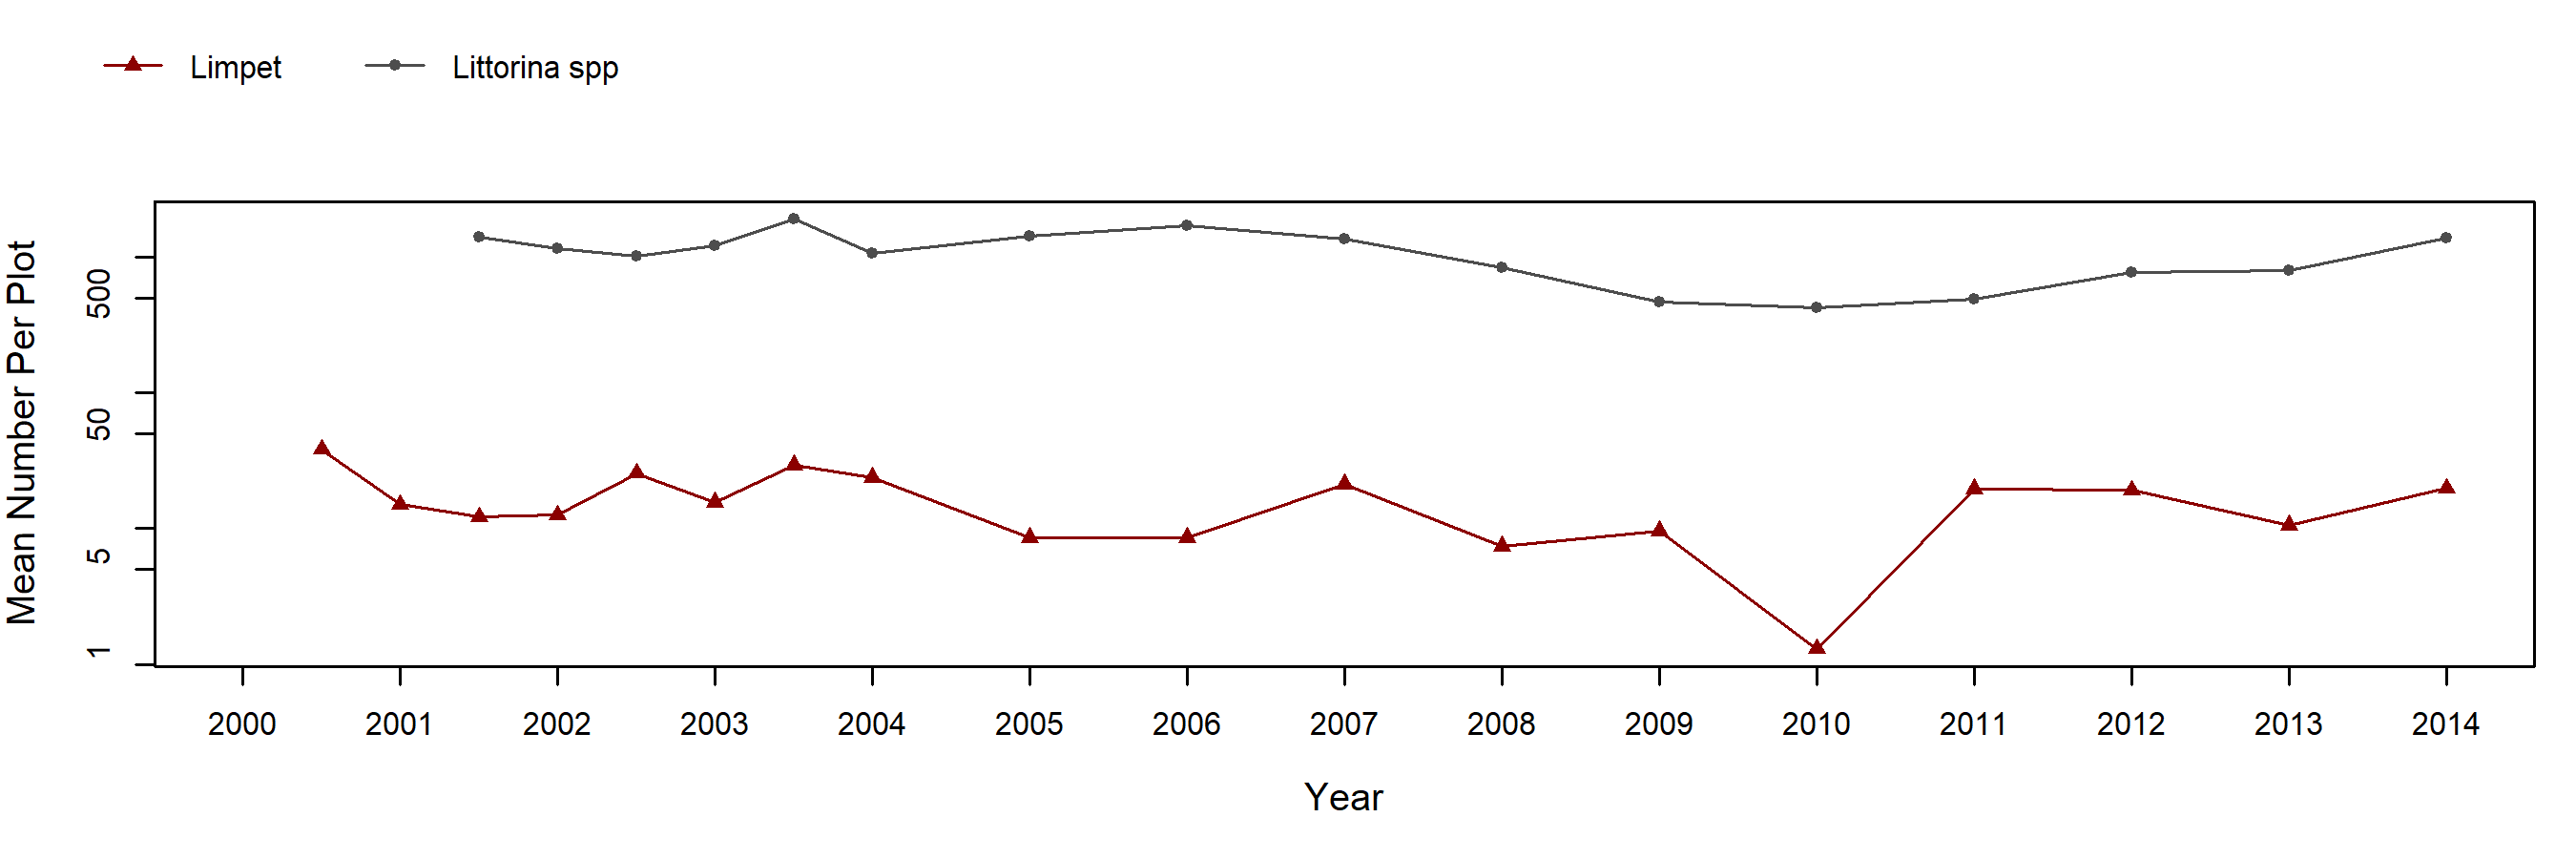
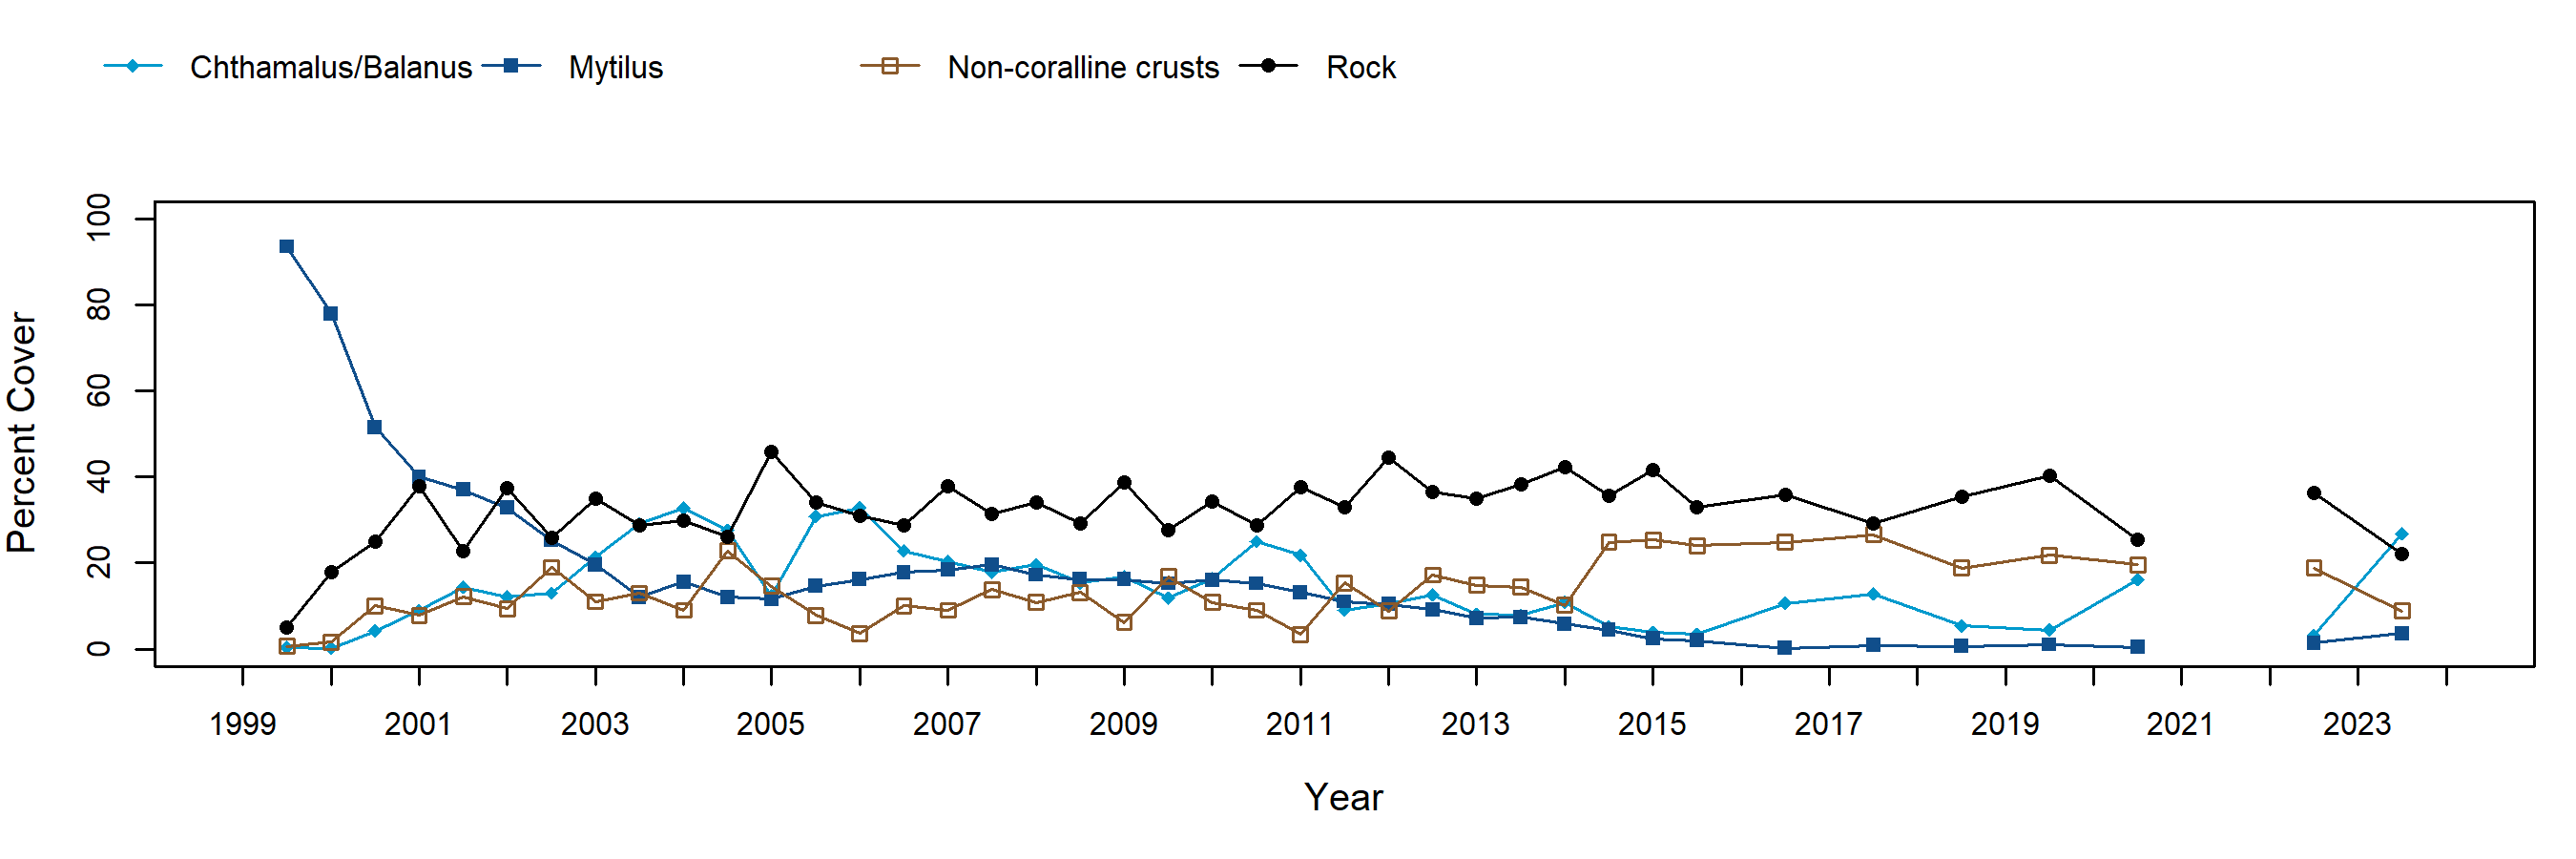
Barnacle cover in the Chthamalus/Balanus barnacle plots at Point Fermin has consisted primarily of Chthamalus dalli/fissus (note that Chthamalus and Balanus species were not distinguished until 2001). Cover of Chthamalus typically varied inversely with bare rock cover, with relatively little else occurring in these plots. Within the barnacle plots, littorine snails have been very abundant, consistently around 1,000 individuals per plot. Mussel cover in Mytilus plots has declined substantially at Point Fermin. These plots are representative of the surrounding reefs as widespread mussel bed contractions have occurred at this site, a phenomenon that has been reported elsewhere in southern California. As mussels declined, limpet abundance increased dramatically to around 1,000 individuals per plot. Within rockweed plots, Silvetia compressa cover has been seasonally variable (lower in spring and higher in fall), and steadily decreased until 2015, after which point percent cover has increased and remained steadily high (note that starting in 2016, plots were only sampled in fall). In the early years when motile invertebrates were counted seasonally, Cyanoplax chitons (including Cyanoplax hartwegii) that are common under the rockweed canopy exhibited seasonal variation in synchrony with Silvetia seasonal patterns. Rock (“Above Barnacles”) plots were added to this site in the fall of 2008 to document any upward spread of intertidal species as a result of sea level rise or other factors. From their inception, a few barnacles have been recorded within plots, most within cracks and crevices.
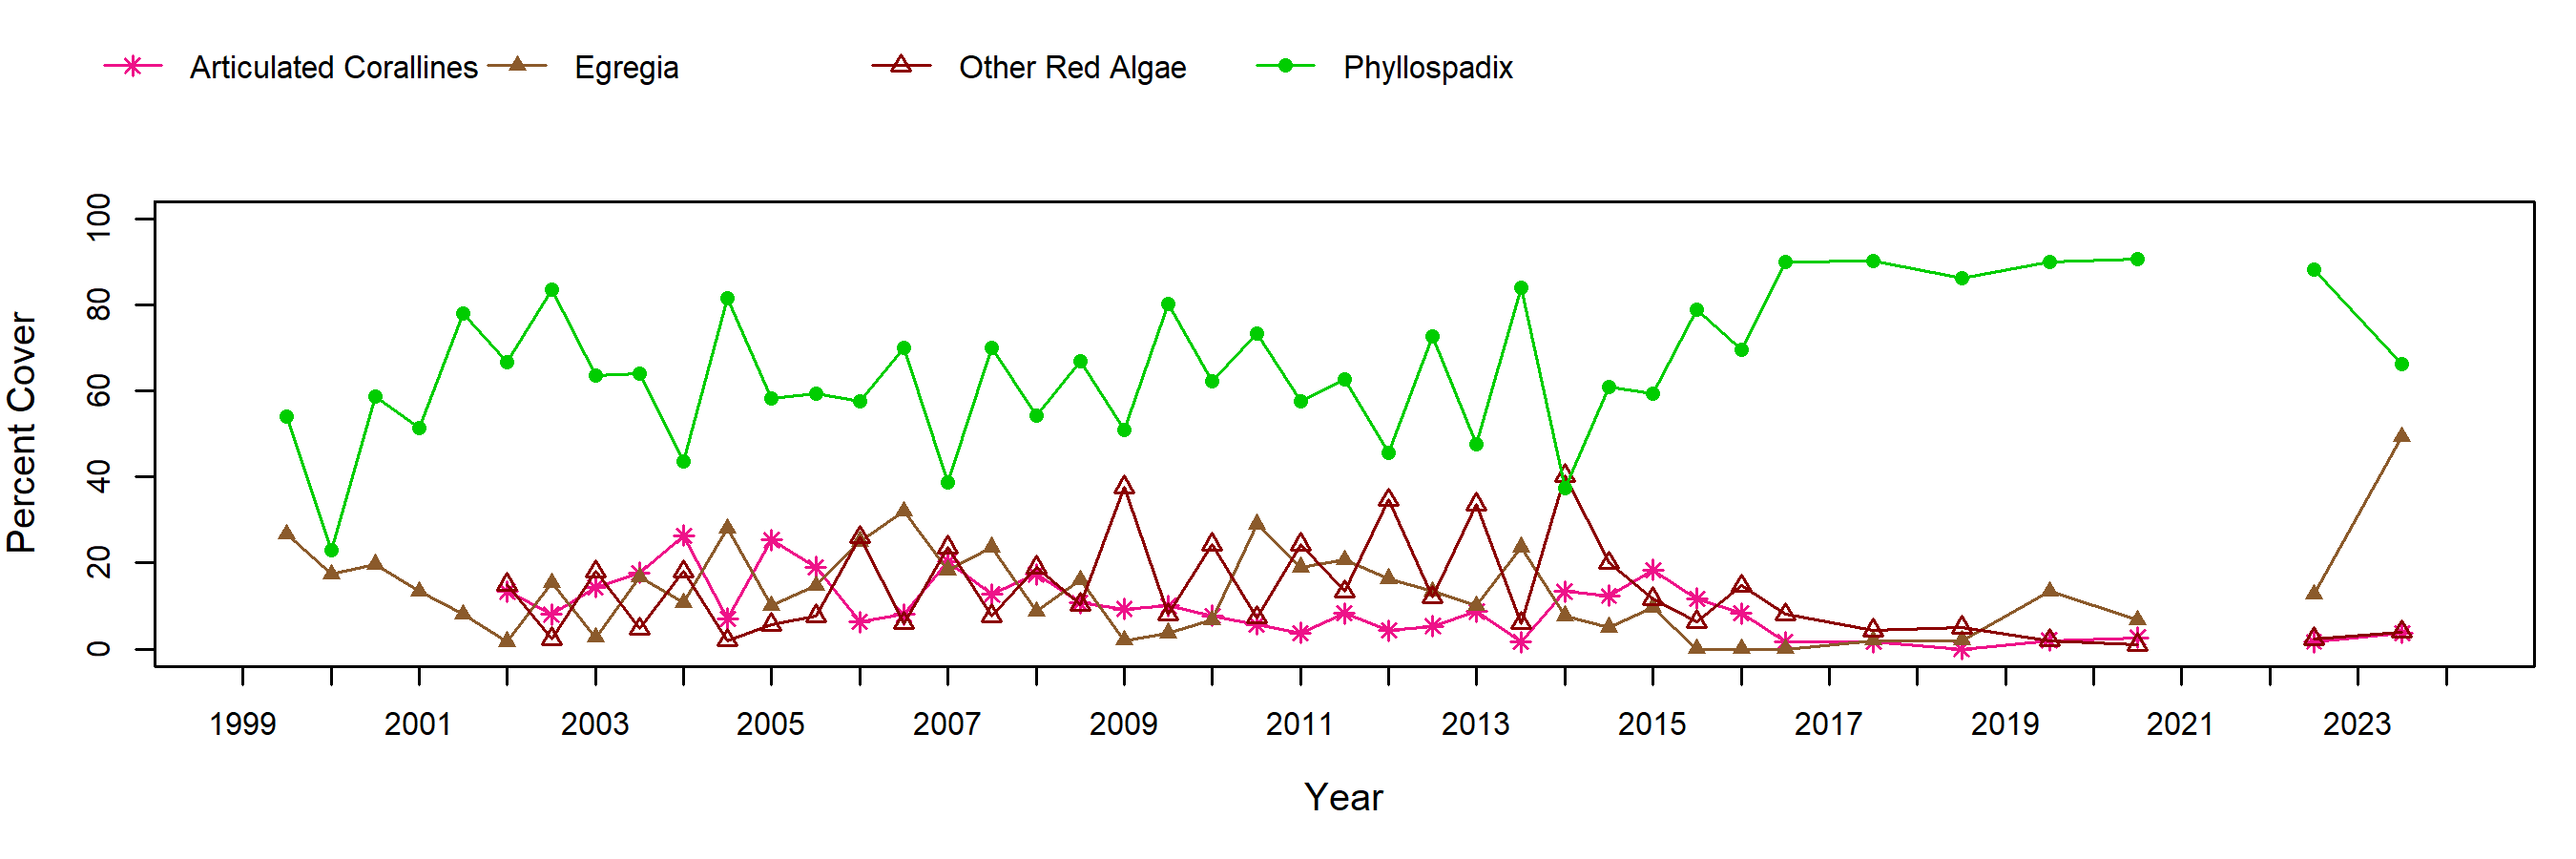
Surfgrass (Phyllospadix spp.) cover from transect sampling has shown relatively consistent seasonal variation (lower in spring, higher in fall). After sampling was reduced to once a year in 2016, surfgrass cover was consistently high until Fall 2022, at which point surfgrass cover began to decline.
Sea star (Pisaster ochraceus) plots were added to this site in the spring of 2003 and consist of three large irregular plots surrounding an area of medium relief rock, which includes several cracks and ledges. Sea stars were common at this site when these plots were initiated but rapidly declined over the next two years. These plots are likely representative of the site as a whole given concurrent sitewide searches also yielded few sea stars. Sea Star Wasting Syndrome struck this site some time in advance of our fall 2013 sampling based on other local reports of diseased stars subtidally, and a die-off of sea stars at the adjacent Cabrillo Marine Aquarium. During our fall 2013 sampling, no sea stars could be found at the site, either in the fixed plots or in sitewide searches. As of fall 2024, sea stars remain absent from the site. The size measures of seastars indicated a high frequency of small sea stars during the first sampling seasons in 2003, possibly due to a large recruitment pulse occurring in preceding years. By spring 2004, the size distribution exhibited a relatively even frequency among small to large sized individuals. Recruitment has been relatively low since 2004.
In order to standardize species resolution across all MARINe groups and over time, some species (typically rare) were lumped for graphical presentation of Long-Term monitoring data. See lumped categories for definitions (some variation occurs between methods and over time).
If you experience any barriers accessing the trend graphs below, please contact (pacificr@ucsc.edu) for help.
Photo Plots

Below are the trends observed for each Photo Plot target species at this site. Long-Term percent cover trend graphs also include any species that reached a minimum of 25% cover during any single point in time within a given target species assemblage. Breaks in trend lines represent missed sampling events. For additional species observed that did not meet this 25% threshold, please use the Graphing Tool.
Chthamalus/Balanus (Acorn Barnacles) – percent cover
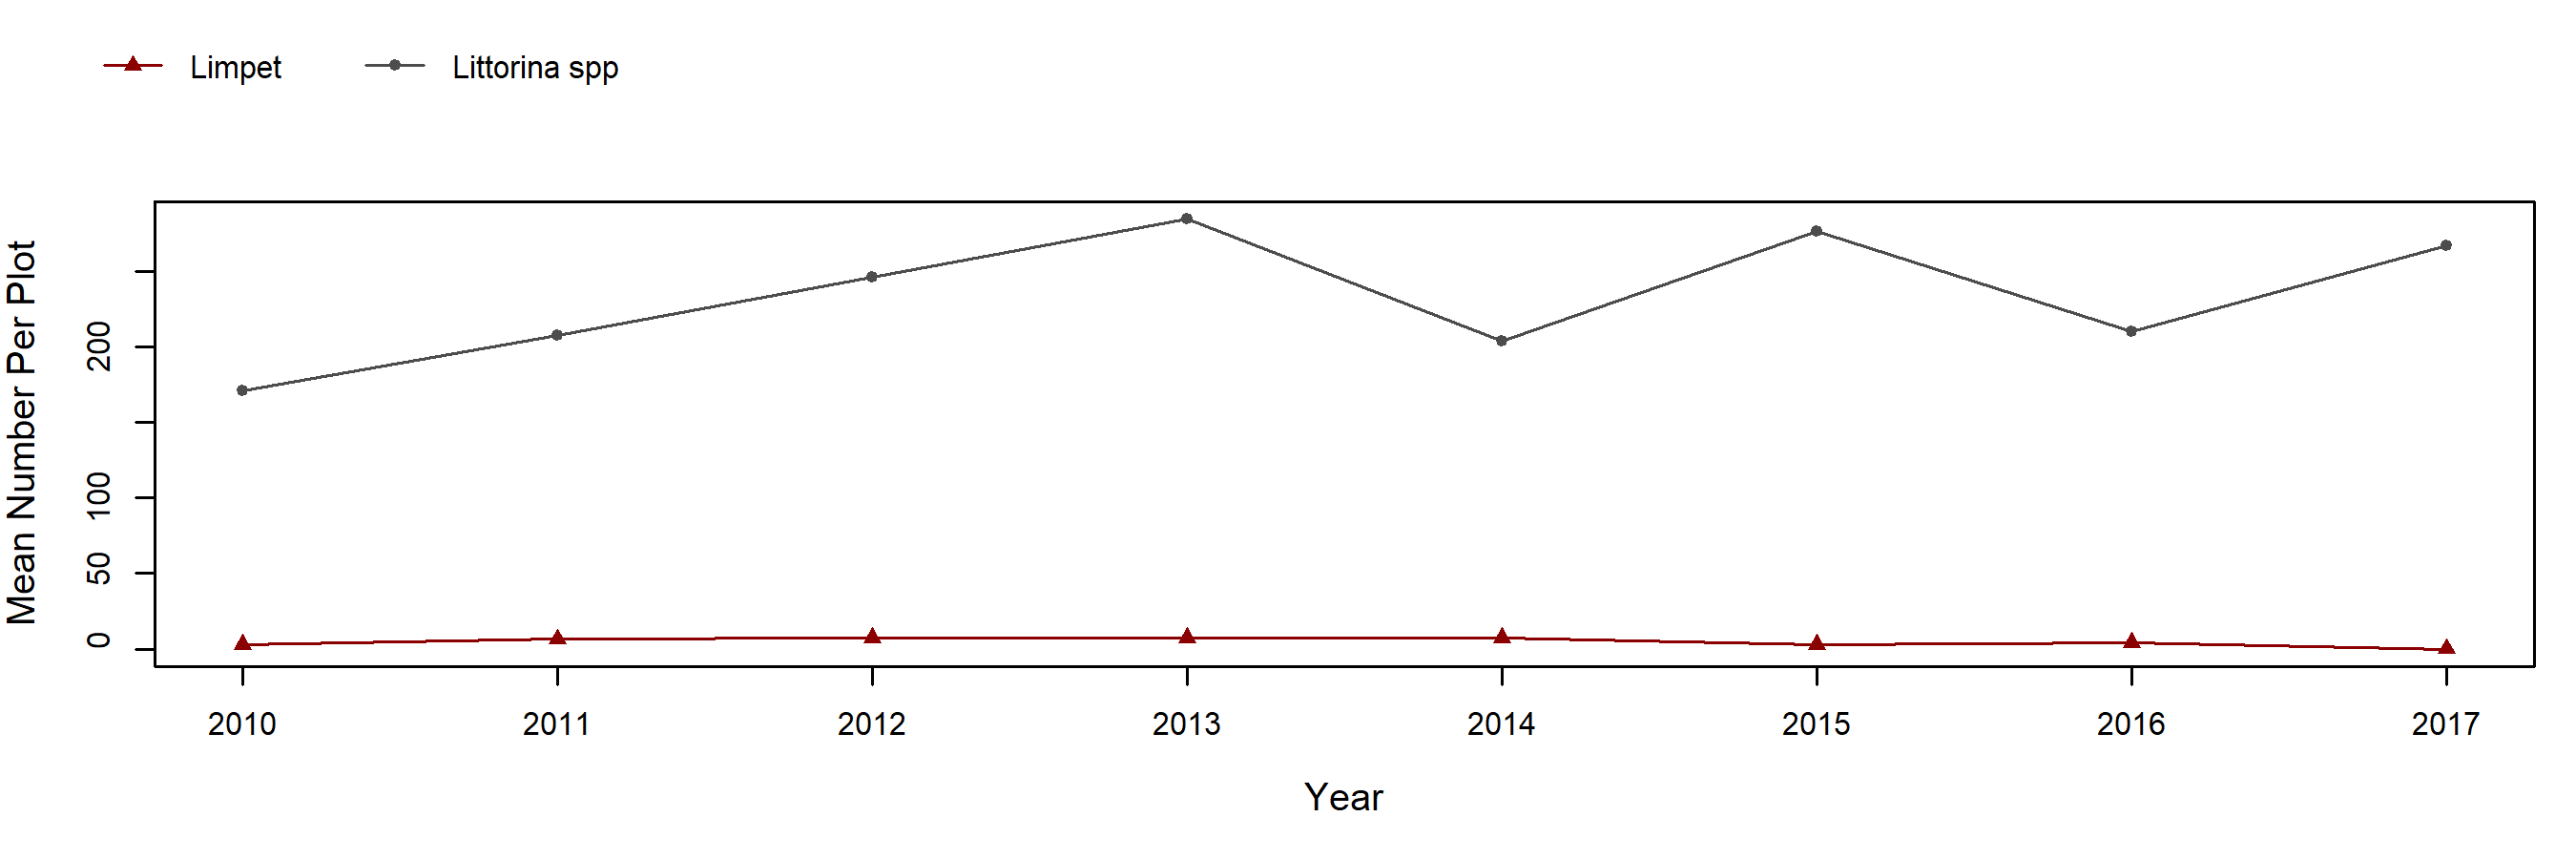
Chthamalus/Balanus (Acorn Barnacles) – motile invertebrate counts
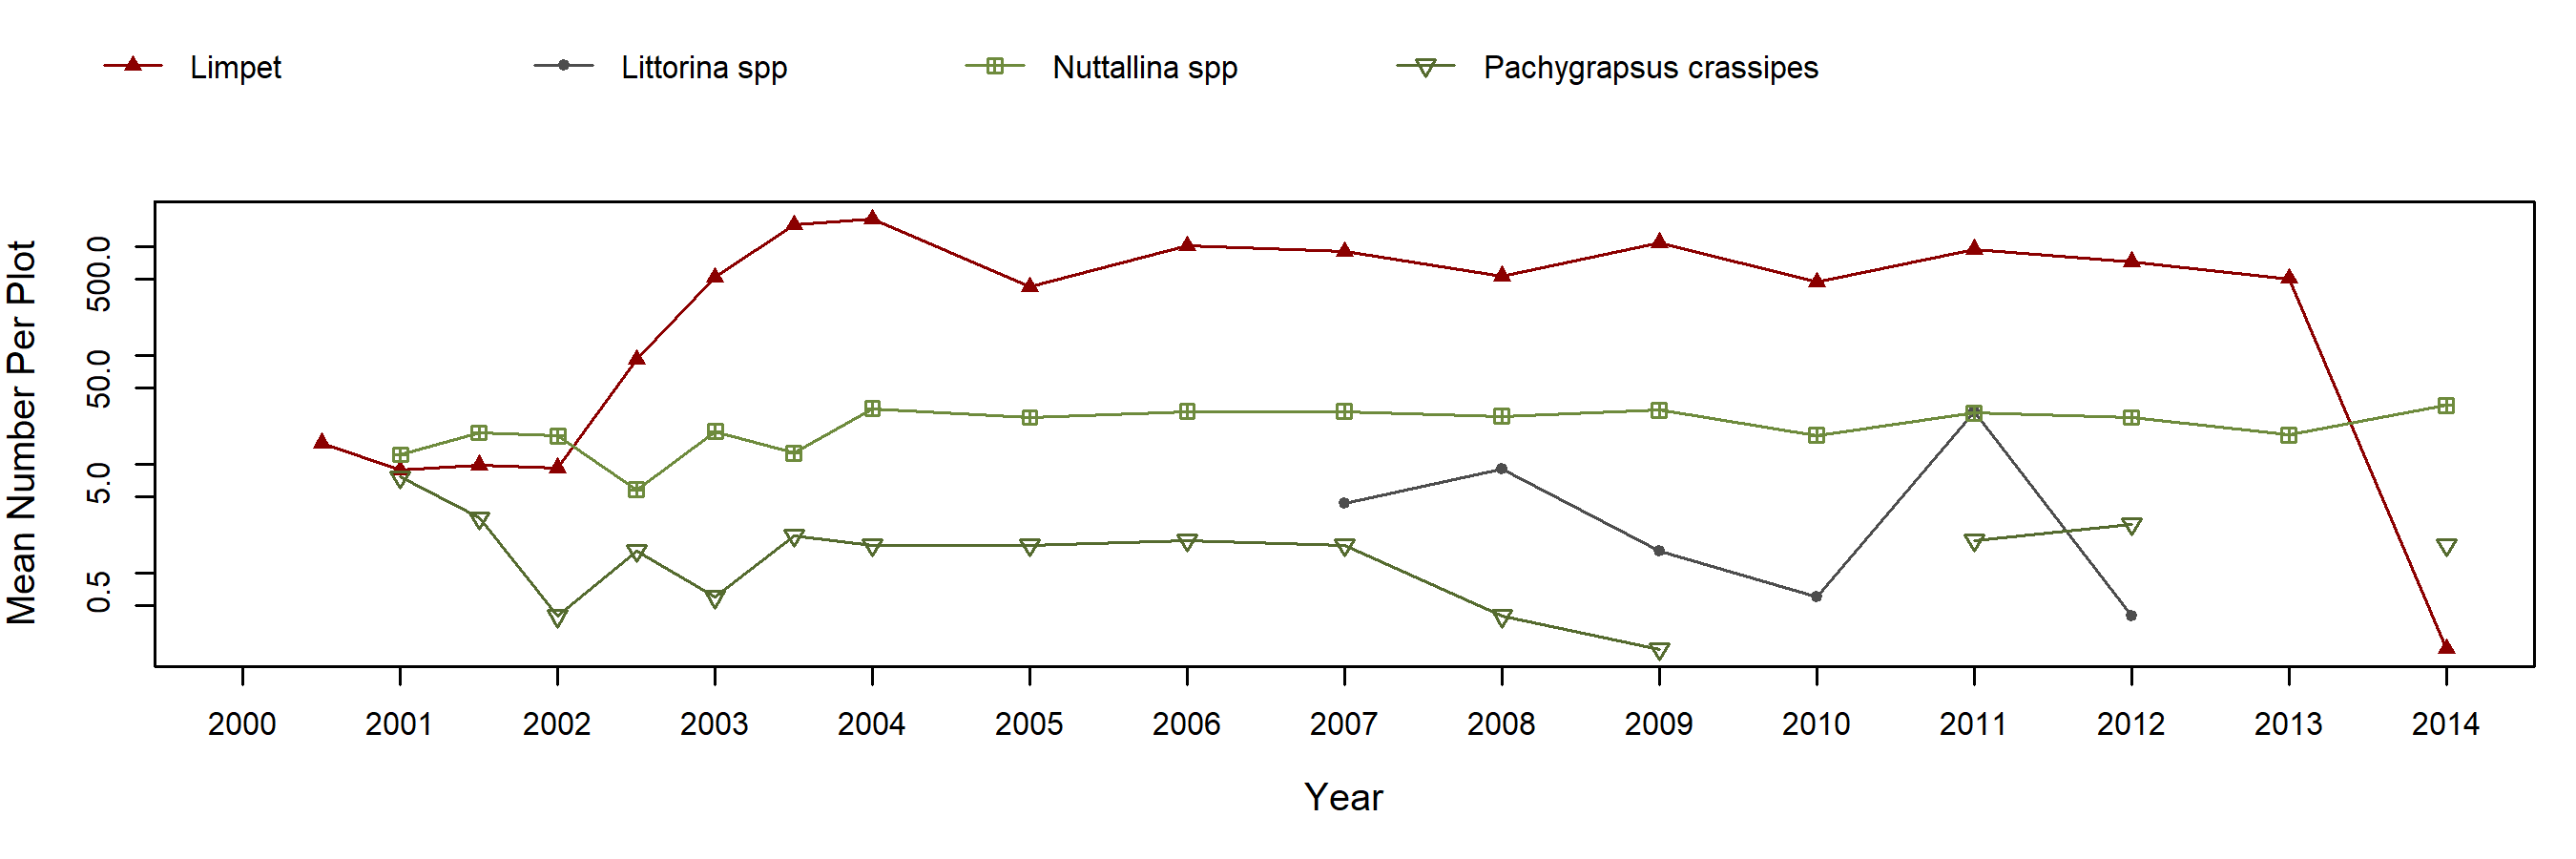
Mytilus (California Mussel) – percent cover
Mytilus (California Mussel) – motile invertebrate counts
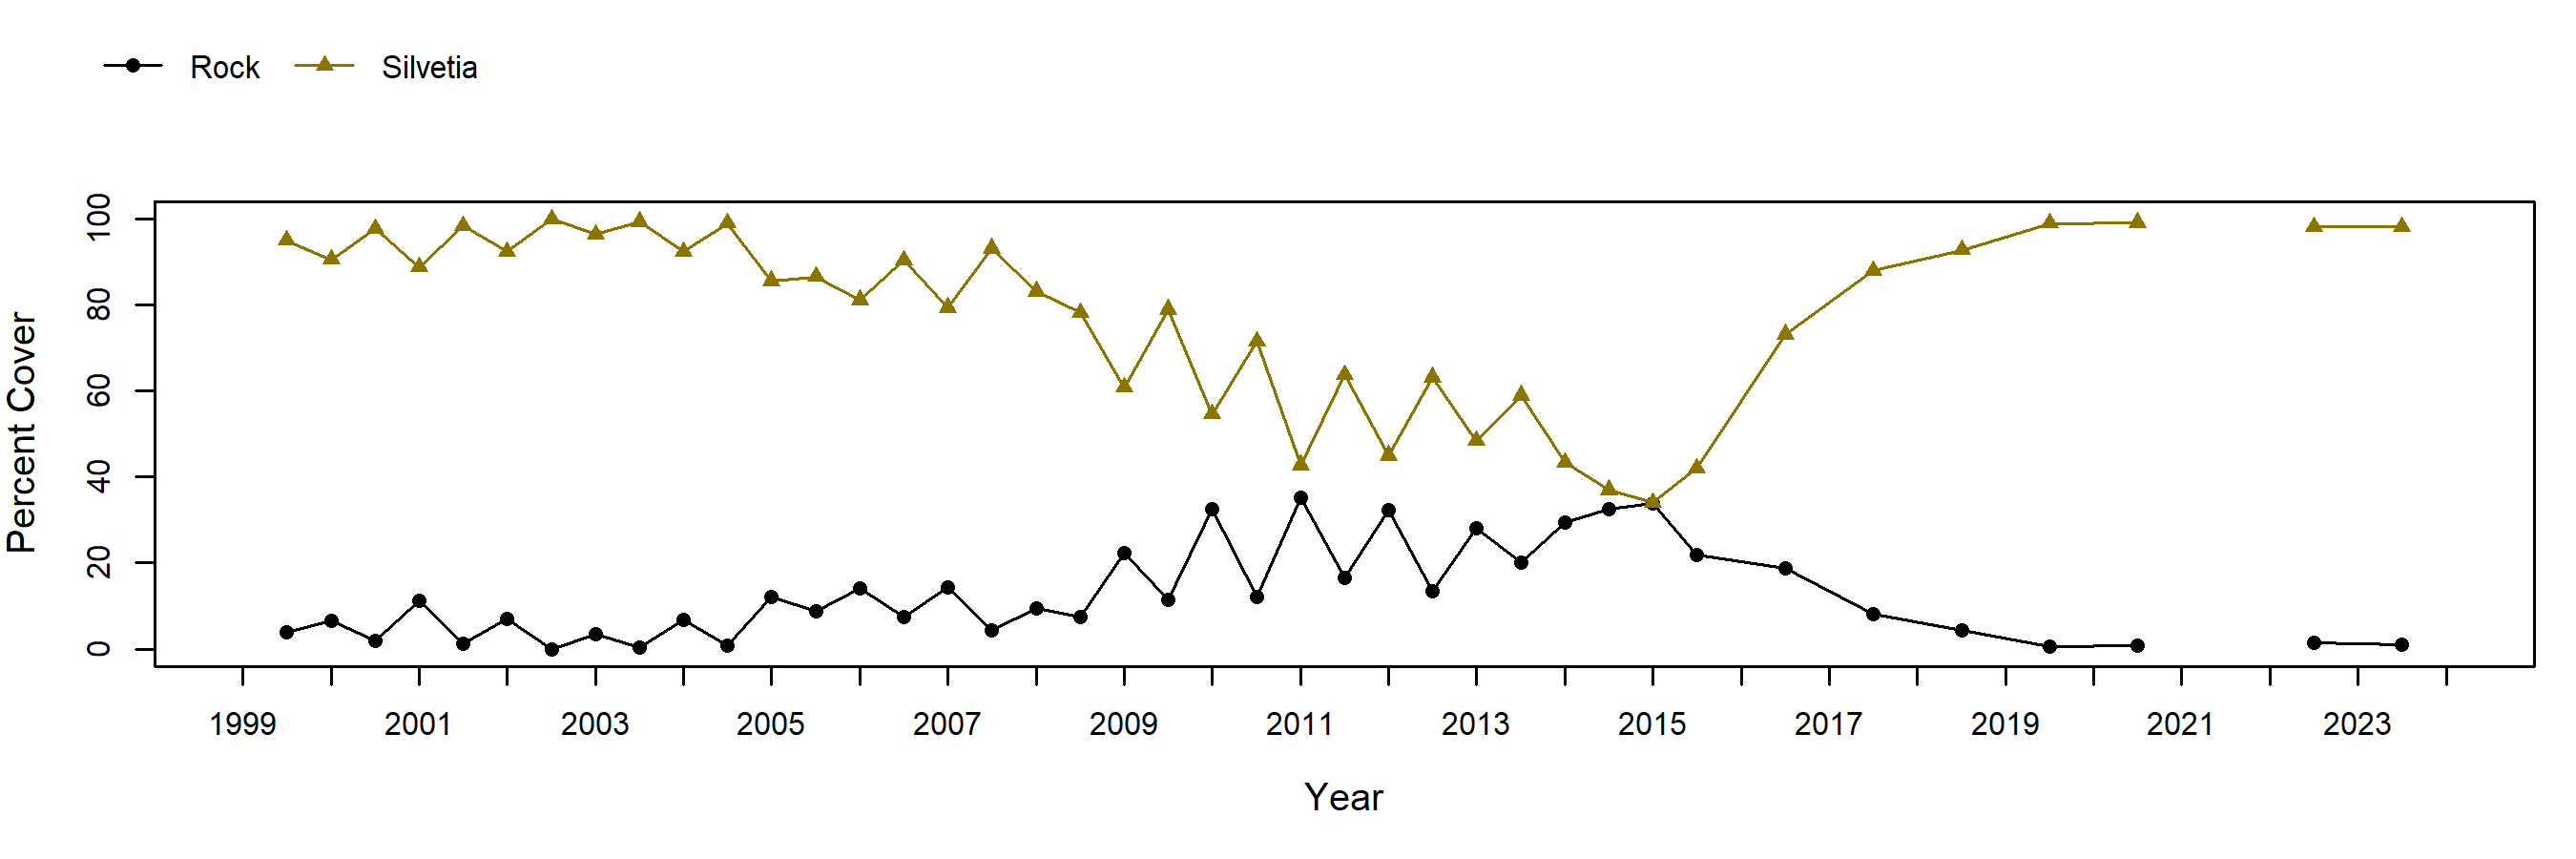
Silvetia (Golden Rockweed) – percent cover
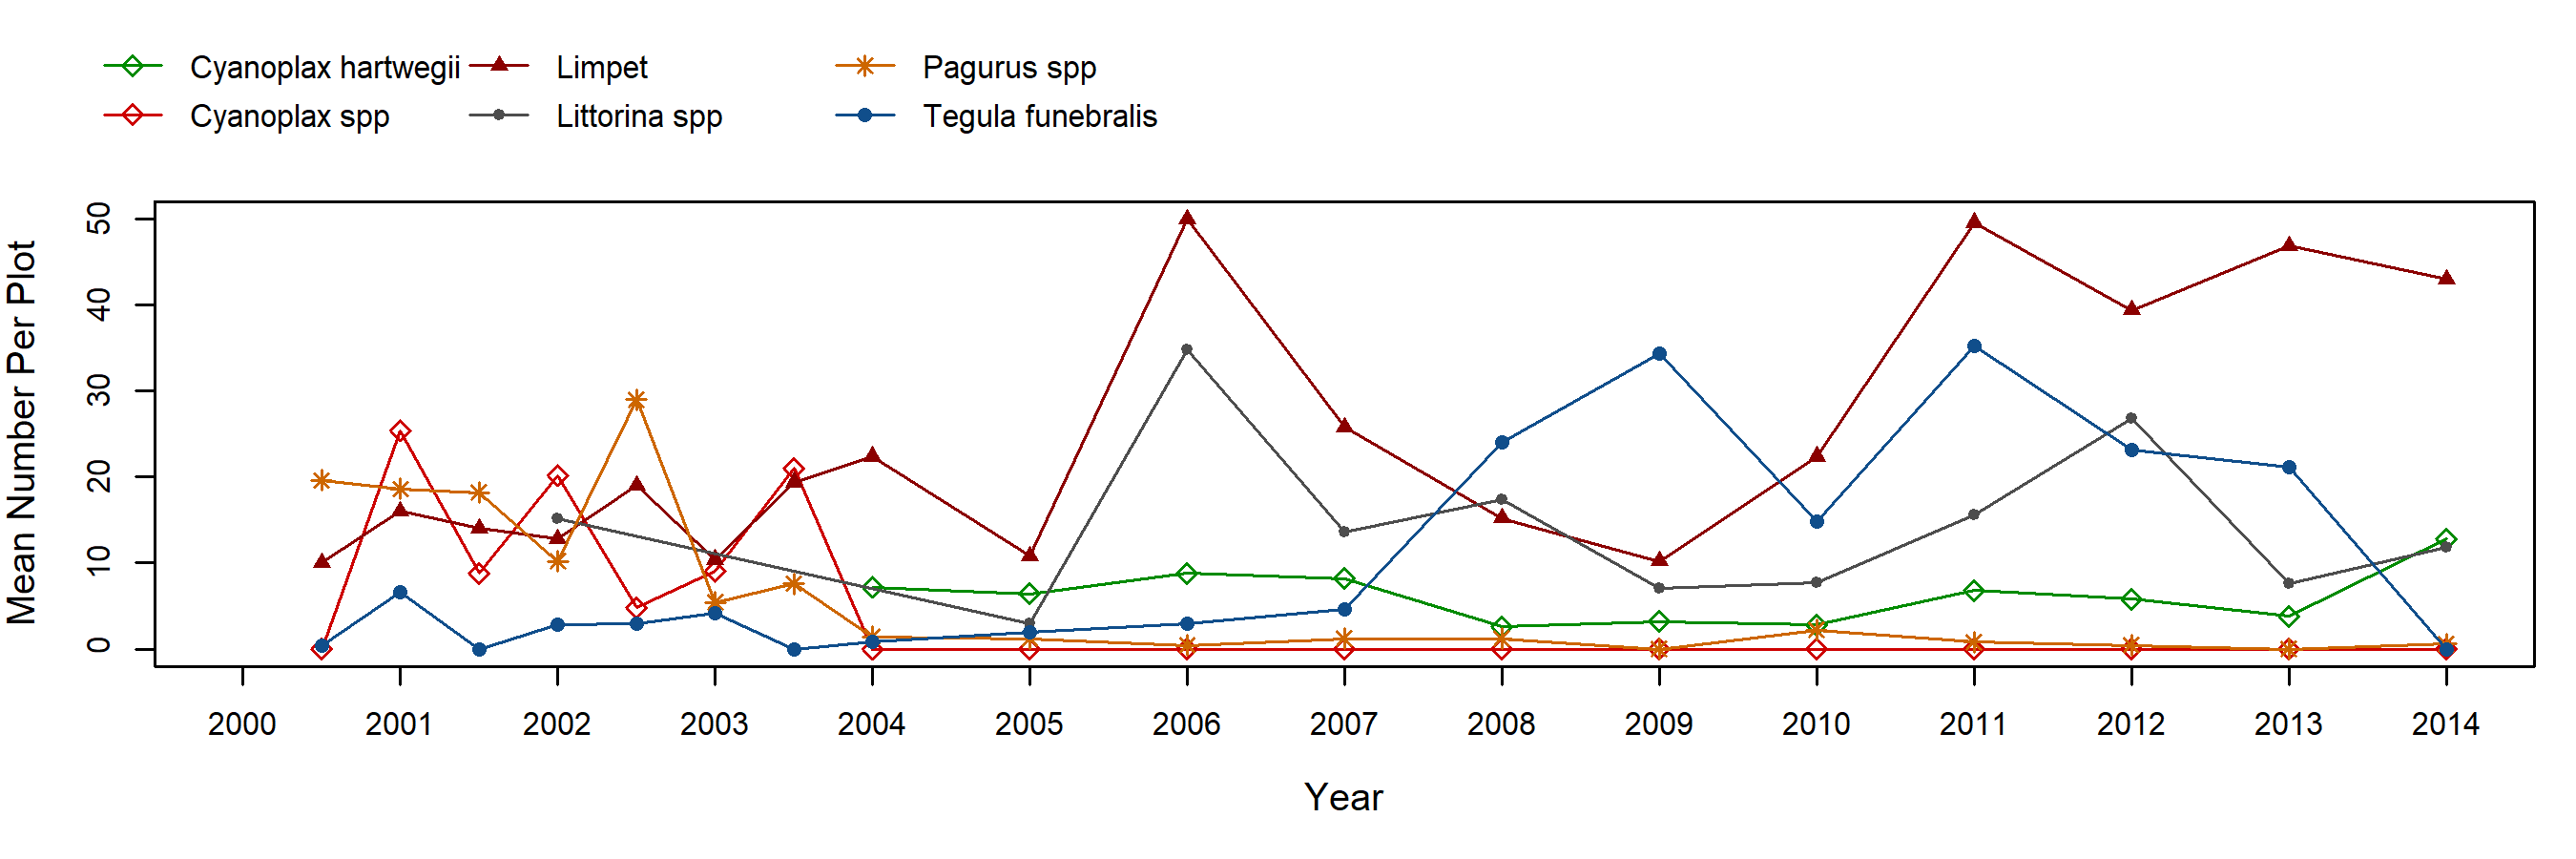
Silvetia (Golden Rockweed) – motile invertebrate counts
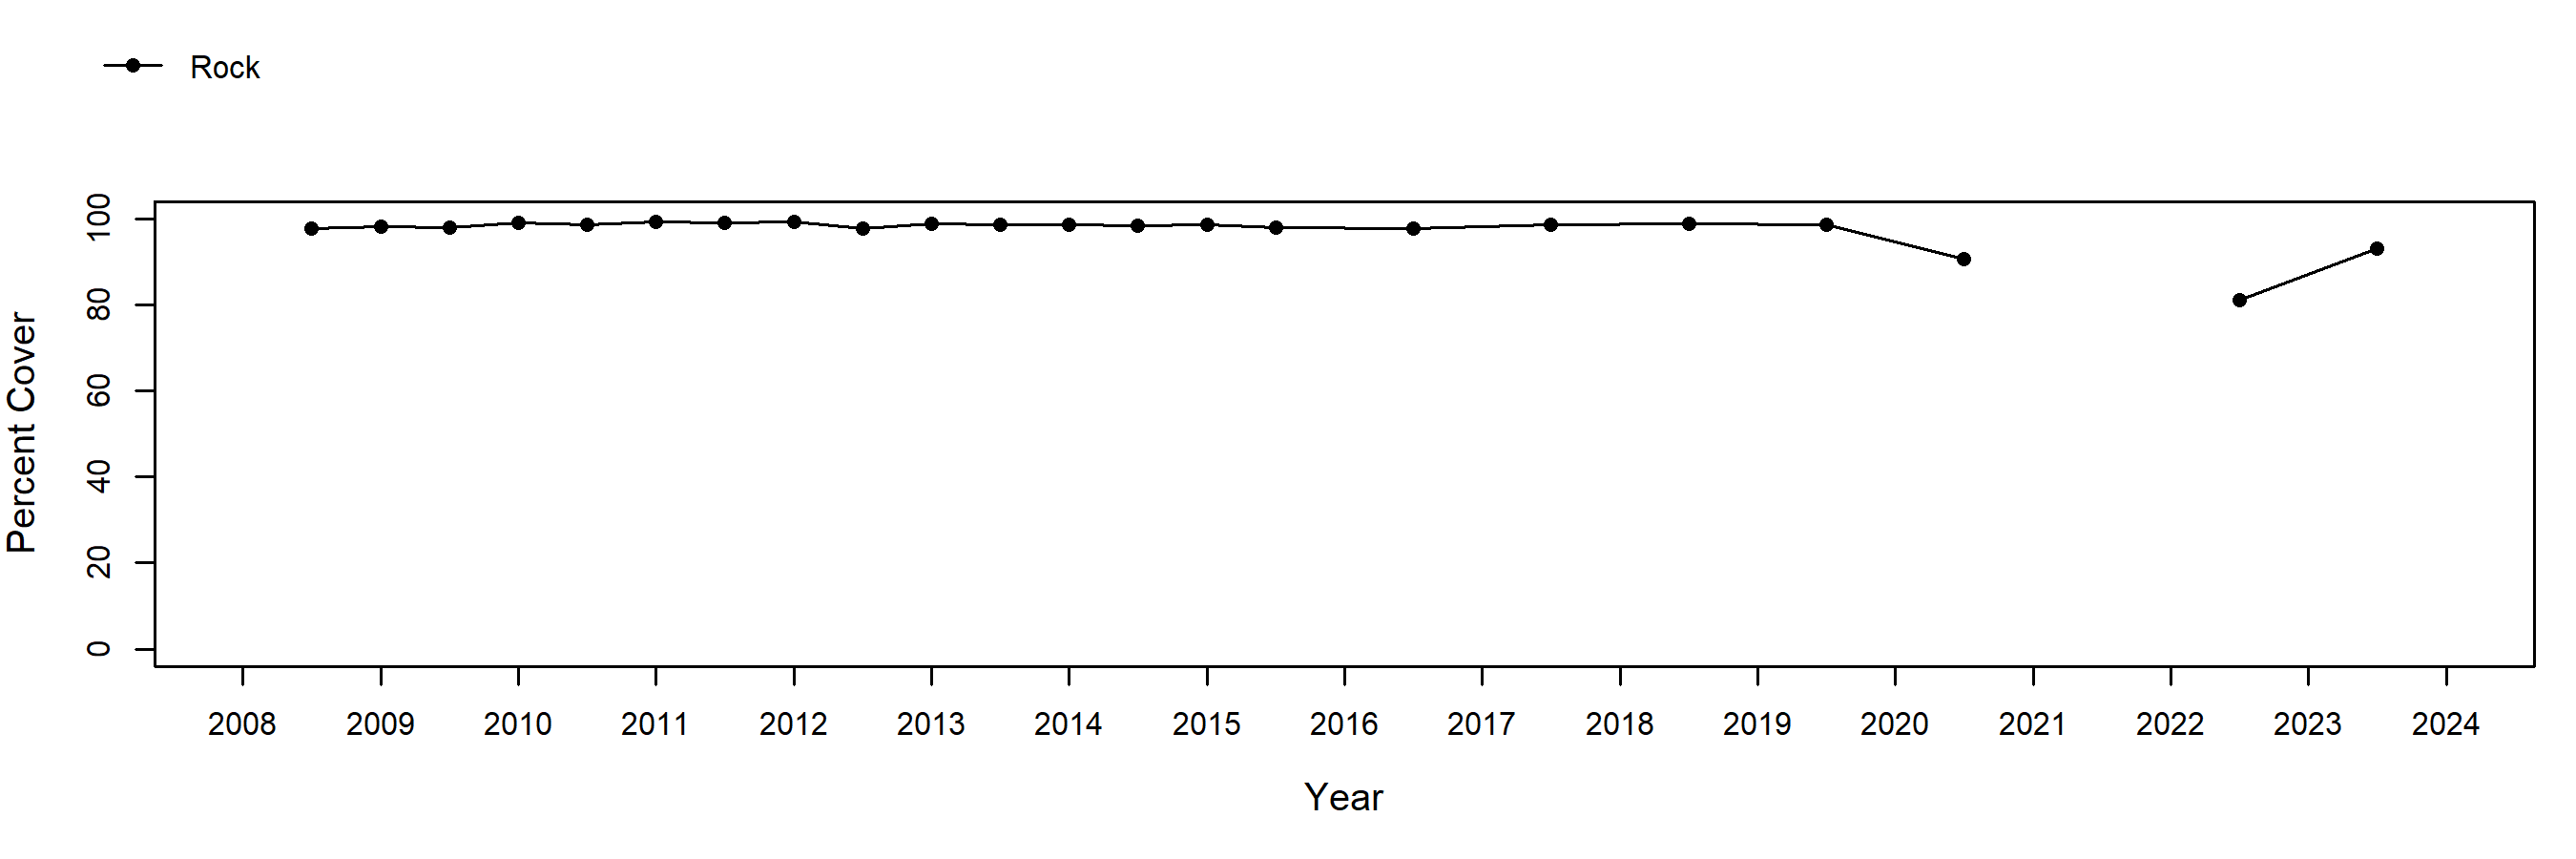
Rock (Above Barnacles) – percent cover
Rock (Above Barnacles) – motile invertebrate counts
Transects

Below are the trends observed for each Transect target species at this site. Long-Term trend graphs also include any species that reached a minimum of 25% cover during any single point in time within a given target species assemblage. Breaks in trend lines represent missed sampling events.
Phyllospadix (Surfgrass)
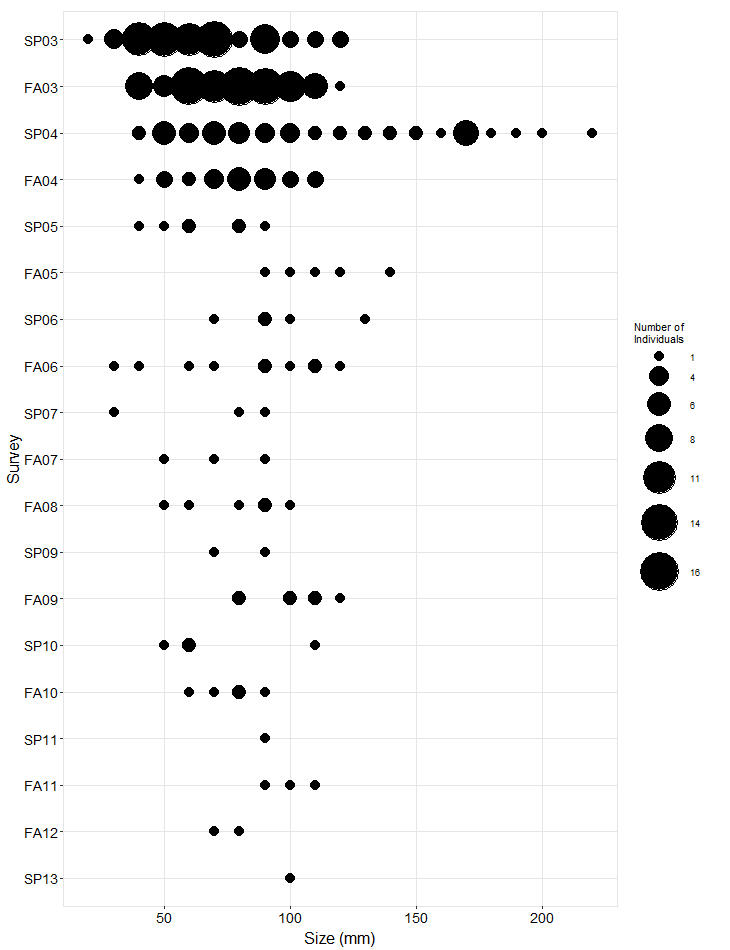
Species Counts and Sizes

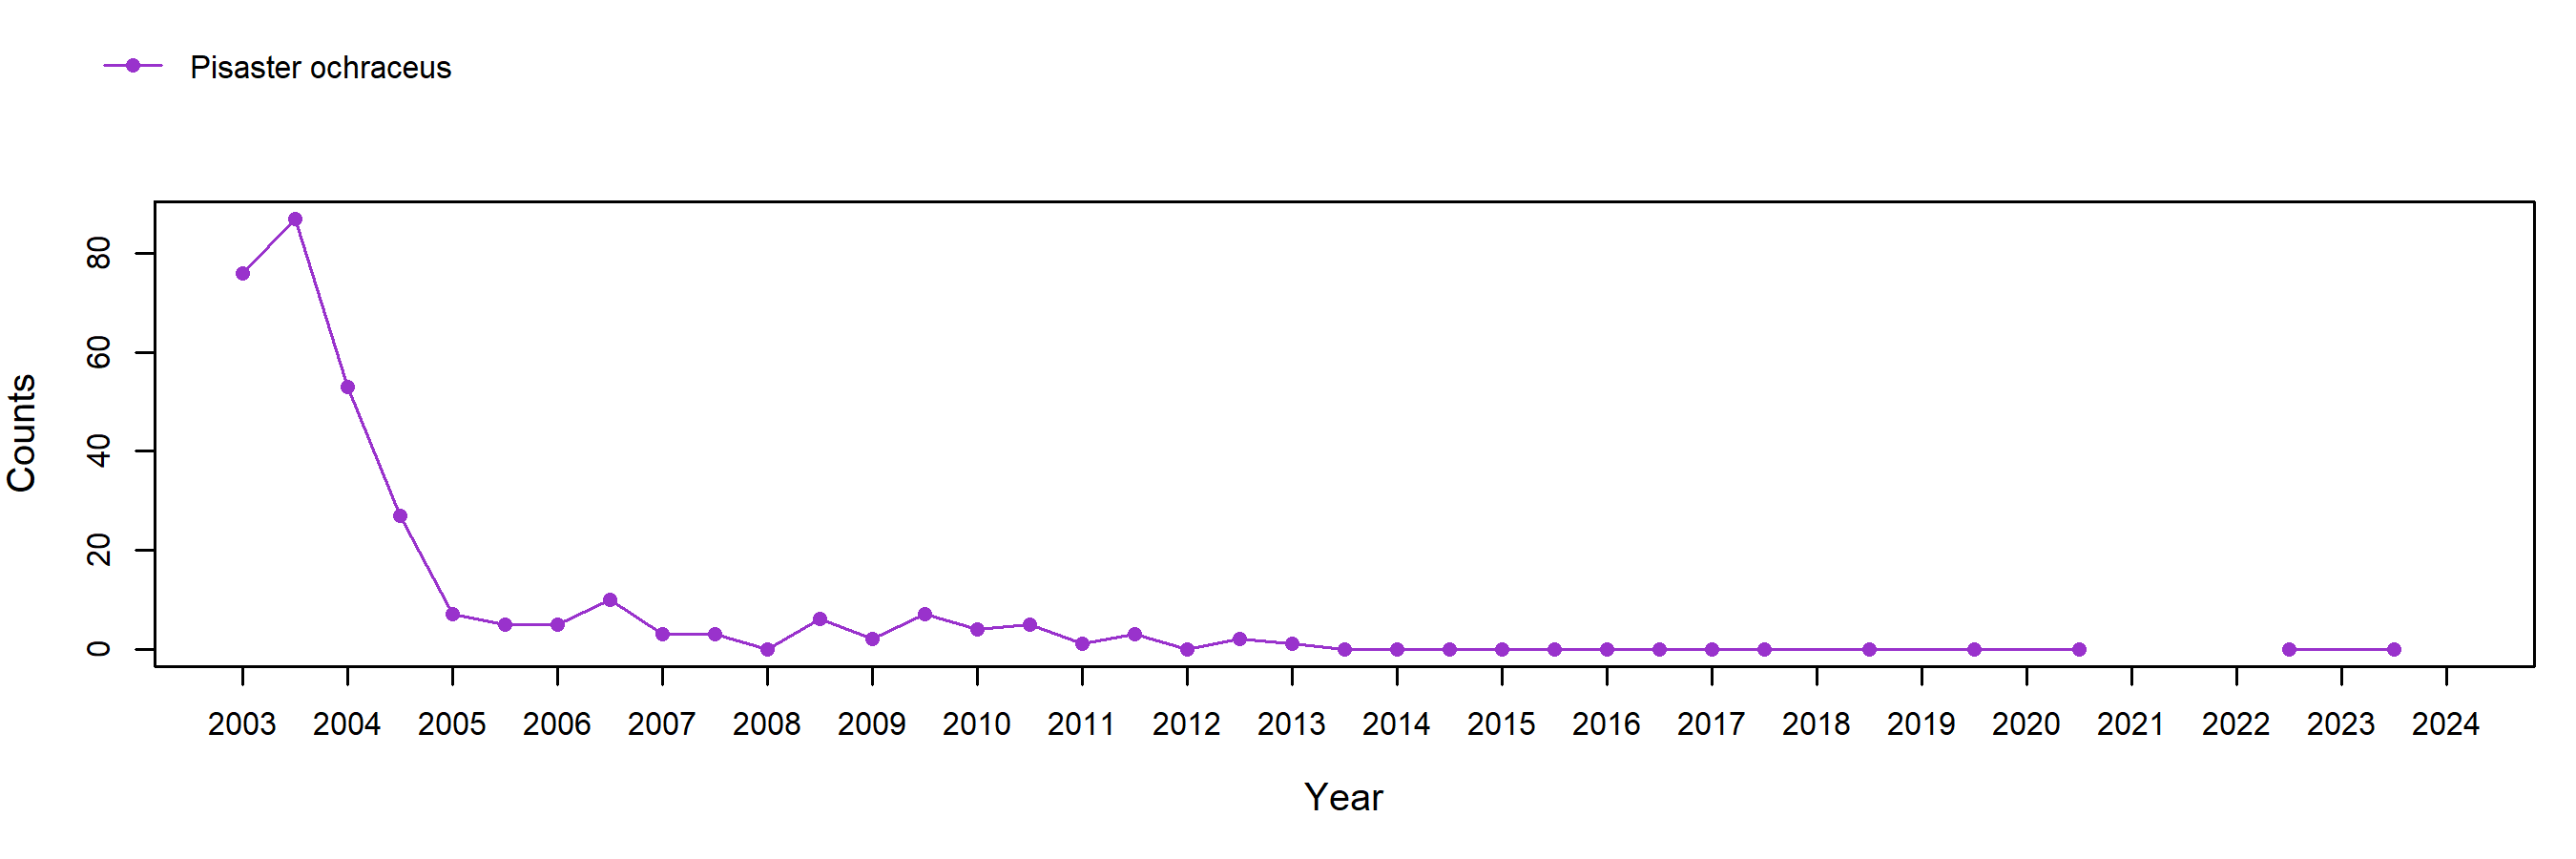
Species Counts and Sizes (where recorded) for Pisaster are shown below for this site. At some sites, other sea star species and Katharina are counted in addition to Pisaster. The sum of all individuals across all plots is displayed. Note that data gaps are represented by breaks in long-term count trend lines, but are not shown in size plots.
Pisaster ochraceus (Ochre Star) – counts
Pisaster ochraceus (Ochre Star) – sizes