
Point Sierra Nevada Long-Term trends | MARINe
Point Sierra Nevada Long-Term trends
See below for trend graphs
In order to standardize species resolution across all MARINe groups, and over time, some species (typically rare) were lumped for graphical presentation of Long-Term monitoring data. See lumped categories for definitions (some variation occurs between methods and over time). Due to funding constraints, semi-annual sampling of plots/transects was reduced to annual sampling beginning in 2016. In addition, counts of motile invertebrates within plots at most sites ended in 2014.
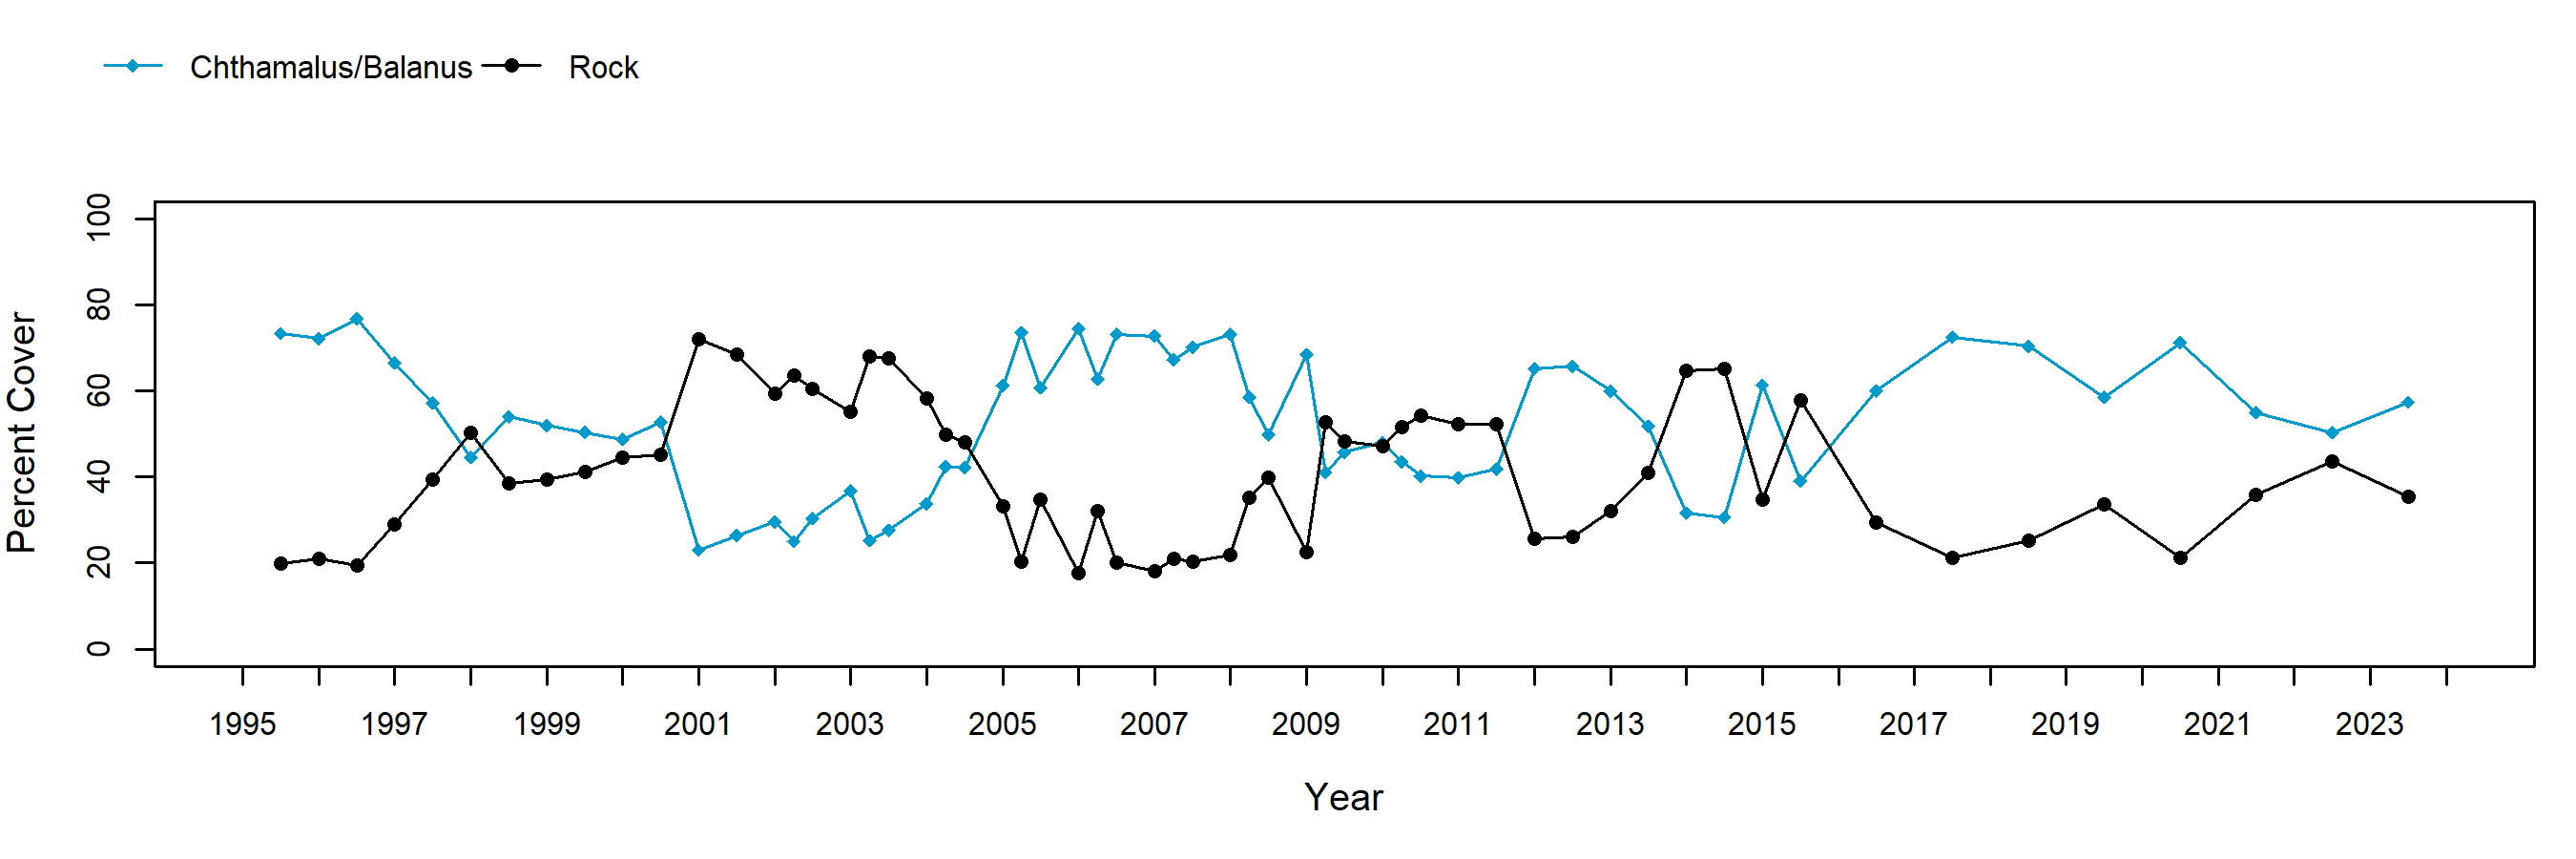
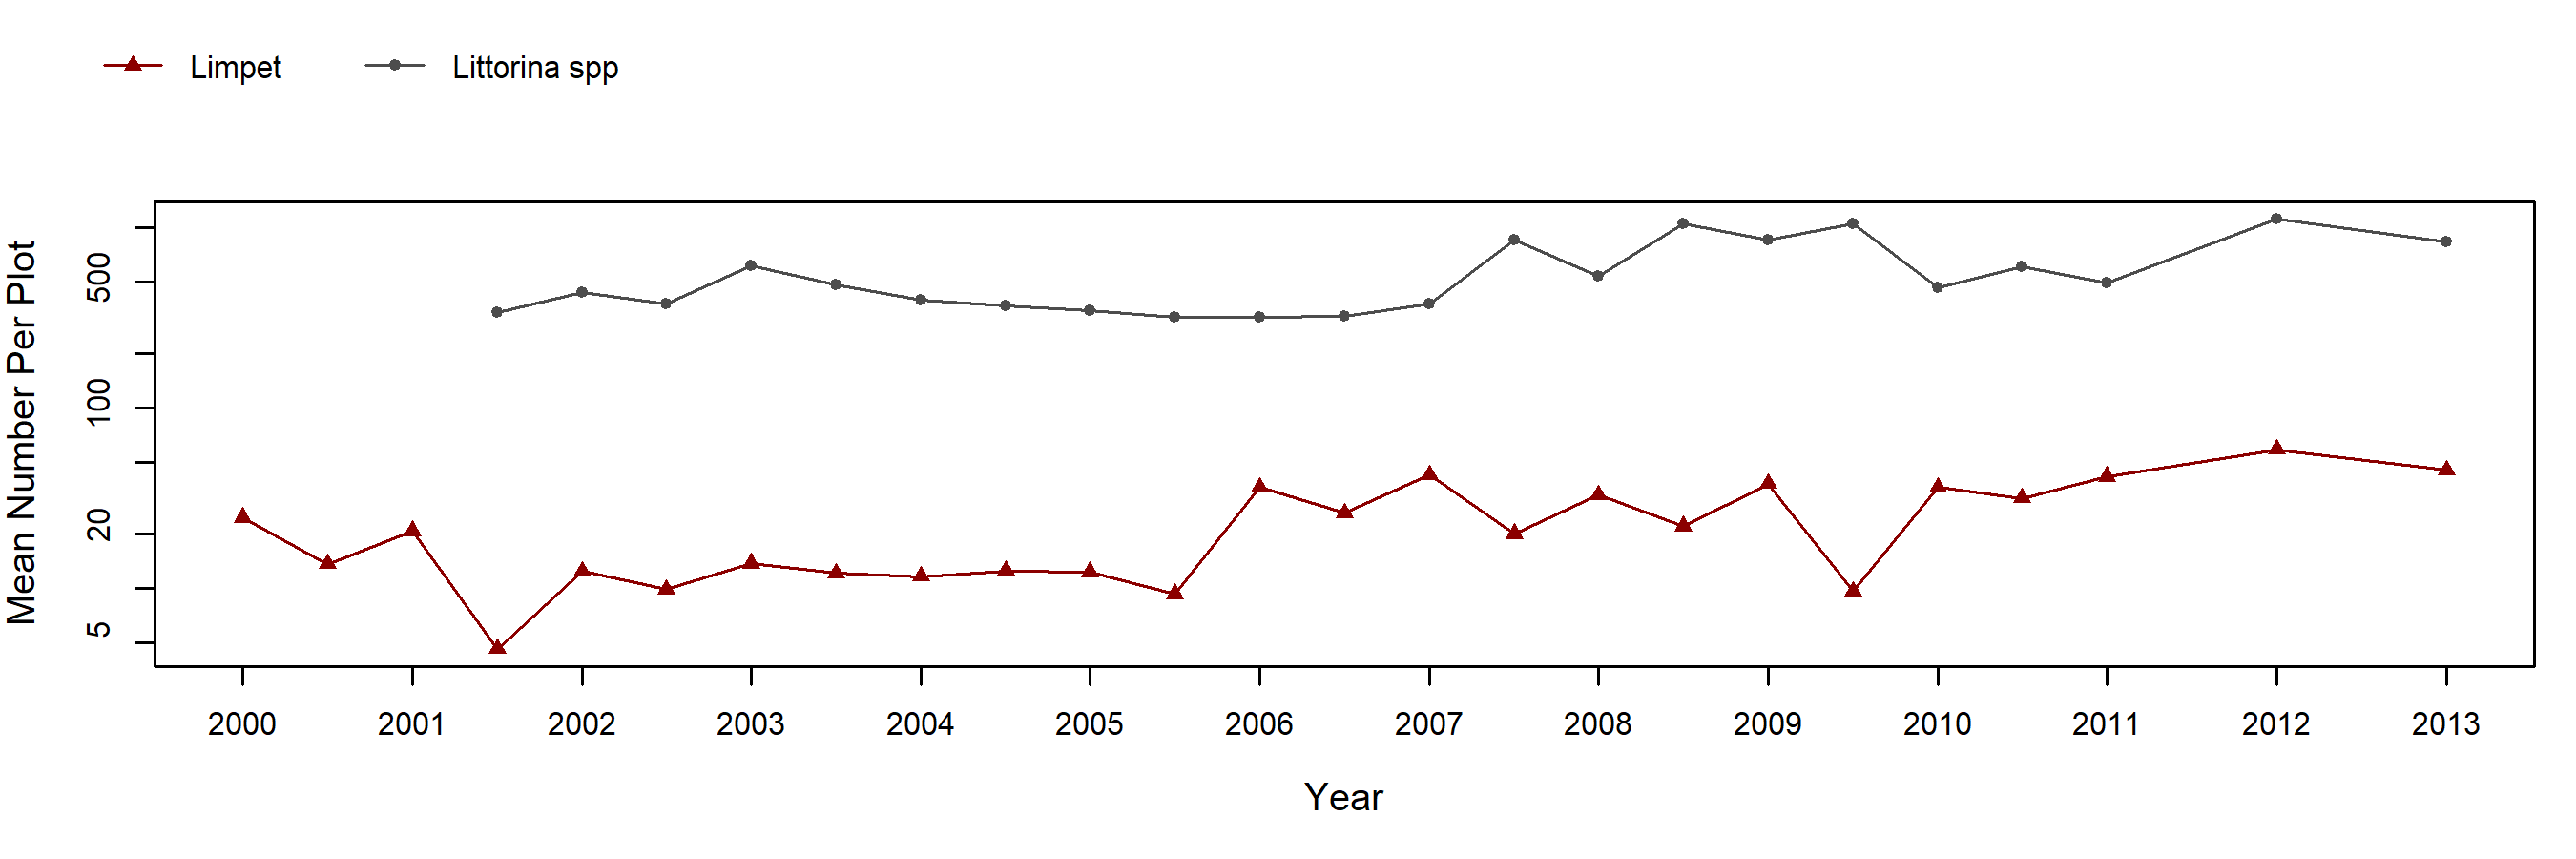
Barnacle plots at Point Sierra Nevada consist almost exclusively of Chthamalus dalli/fissus, although Balanus glandula are recorded on rare occasion (note that species were not distinguished until 2001). Cover of Chthamalus spp. varied inversely with rock cover nearly perfectly, with little else occurring in these plots. Littorines were consistently common in the barnacle plots and limpets were also present in moderate numbers.
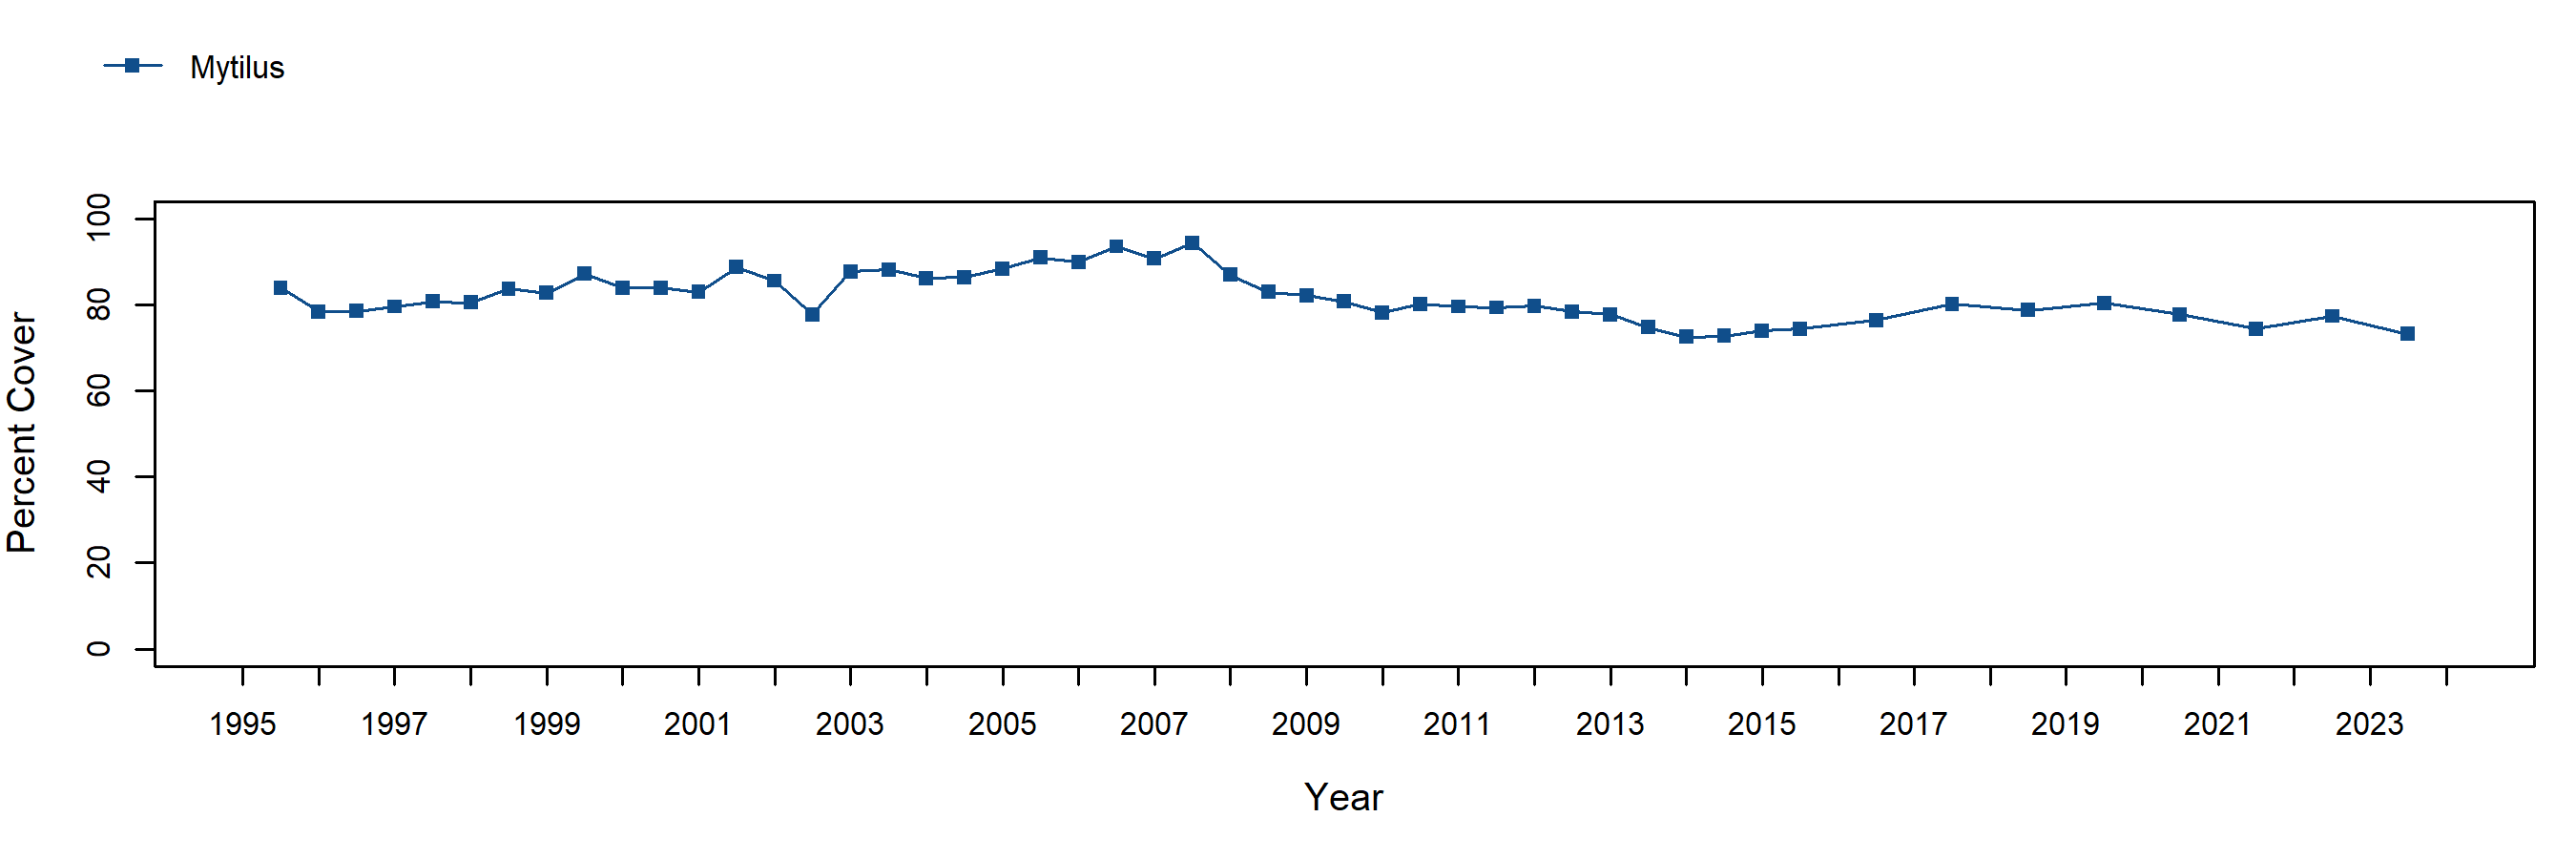
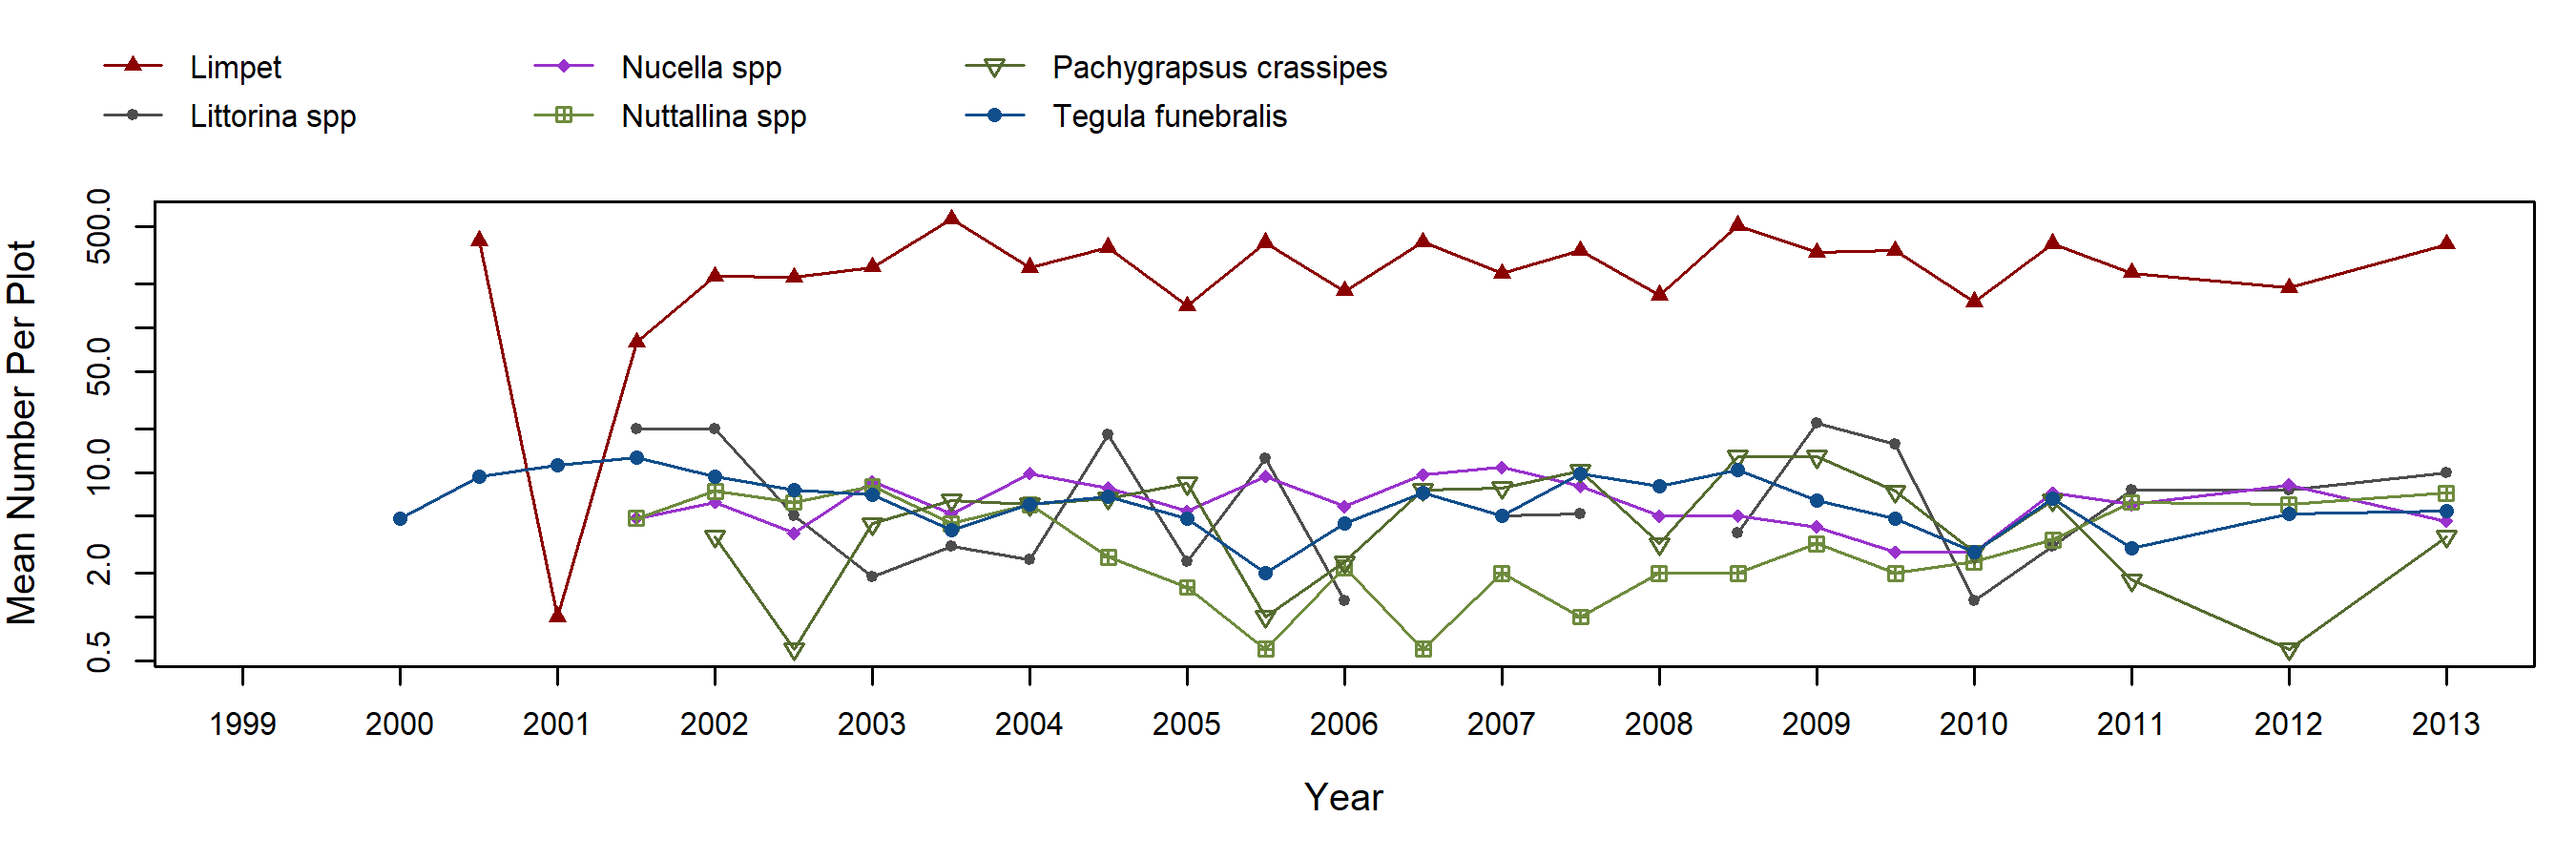
Mytilus cover in mussel plots remained high and extremely stable at Point Sierra Nevada, hovering just above 80% for nearly the entire 25 year monitoring period. Rock and the goose neck barnacle, Pollicipes generally made up the remainder of cover within the plots. Limpets were the most common motile invertebrate within the mussel plots, and exhibited a seasonal fluctuation in abundance, with higher numbers in fall than in spring. Other motile inverts consistently found within the mussel plots included three types of snails (littorines, Tegula, and Nucella), a chiton (Nuttallina), and the lined shore crab (Pachygrapsus).
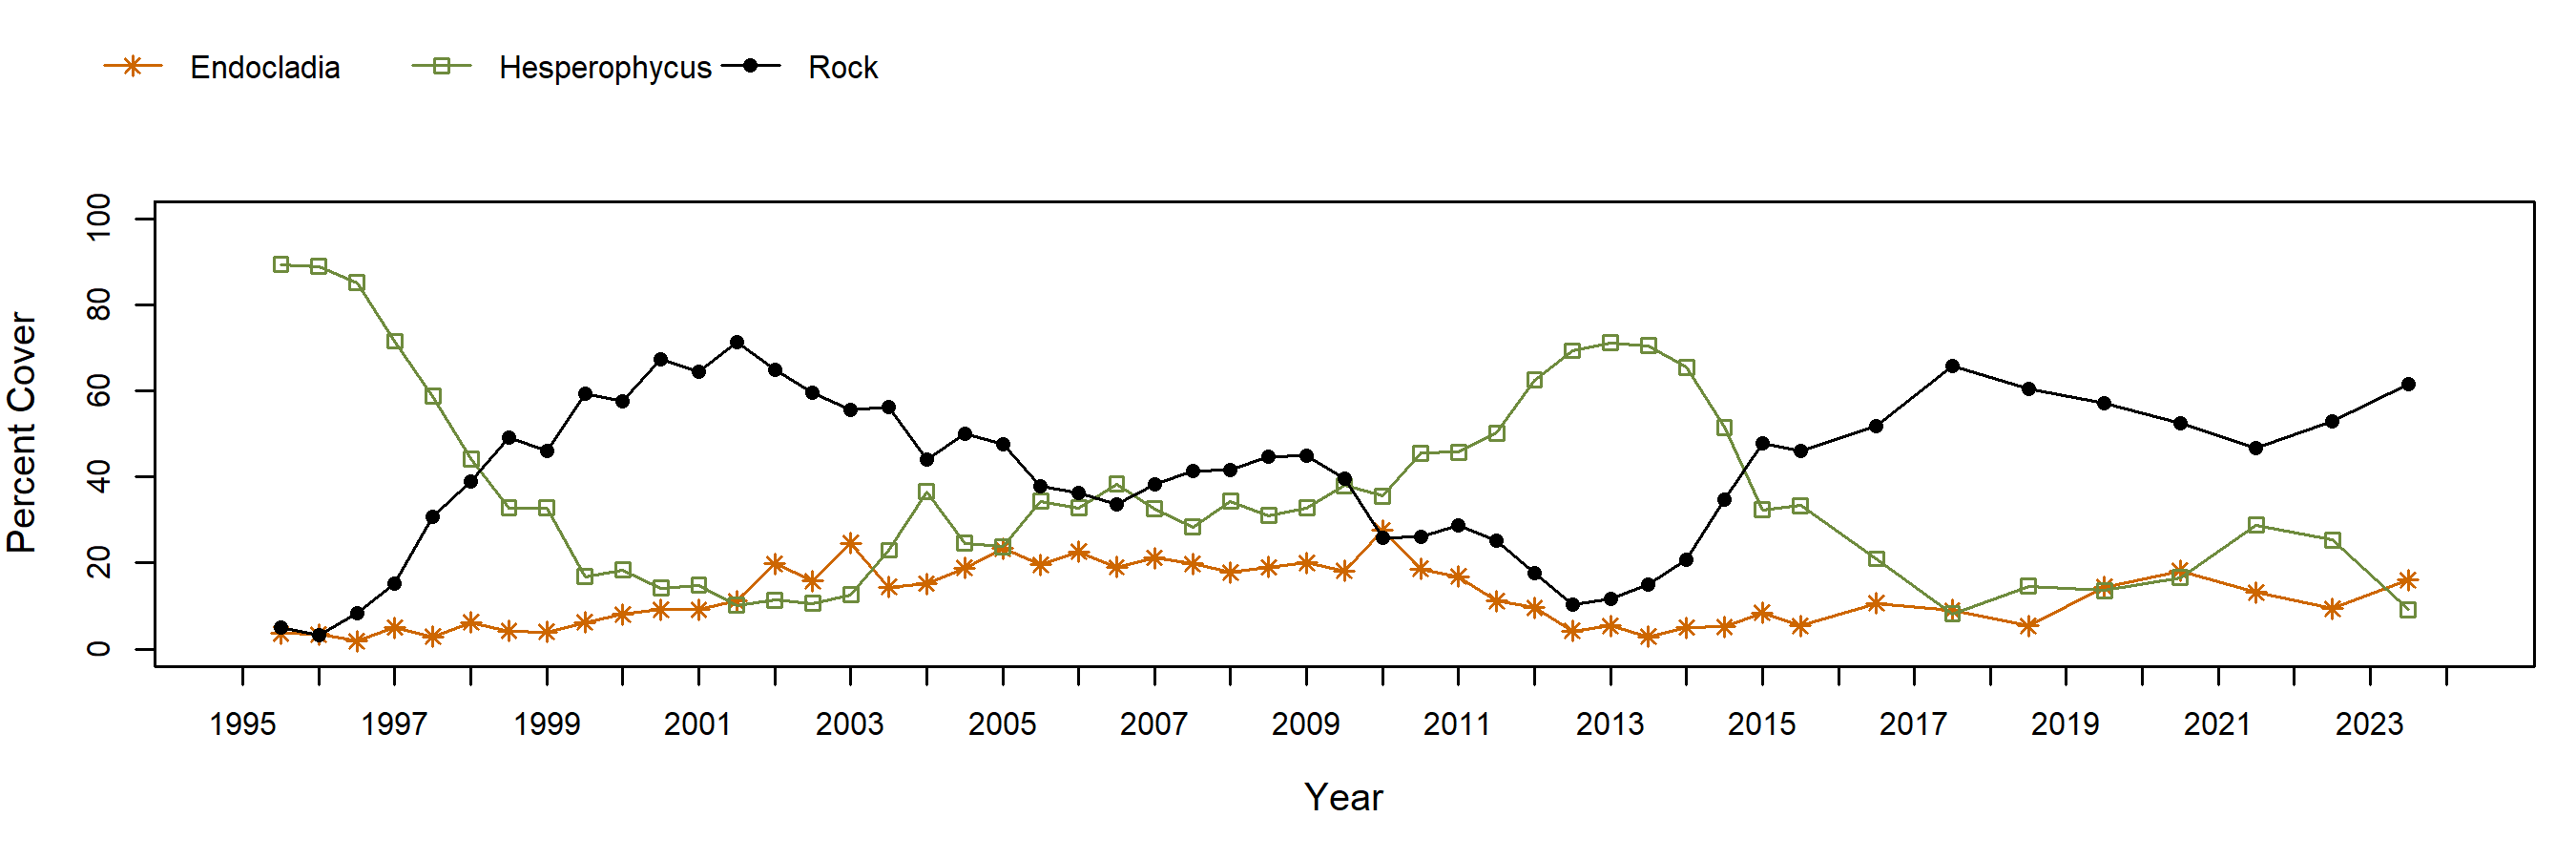
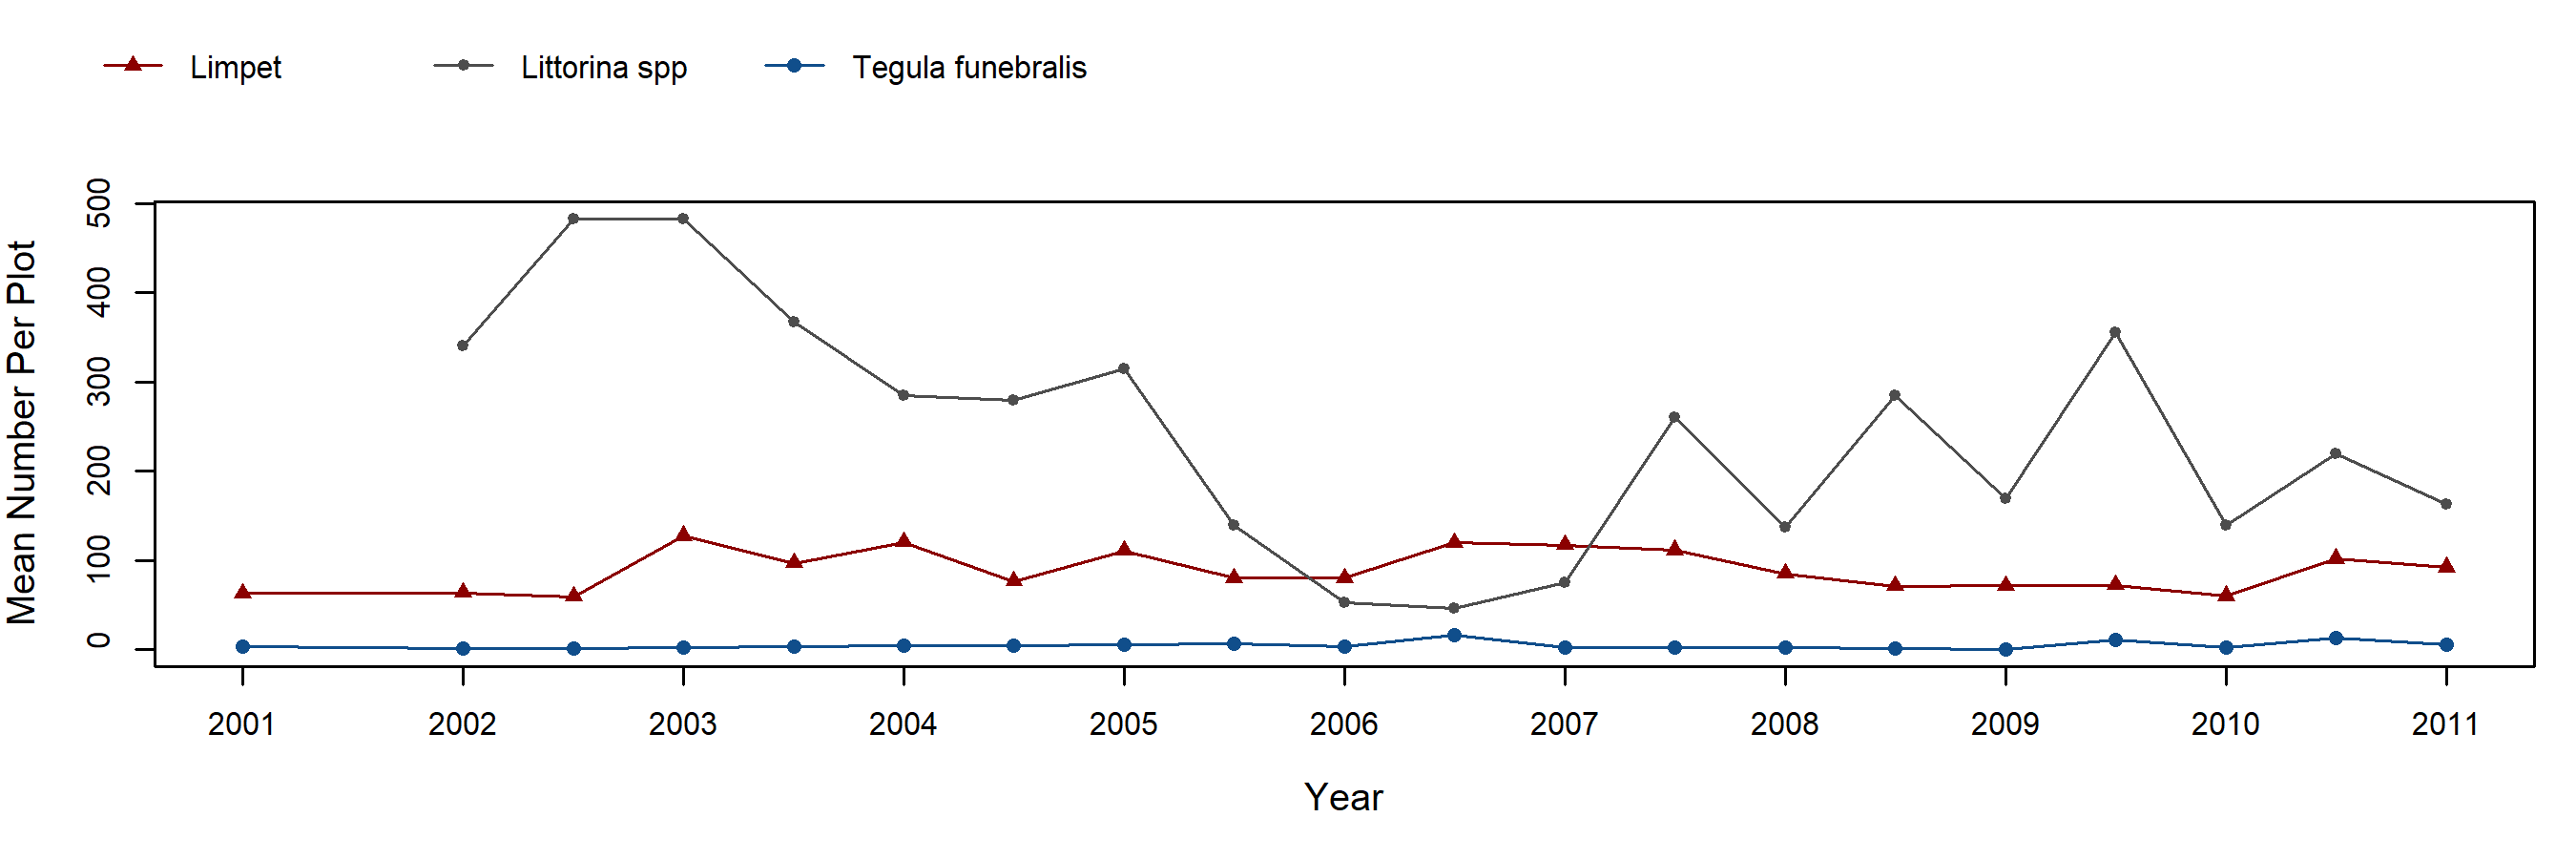
Hesperophycus cover within its target plots started out high (around 90%) and then declined precipitously to around 15%, where it hovered for several years before recovering slightly and stabilizing at around 30%. Beginning in 2010, Hesperophycus cover gradually increased to roughly 75%. However, it declined again in 2014, when much of the Hesperophycus appeared to be sunburned or heat-stressed and in many cases only the stipes remained. Recent cover has remained below 15%. Declines of this rockweed corresponded with increases in cover of bare rock and to a lesser extent, Endocladia. Littorines were variable in abundance, but generally quite common in the Hesperophycus plots. Limpets were less abundant, but still common in these rockweed plots, and the black turban snail, Tegula, was consistently present in low numbers.
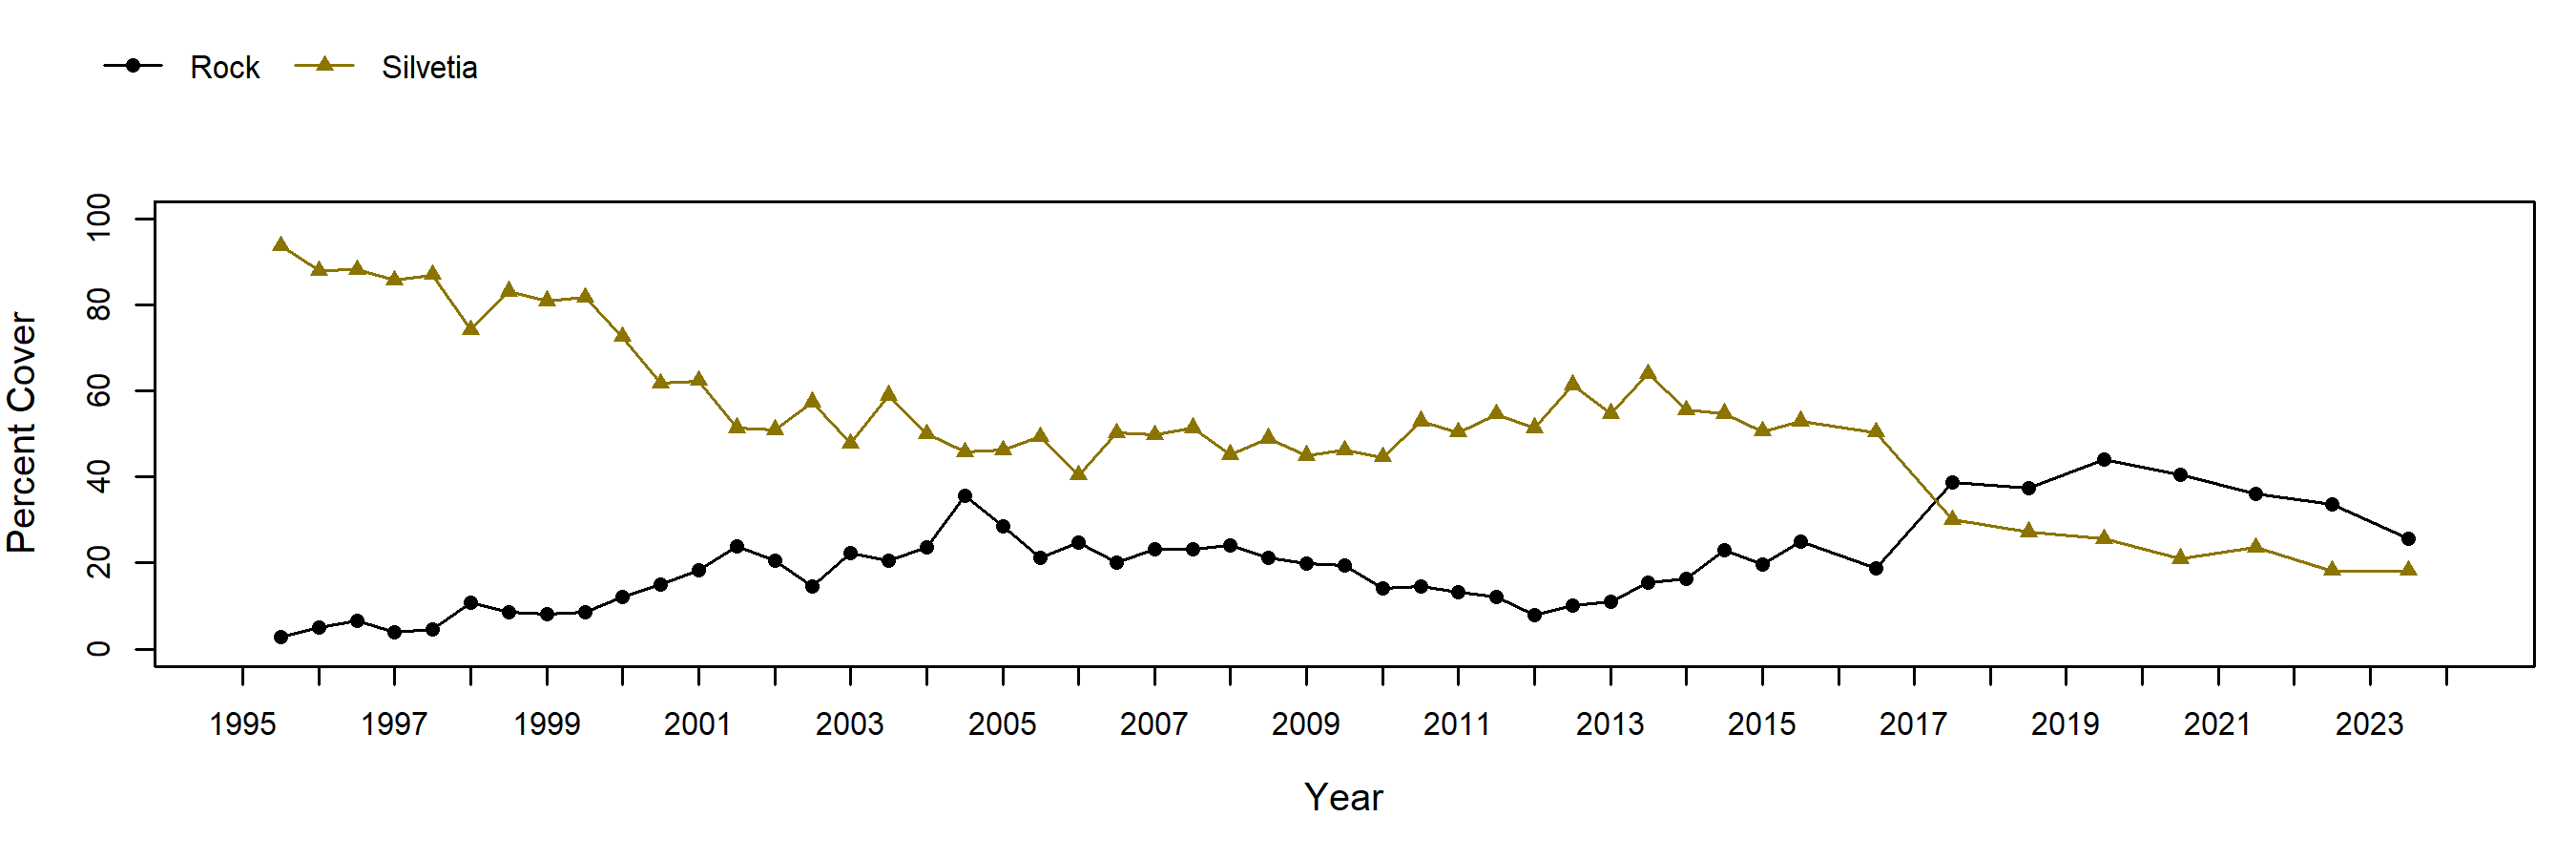
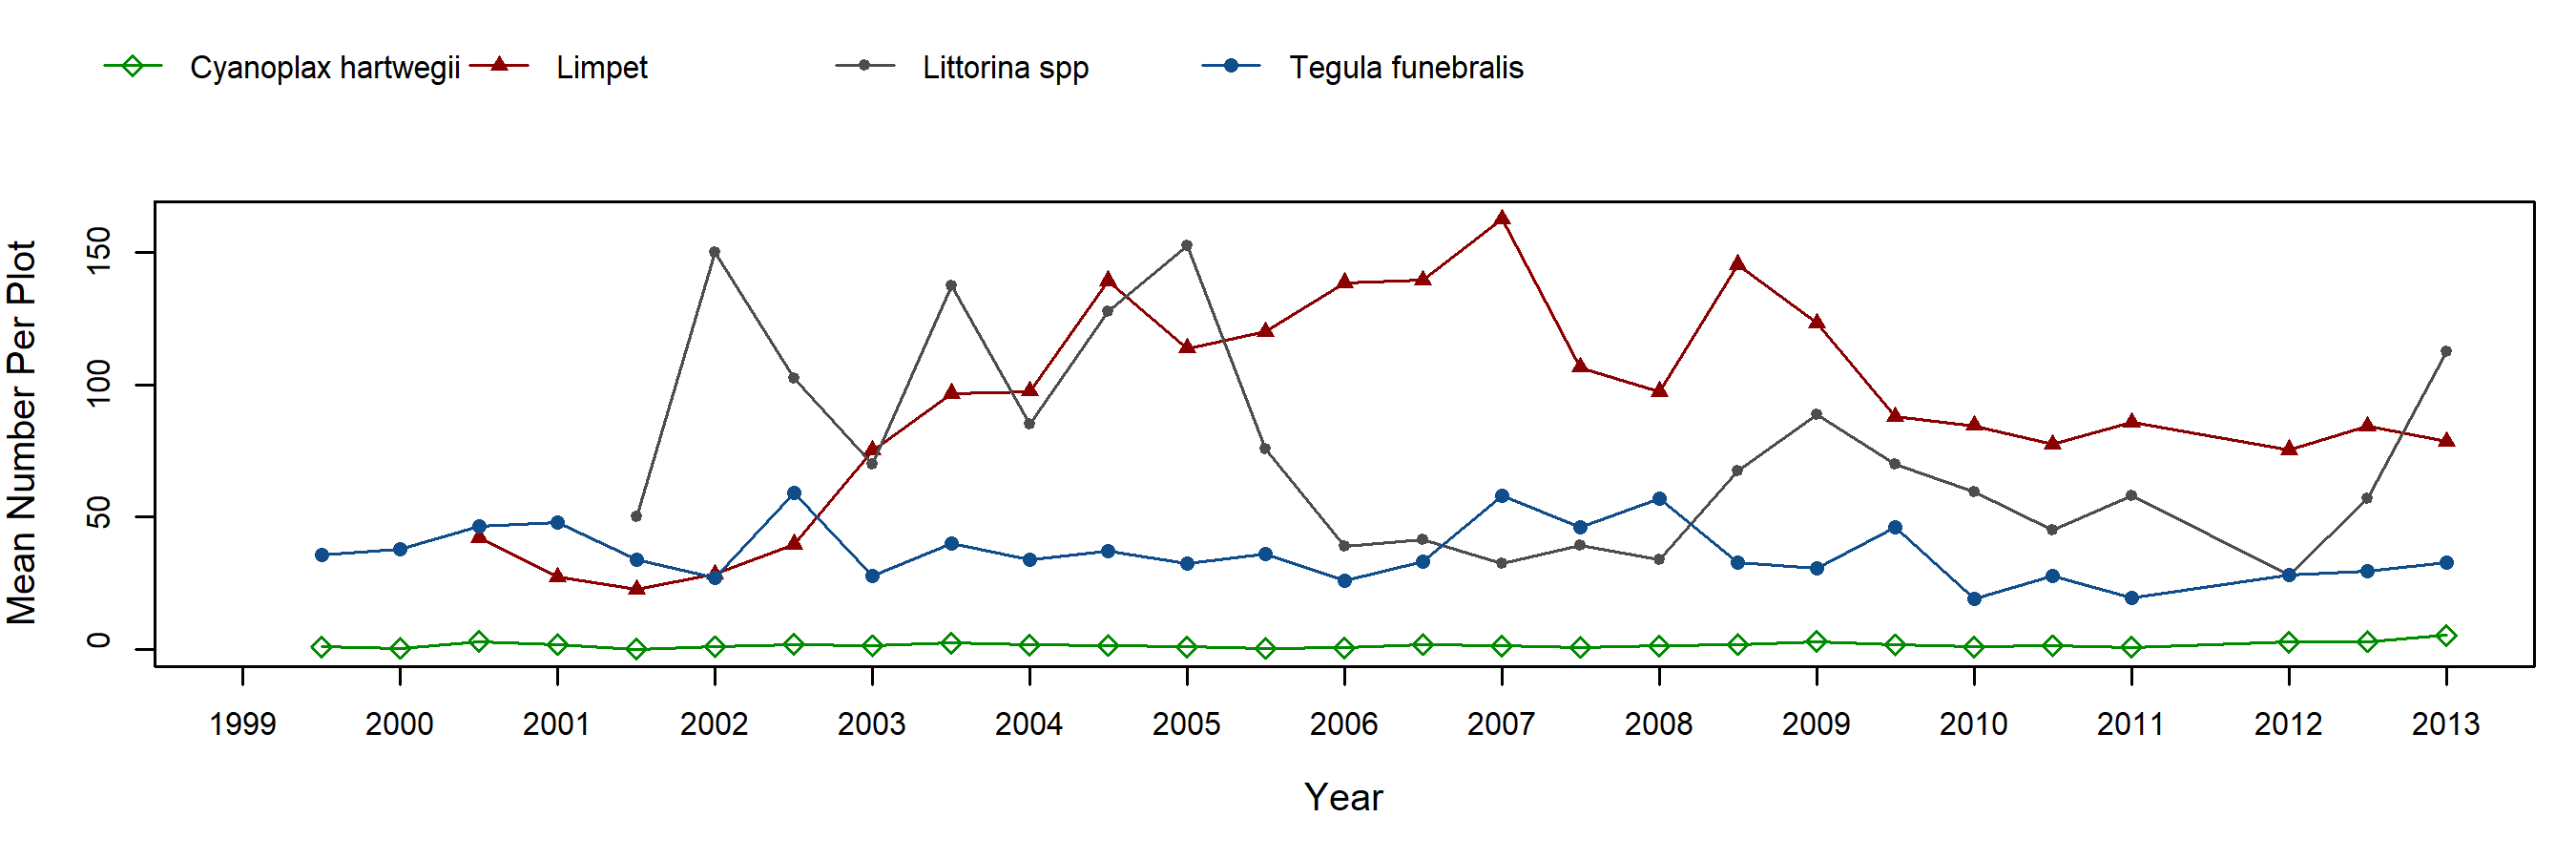
Another species of rockweed, Silvetia, has also declined over time in plots where it is targeted at Point Sierra Nevada. Initial mean cover was >90%, then steadily declined and stabilized at around 50% for over 15 years. Recent years have seen further decline in cover, to around 30%. In some plots, Mytilus, Hesperophycus, Endocladia, or Mastocarpus has moved in, but a fair amount of bare space (rock) remains. Littorines and limpets were generally common, but variable in abundance over time within Silvetia plots. The black turban snail, Tegula, was also consistently common.
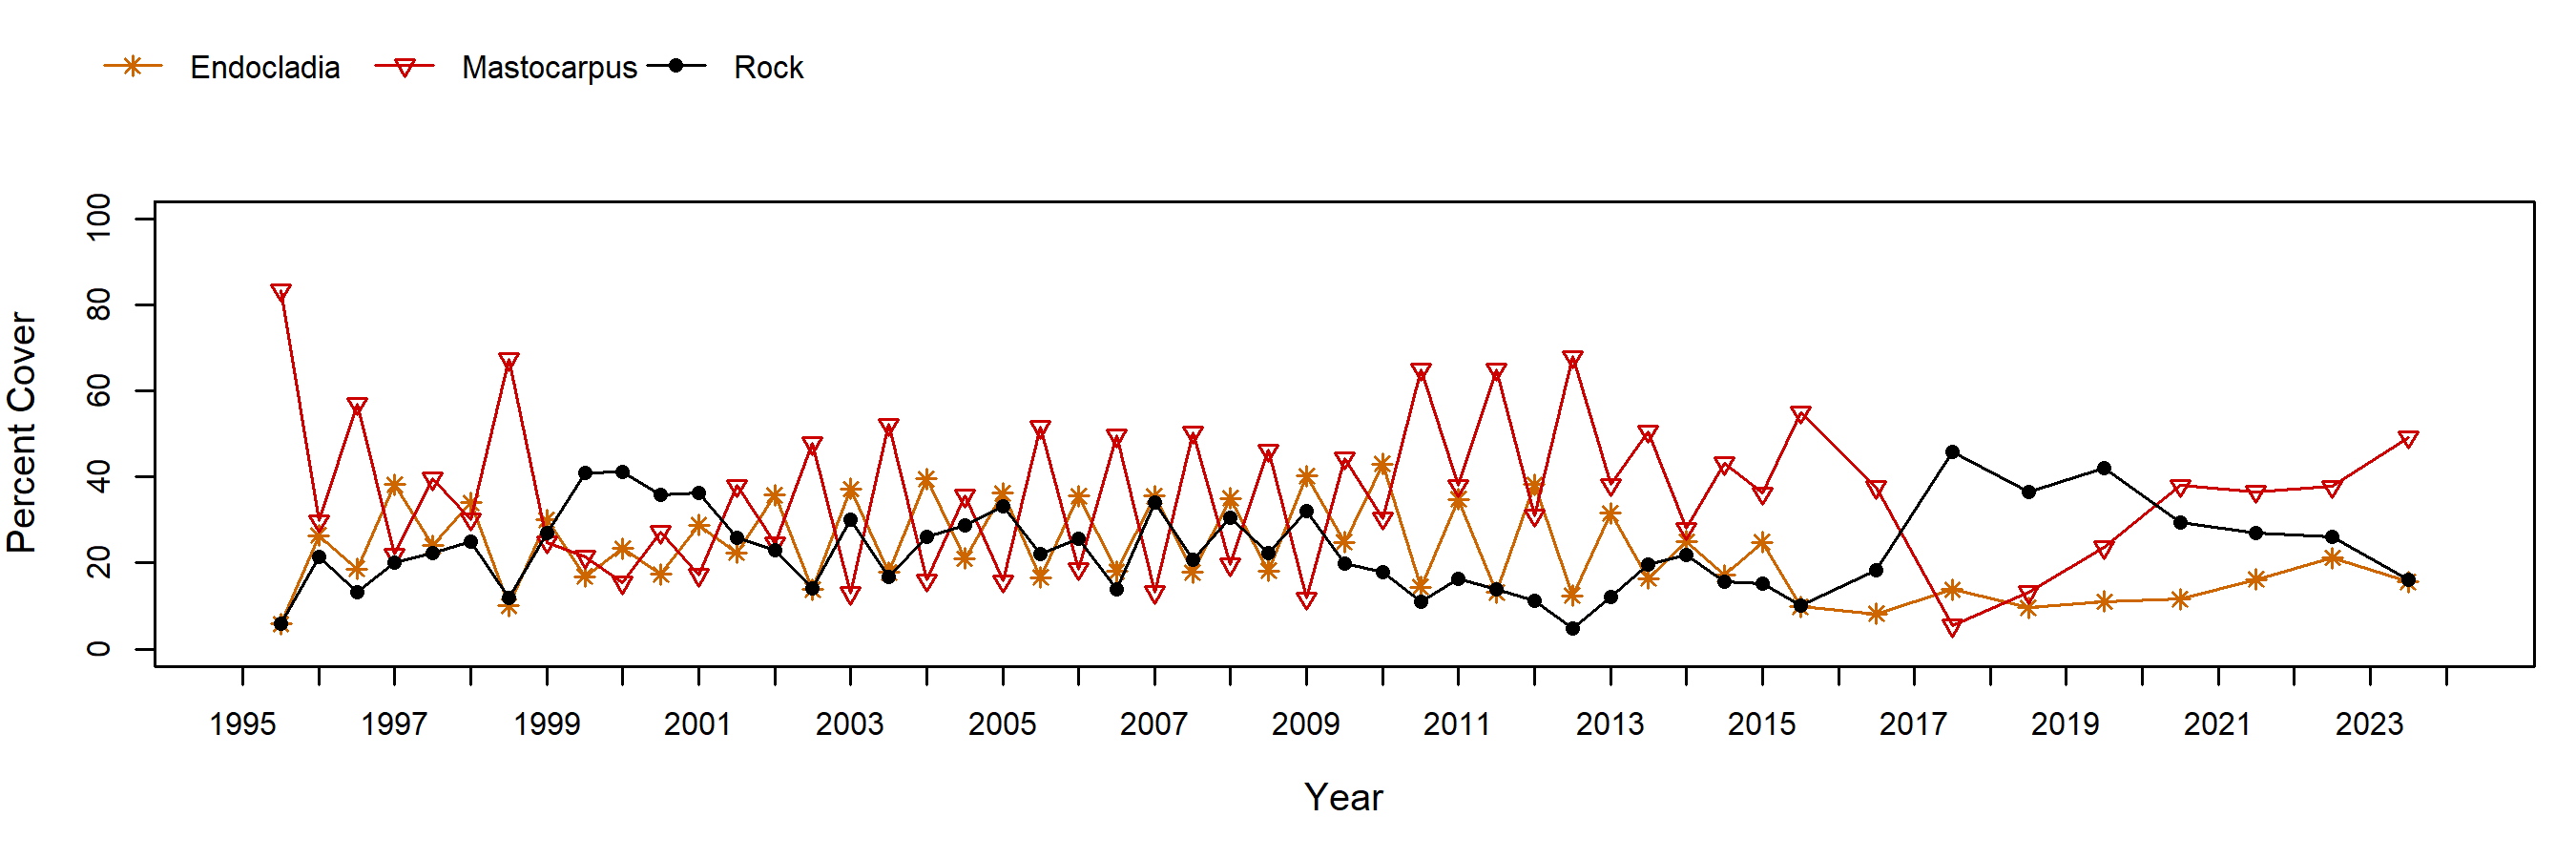
In Mastocarpus plots, cover of the red alga is highly seasonal, with higher cover in fall than in spring. The seasonal pattern of Mastocarpus varies inversely with cover of the red turf alga, Endocladia, also present in the plots. The way in which hydrodynamic forces affect intertidal plants may help to explain seasonal variation in size of Mastocarpus populations. When water velocities are low, such as during the summer months in central California, hydrodynamic forces do not limit thallus size (Carrington 1990). However, as water velocity increases, larger plants are torn out. Small plants may be able to better withstand large hydrodynamic forces associated with winter swell. Indeed, our plots generally contain smaller plants (and hence lower cover) in the spring.
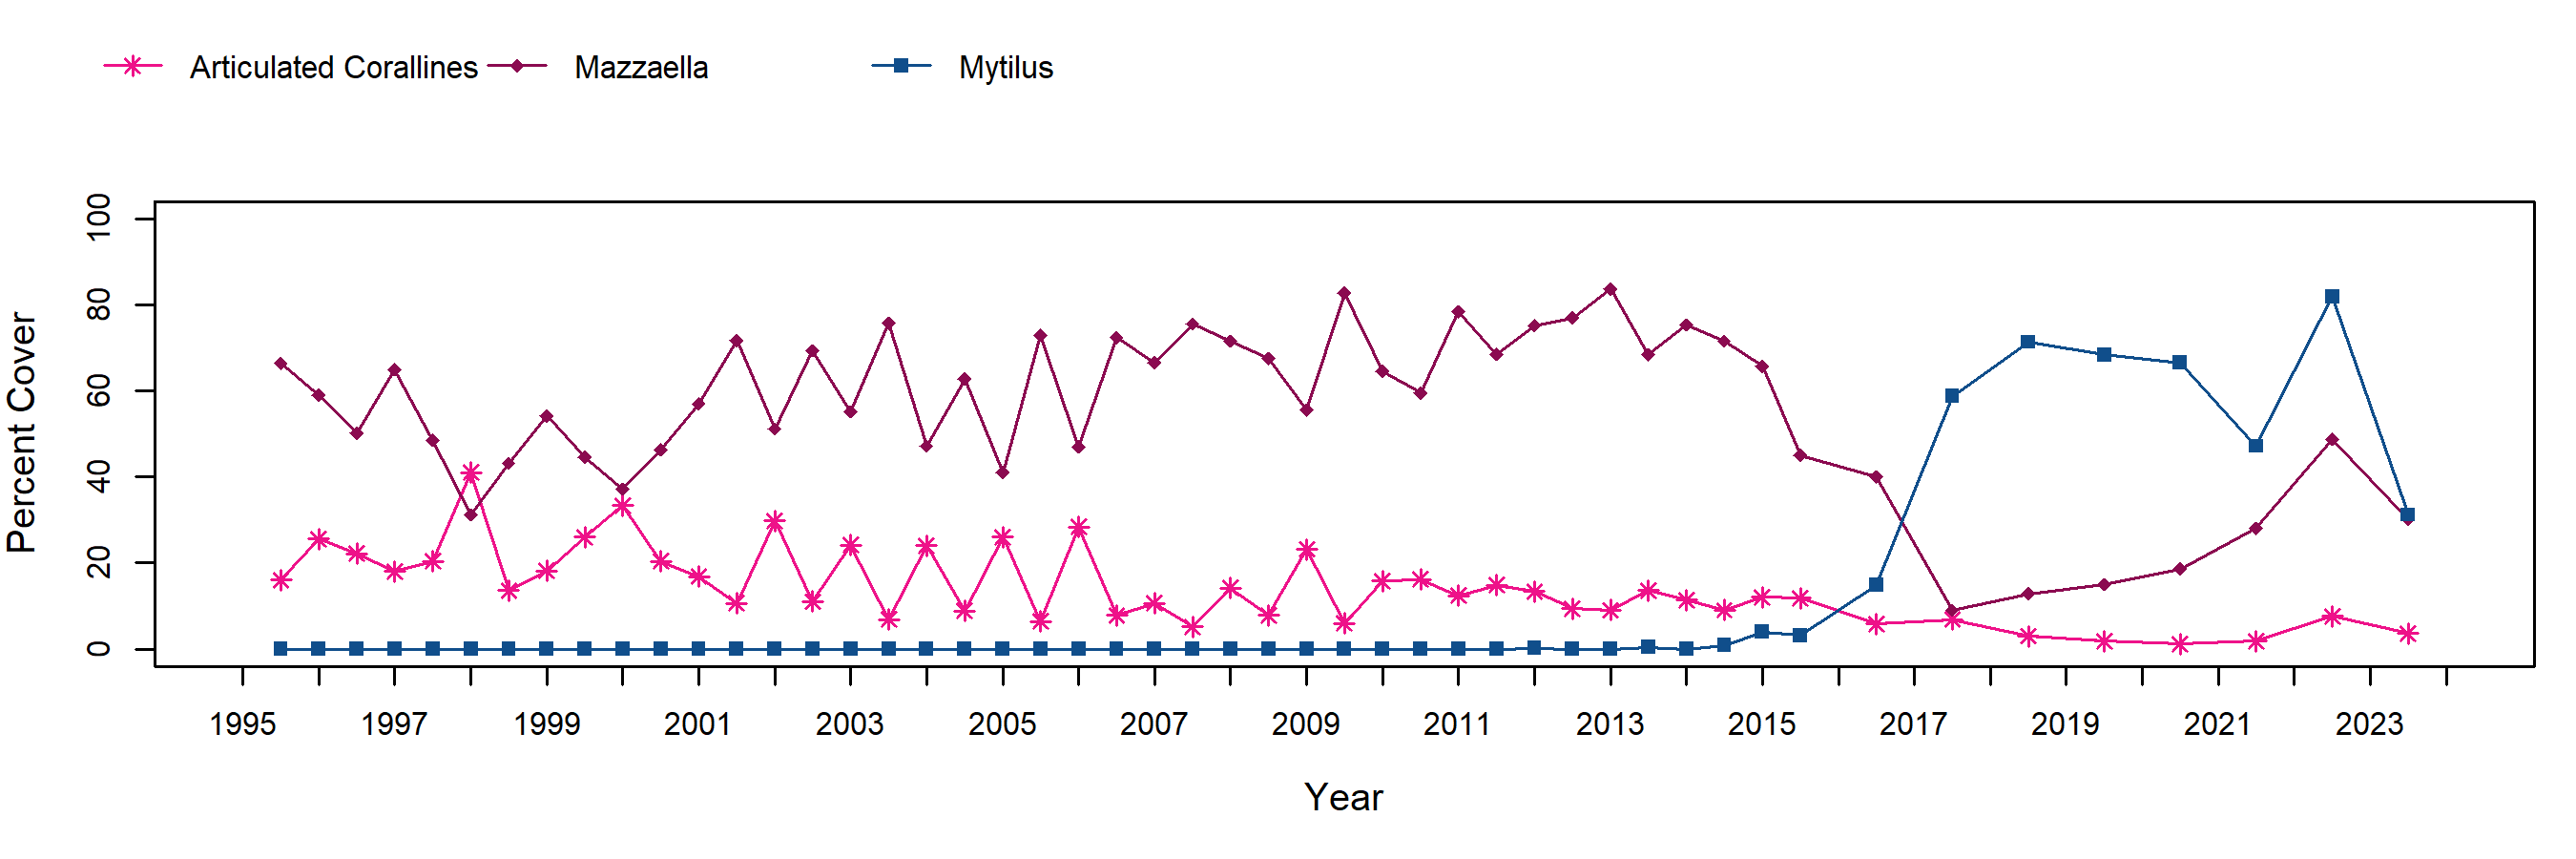
Mean cover of Mazzaella was relatively constant over time within plots where it is targeted, although some seasonal variation was apparent (commonly higher in fall than spring). Reductions in Mazzaella cover were often associated with increases in cover of articulated corallines, suggesting that coralline algae persisted as a stable understory below Mazzaella, and reduced canopy cover of Mazzaella simply exposed more corallines. Dominant species in the broad group “other red algae” included Chondracanthus canaliculatus, and Gelidium spp. As with Mastocarpus, larger blades of Mazzaella tend to be ripped out during winter storms, leaving a perennial basal crust behind. In early spring, our plots tended to have mostly small plants that had just begun to grow back. Field sampling of Mazzaella plots ended in 2015 due to funding constraints, but plots are still photographed and could be scored in the lab if needed.
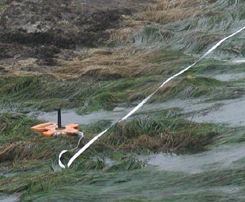
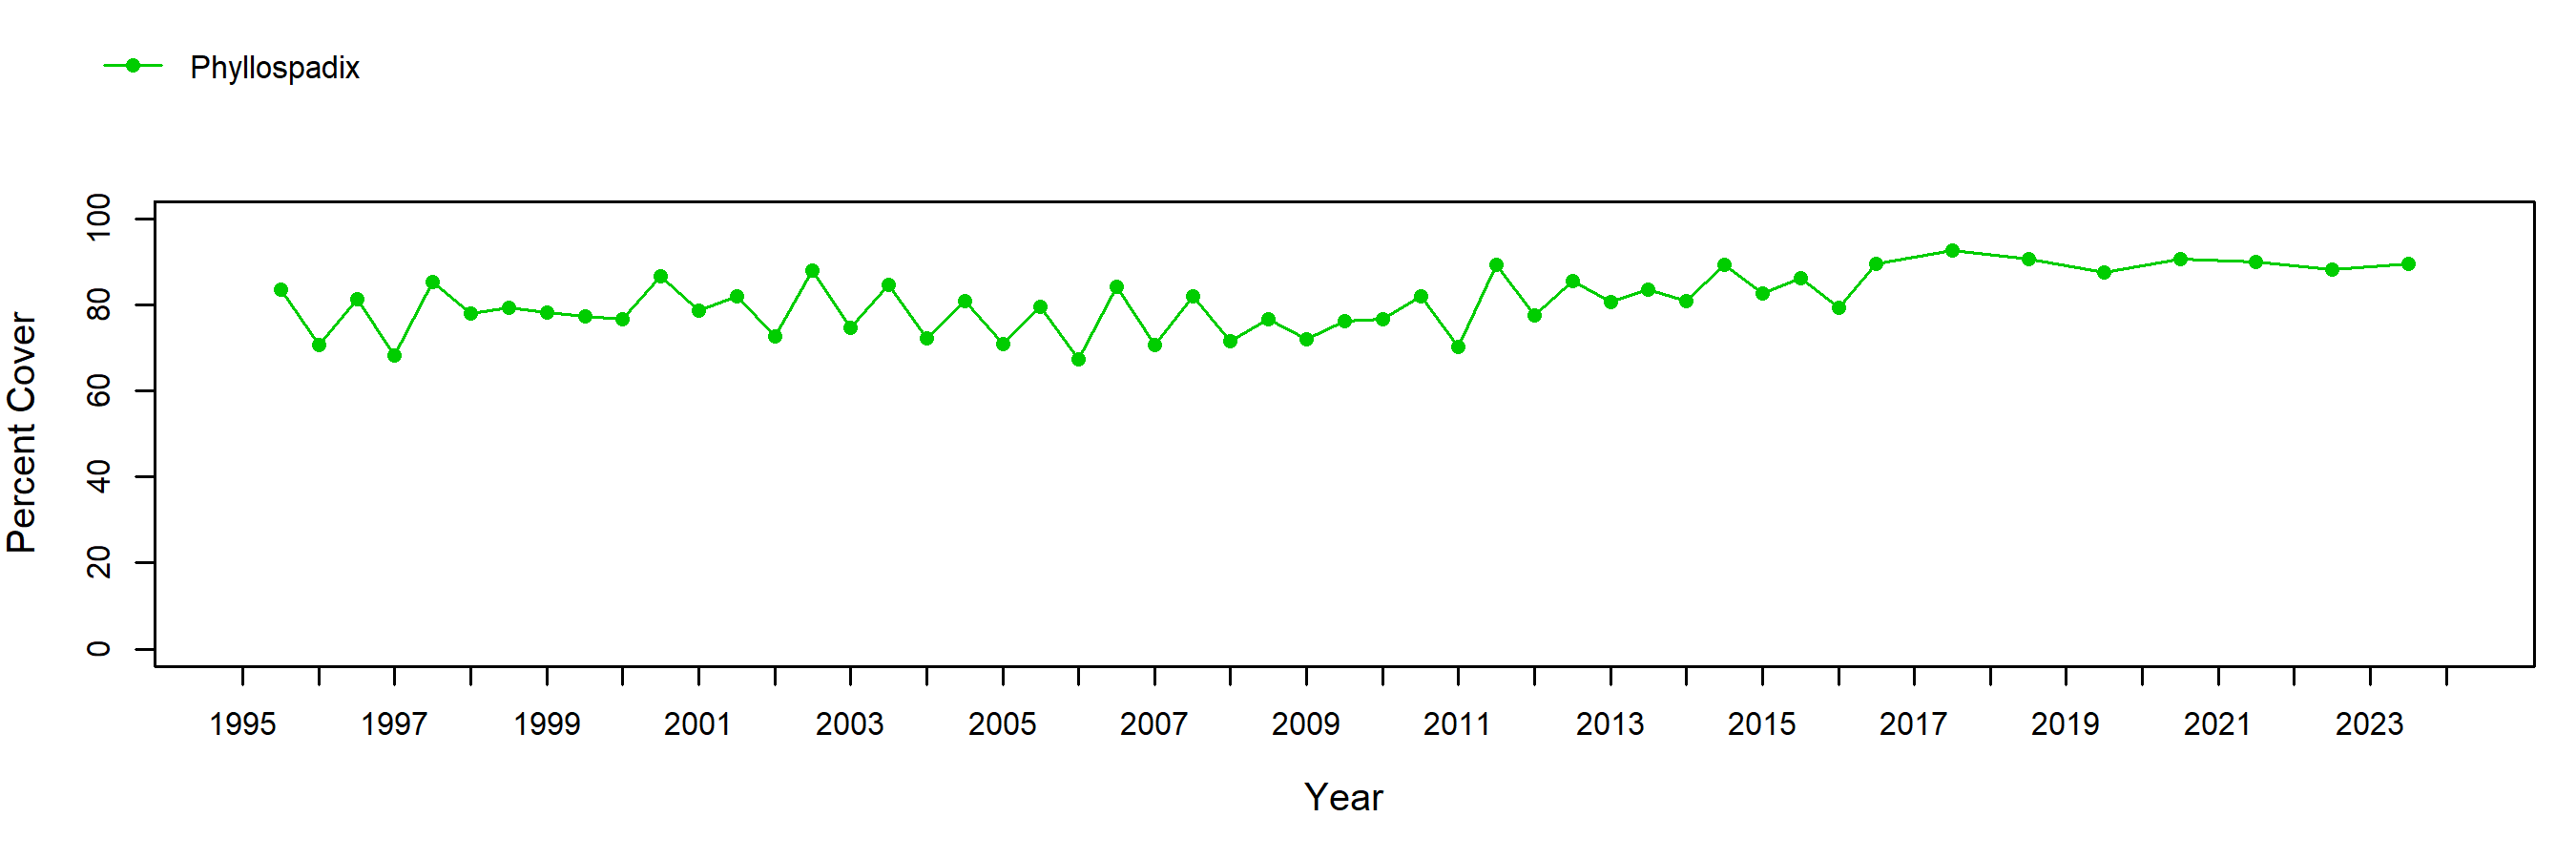
Surfgrass (Phyllospadix) cover hovered at around 80% along the transects where this species is targeted. Mean cover exhibited slight seasonal variation, with lower cover in the spring following winter storms that ripped out plants and abraded leaves.
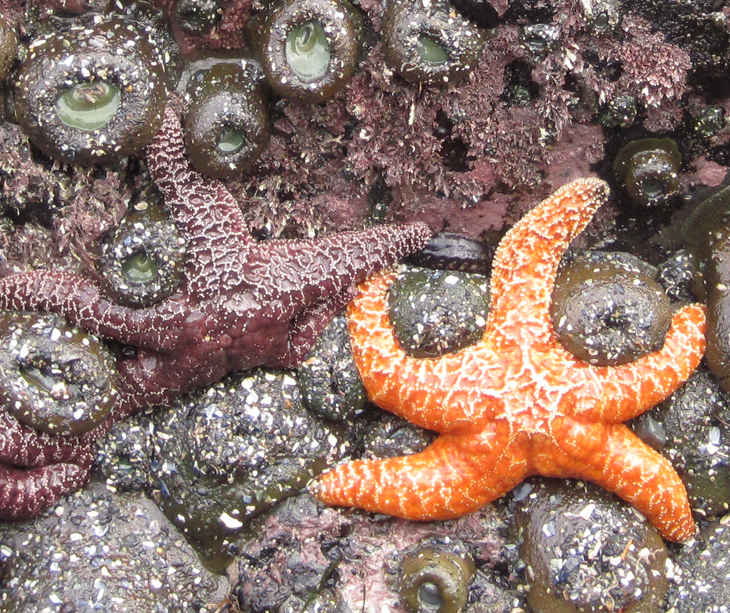
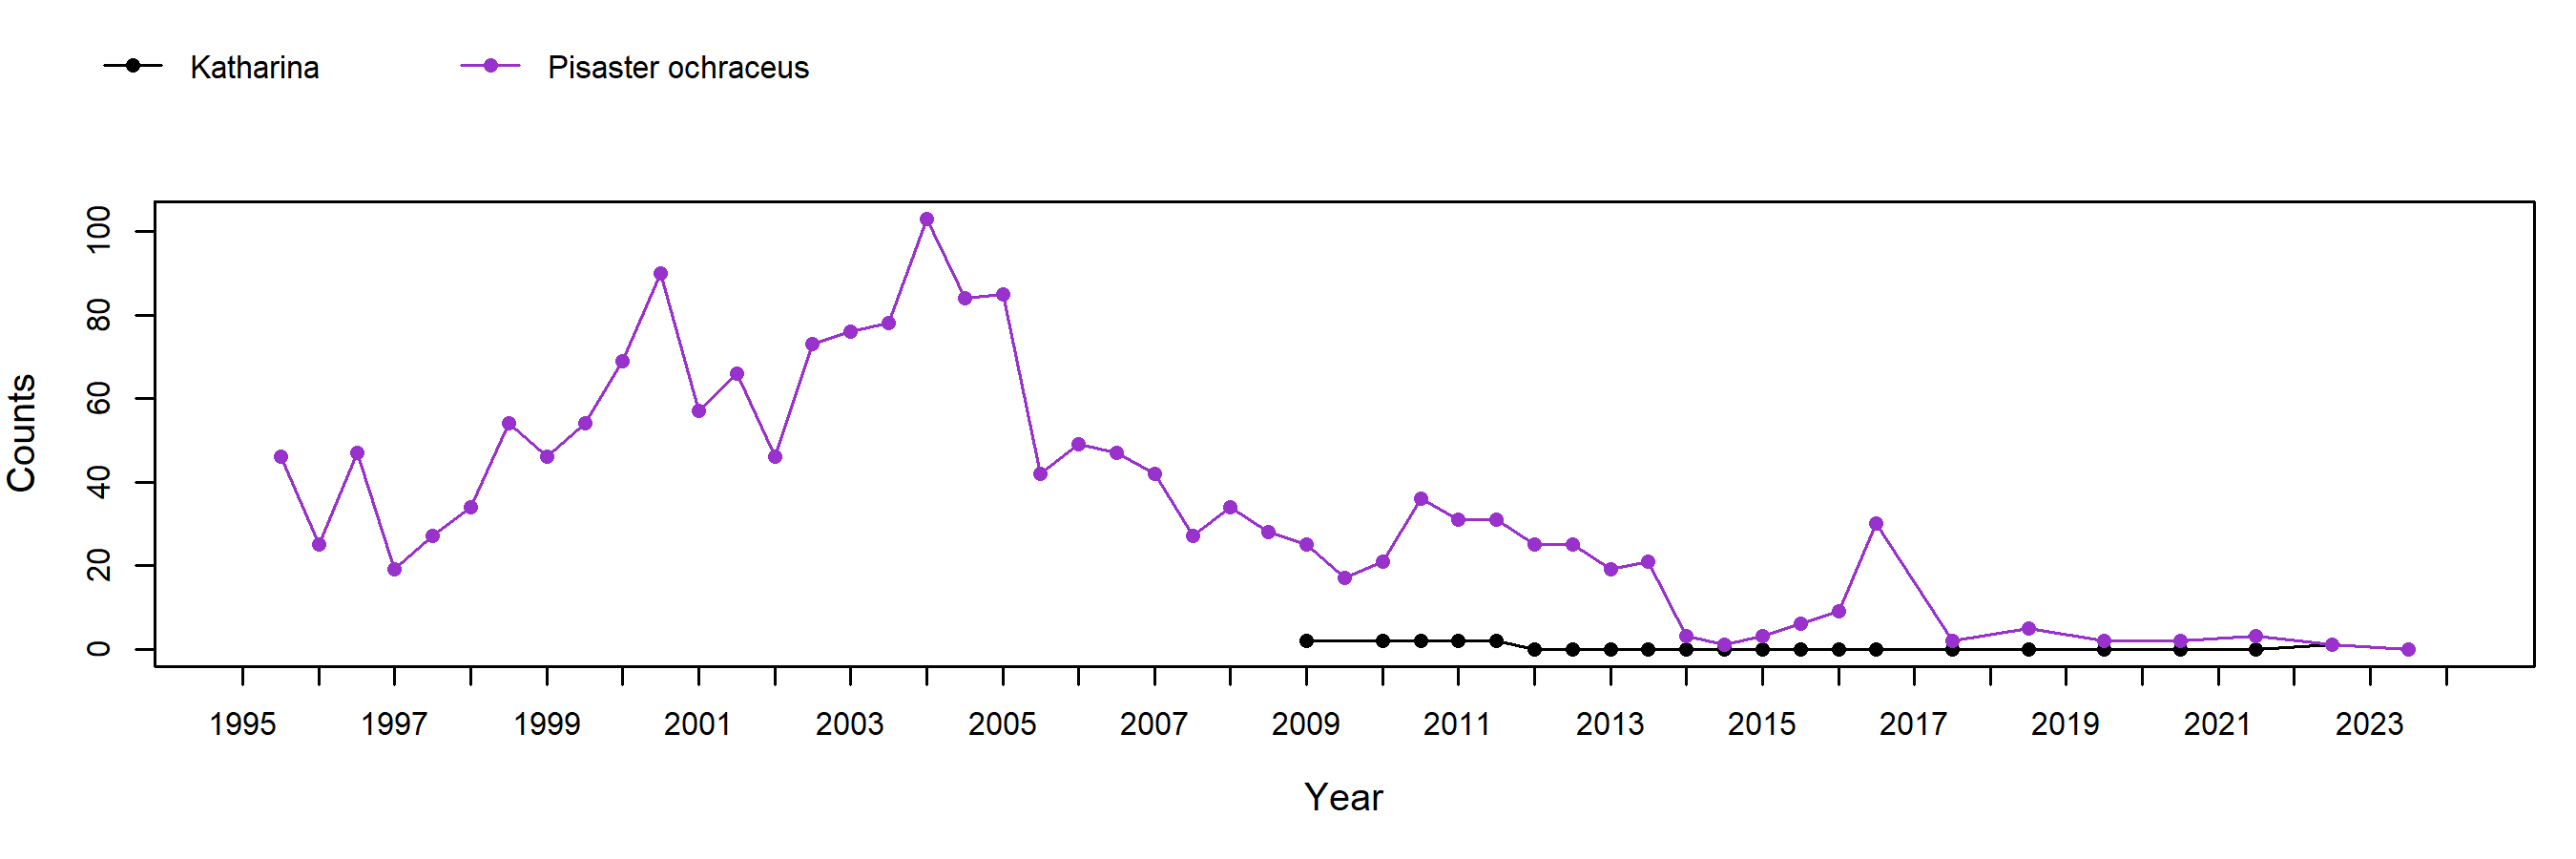
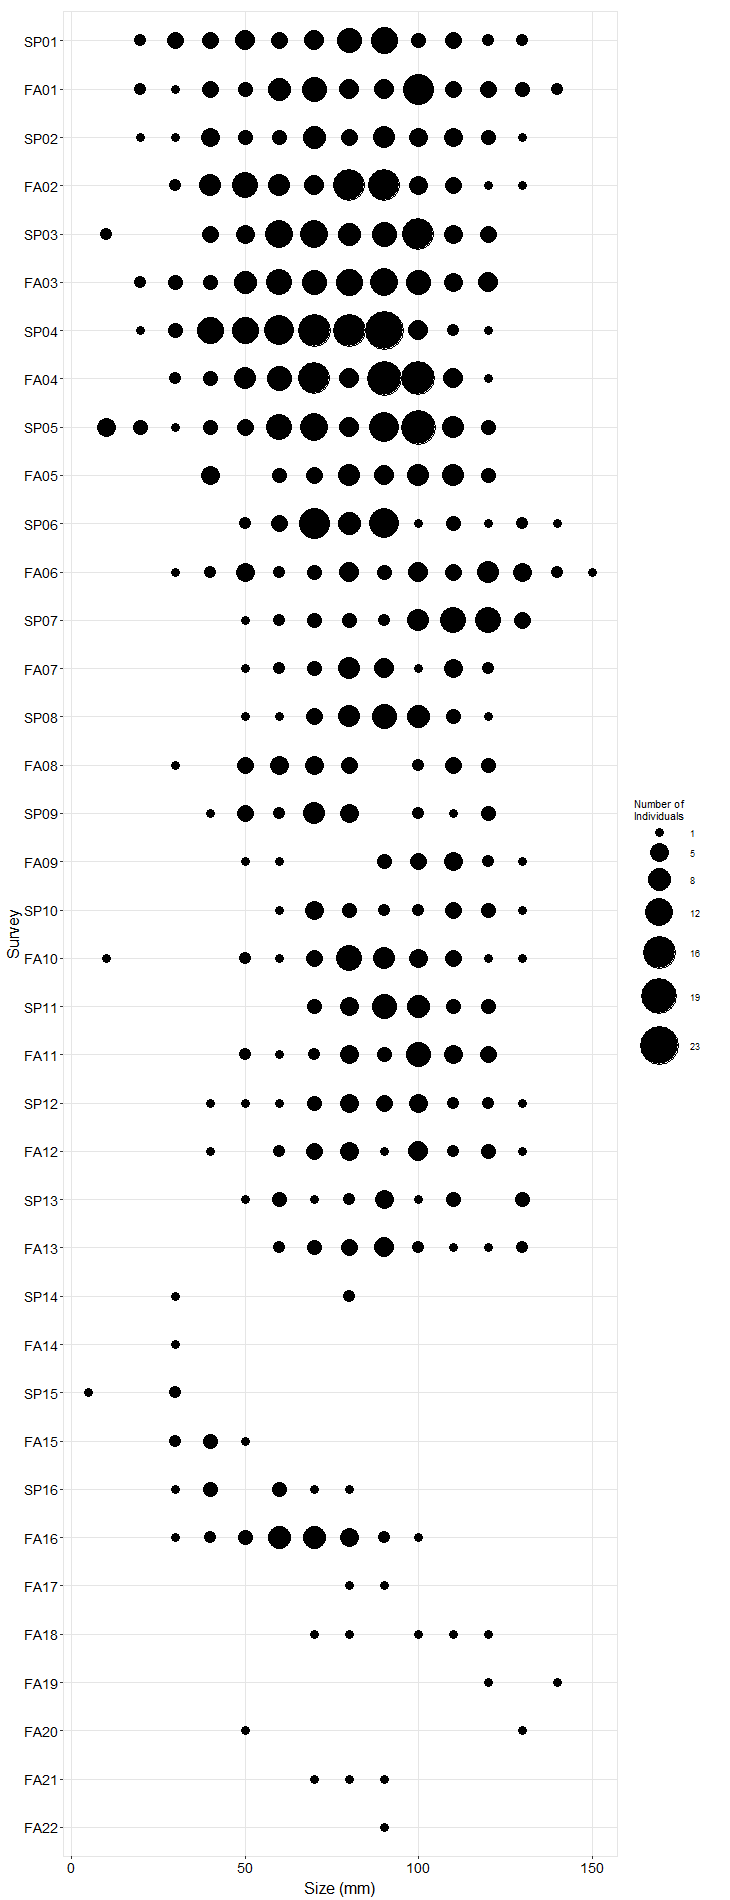
Counts for the ochre star, Pisaster ochraceus, in the seastar plots at Point Sierra Nevada varied substantially over time, and showed a slight decreasing trend over time through 2013. In 2014, sea star numbers plummeted due to wasting syndrome. Individuals were generally large, with only a few samples where significant numbers of small individuals were recorded, suggesting that recruitment to this site tends to be patchy, which could negatively influence recovery. The ochre star was the only species recorded in our plots at Point Sierra Nevada, but biodiversity surveys also documented the bat star, Patiria, the sunflower star, Pycnopodia, and the leather star, Dermasterias. Point Sierra Nevada is the southernmost site at which we find the katy chiton, Katharina tunicata, in our sea star plots, albeit at very low numbers.
Photo Plots
Below are the trends observed for each Photo Plot target species at this site. Long-Term percent cover trend graphs also include any species that reached a minimum of 25% cover during any single point in time within a given target species assemblage. Breaks in trend lines represent missed sampling events. For additional species observed that did not meet this 25% threshold, please use the Interactive Map.
For motile invertebrate Species Counts, a mean across all plots was calculated, and only those species with a value of at least 5 individuals for at least one sample are shown. Due to time constraints, motile invertebrate counts have not been done at most sites since 2012. For motile invertebrate size trend graphs by site, please use the Interactive Map.
Chthamalus/Balanus (Acorn Barnacles) - percent cover
Chthamalus/Balanus (Acorn Barnacles) - motile invertebrate counts
Mytilus (California Mussel) - percent cover
Mytilus (California Mussel) - motile invertebrate counts
Hesperophycus (Olive Rockweed) - percent cover
Hesperophycus (Olive Rockweed) - motile invertebrate counts
Silvetia (Golden Rockweed) - percent cover
Silvetia (Golden Rockweed) - motile invertebrate counts
Mastocarpus (Turkish Washcloth) - percent cover
Mazzaella (Iridescent Weed)
Transects
Below are the trends observed for each Transect target species at this site. Long-Term trend graphs also include any species that reached a minimum of 25% cover during any single point in time within a given target species assemblage. Breaks in trend lines represent missed sampling events.
Phyllospadix (Surfgrass)
Species Counts and Sizes
Species Counts and Sizes (where recorded) for Pisaster are shown below for this site. At some sites, other sea star species and Katharina are counted in addition to Pisaster. The sum of all individuals across all plots is displayed. Note that data gaps are represented by breaks in long-term count trend lines, but are not shown in size plots.
Pisaster (Ochre Star) - counts
Pisaster (Ochre Star) - sizes
Sites home
Interactive Map
pacificrockyintertidal.org home
