
Shaws Cove Long-Term trends | MARINe
Shaws Cove Long-Term trends
See below for trend graphs
In order to standardize species resolution across all MARINe groups, and over time, some species (typically rare) were lumped for graphical presentation of Long-Term monitoring data. See lumped categories for definitions (some variation occurs between methods and over time). Due to funding constraints, semi-annual sampling of plots/transects was reduced to annual sampling beginning in 2016.
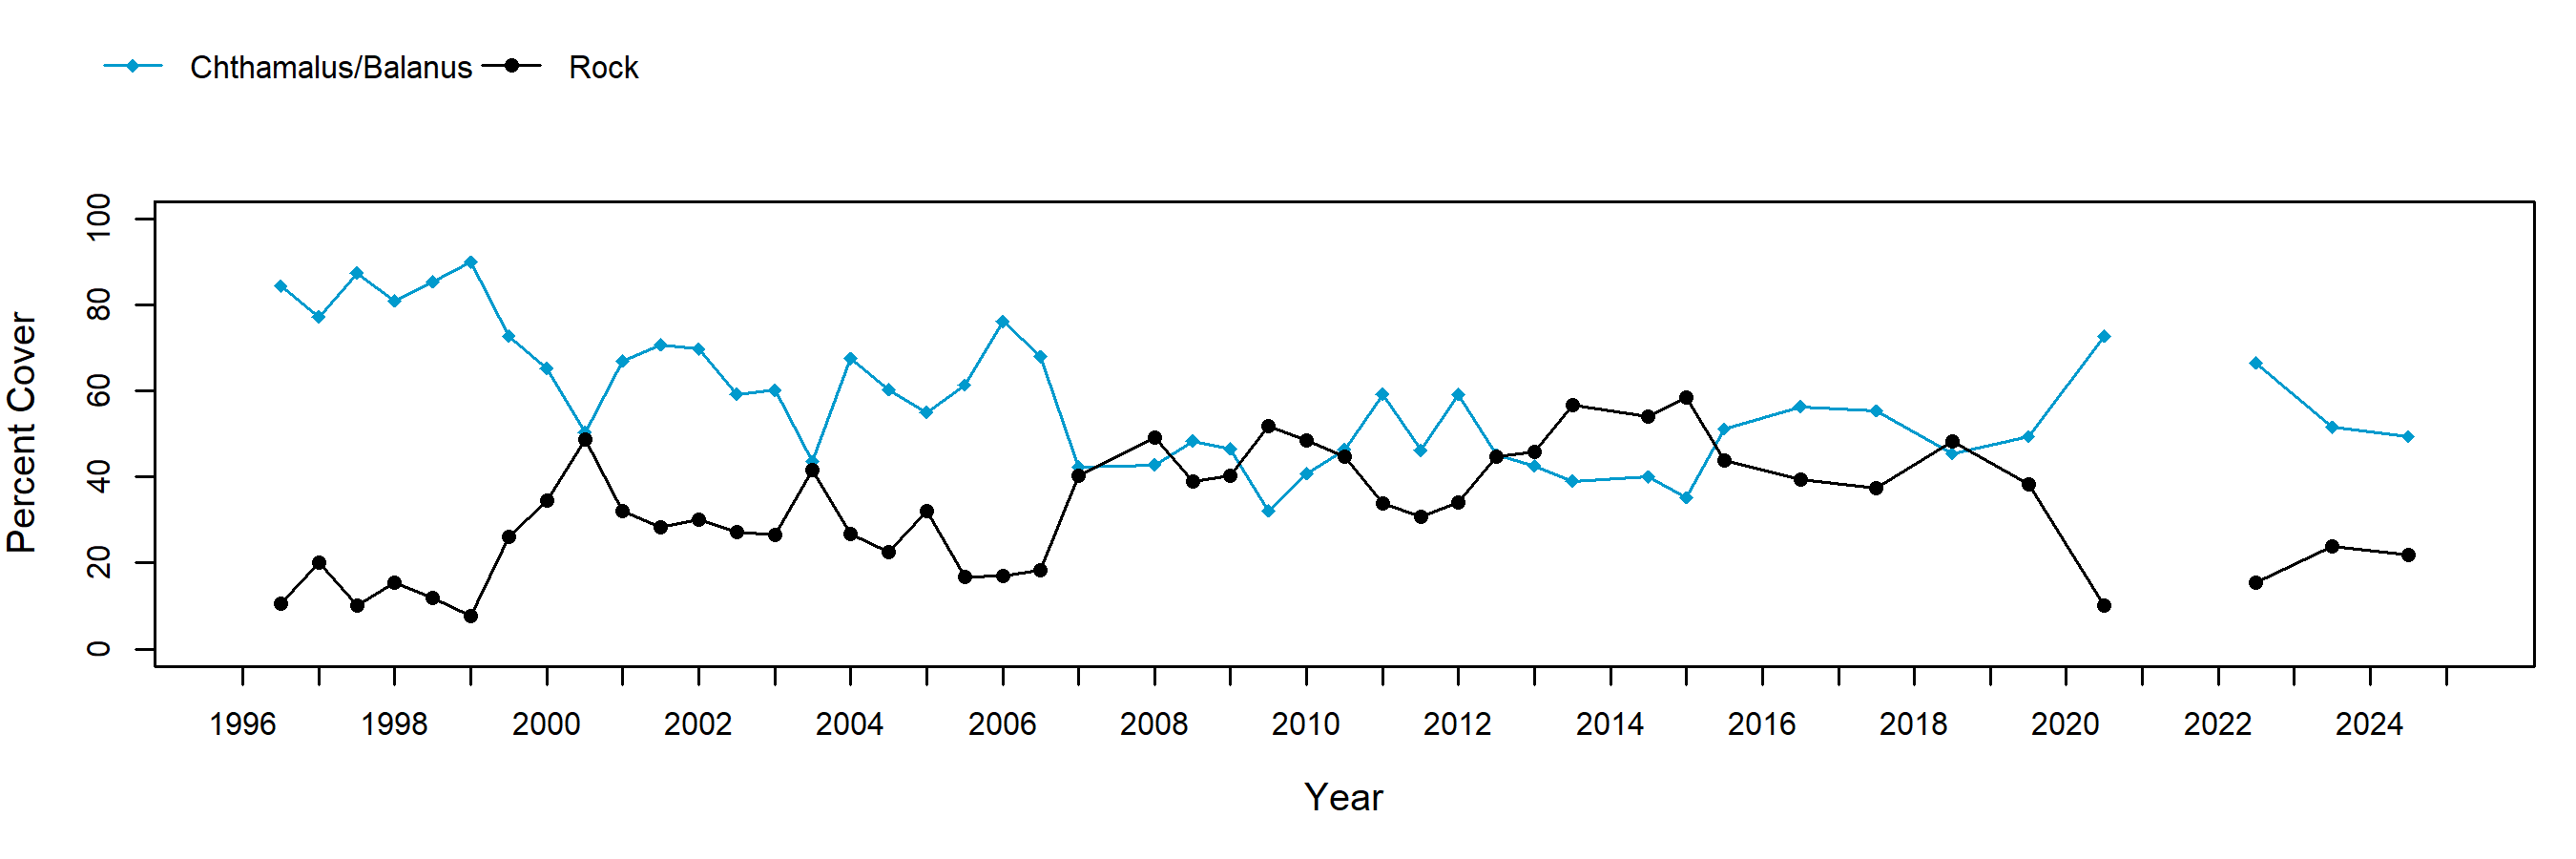
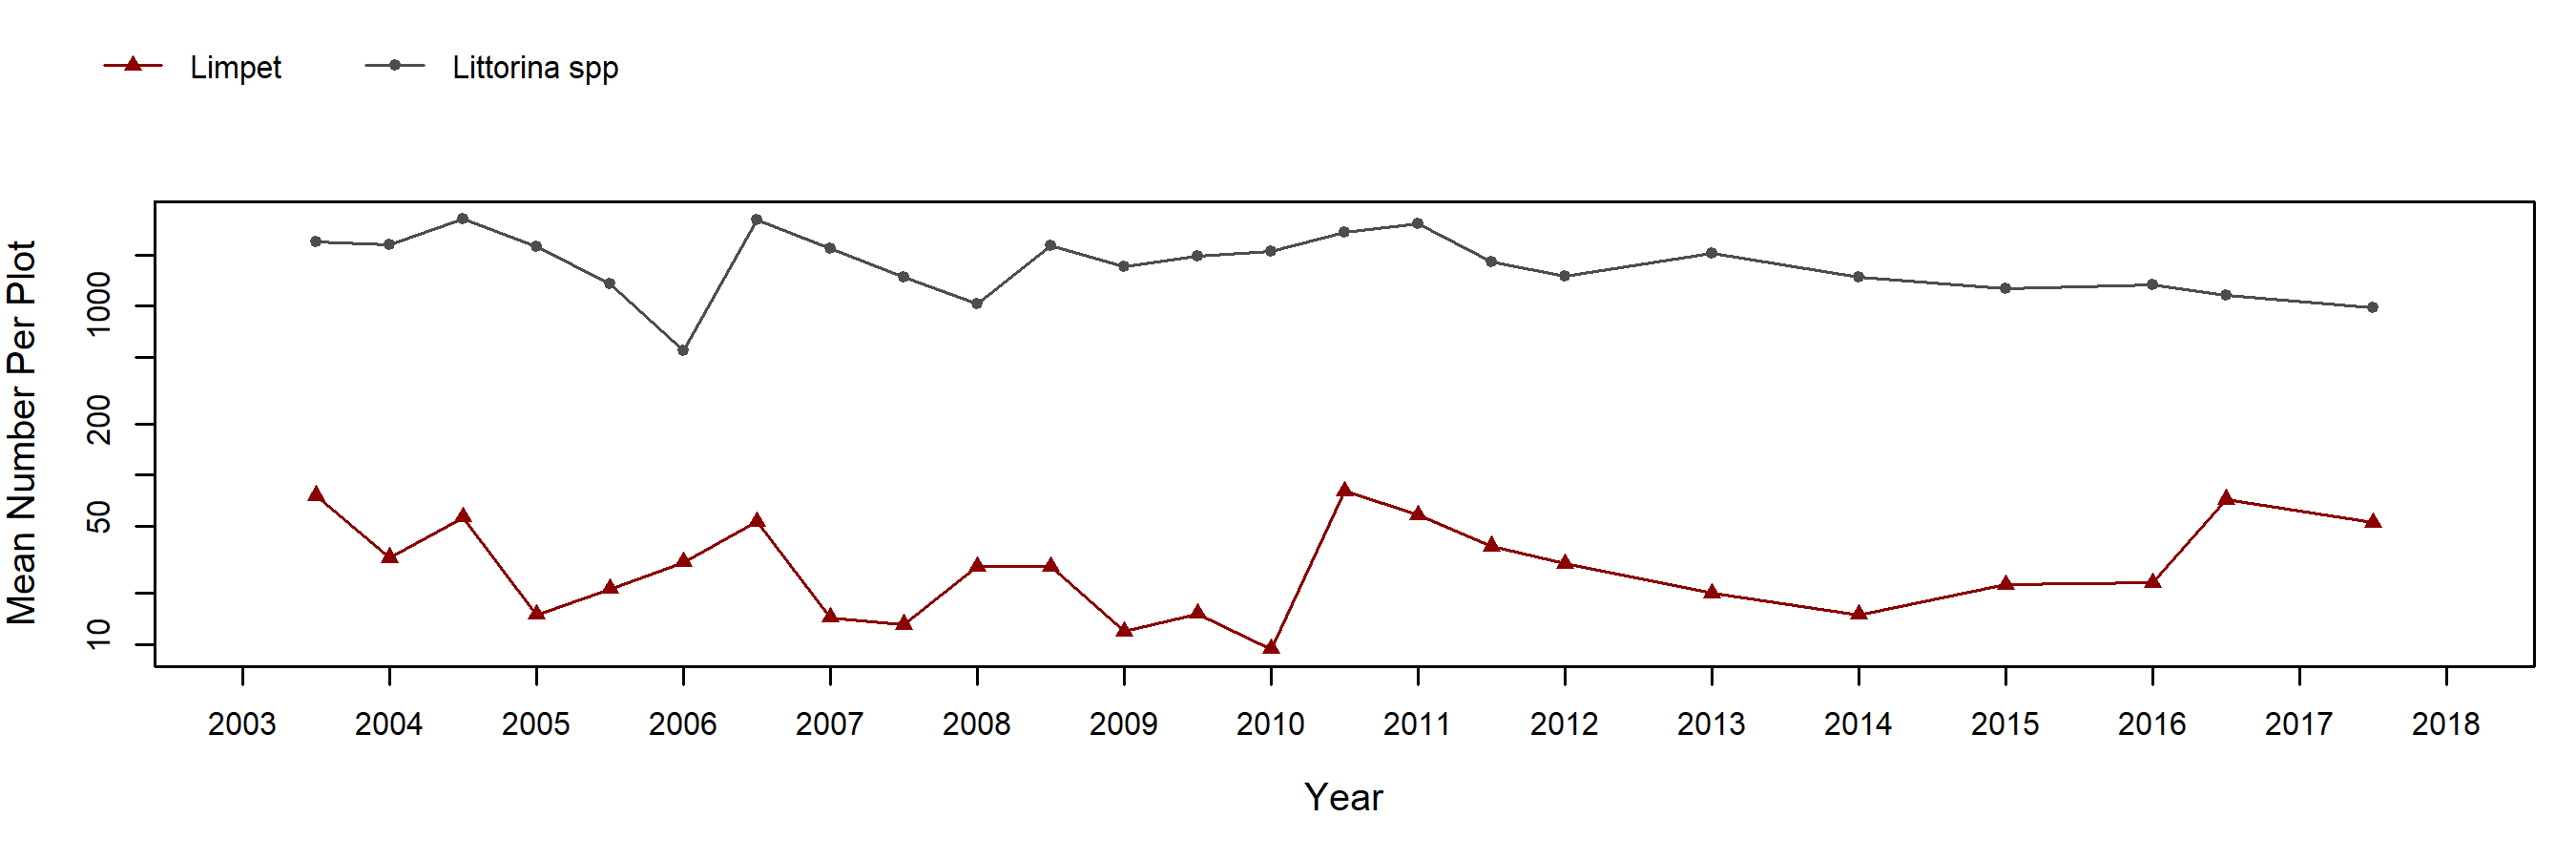
Barnacle cover at Shaws Cove has exhibited a general decline since initiation of monitoring in 1996. Acorn barnacles covered more than 80% of the surface of permanent plots upon establishment, and cover remained high through 1999 (above 70% of plot area, on average). Cover dropped slightly in 2000, and through 2007 rarely exceeded 70% of plot area on average. Cover dropped further in 2007, and through 2019 only approximately half of the area in these plots was covered by barnacles. While other species do occur in the plots at low abundance (for example, non-coralline crusts typically average less than 2% cover in these plots with a maximum of close to 7% average cover in Fall 2009) most of the area not covered by barnacles is scored as bare rock. In Fall of 1998, the red alga Endocladia encroached into barnacle plots with an average cover of ~2.5%; in subsequent seasons this alga was occasionally noted but average cover never exceeded 2%. On rare occasions, recruitment of the brown alga Hesperophycus was observed, but individuals typically died off before the next sampling period. In motile invertebrate surveys in barnacle plots, high numbers of periwinkles (genus Littorina: exceeding 1000 individuals / plot on average) and variable numbers of small limpets (10 – 100 / plot, on average) have been recorded.
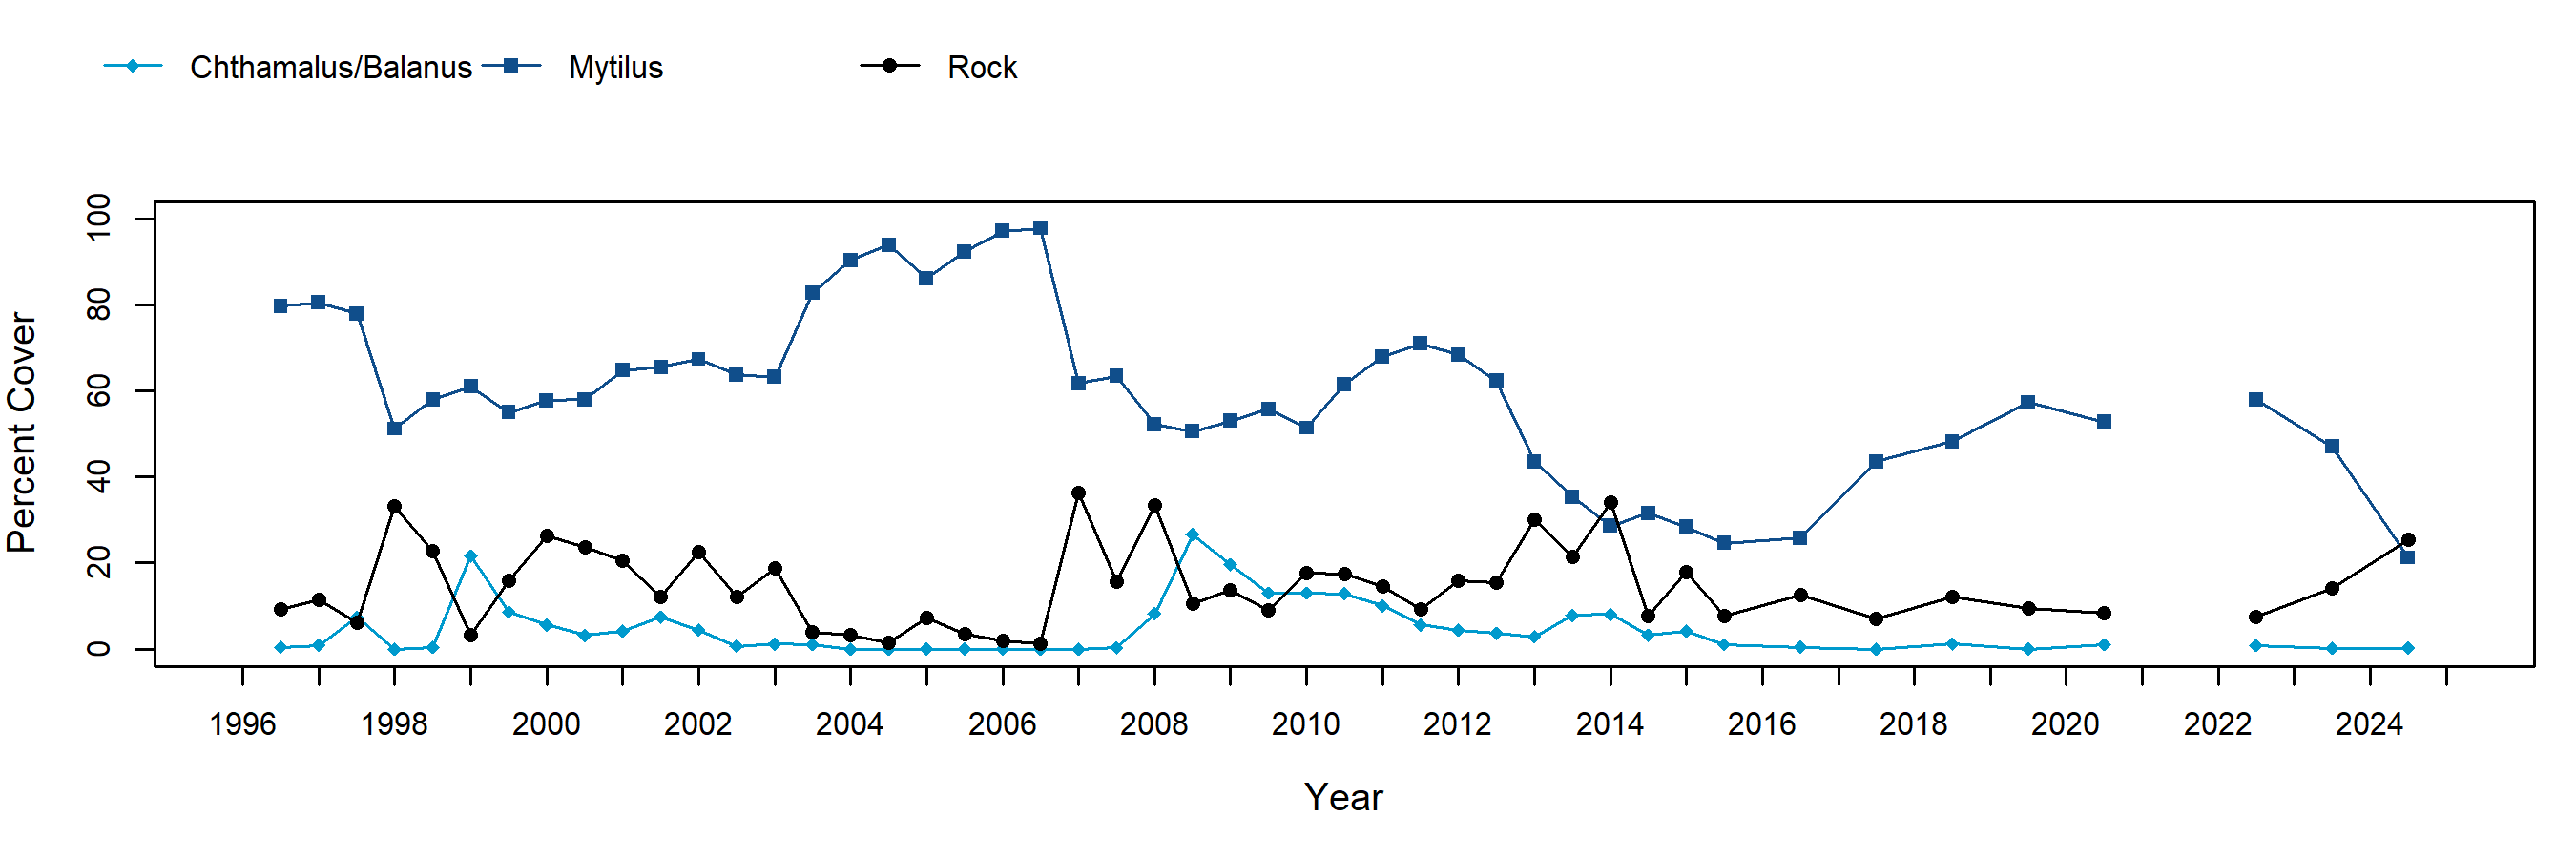
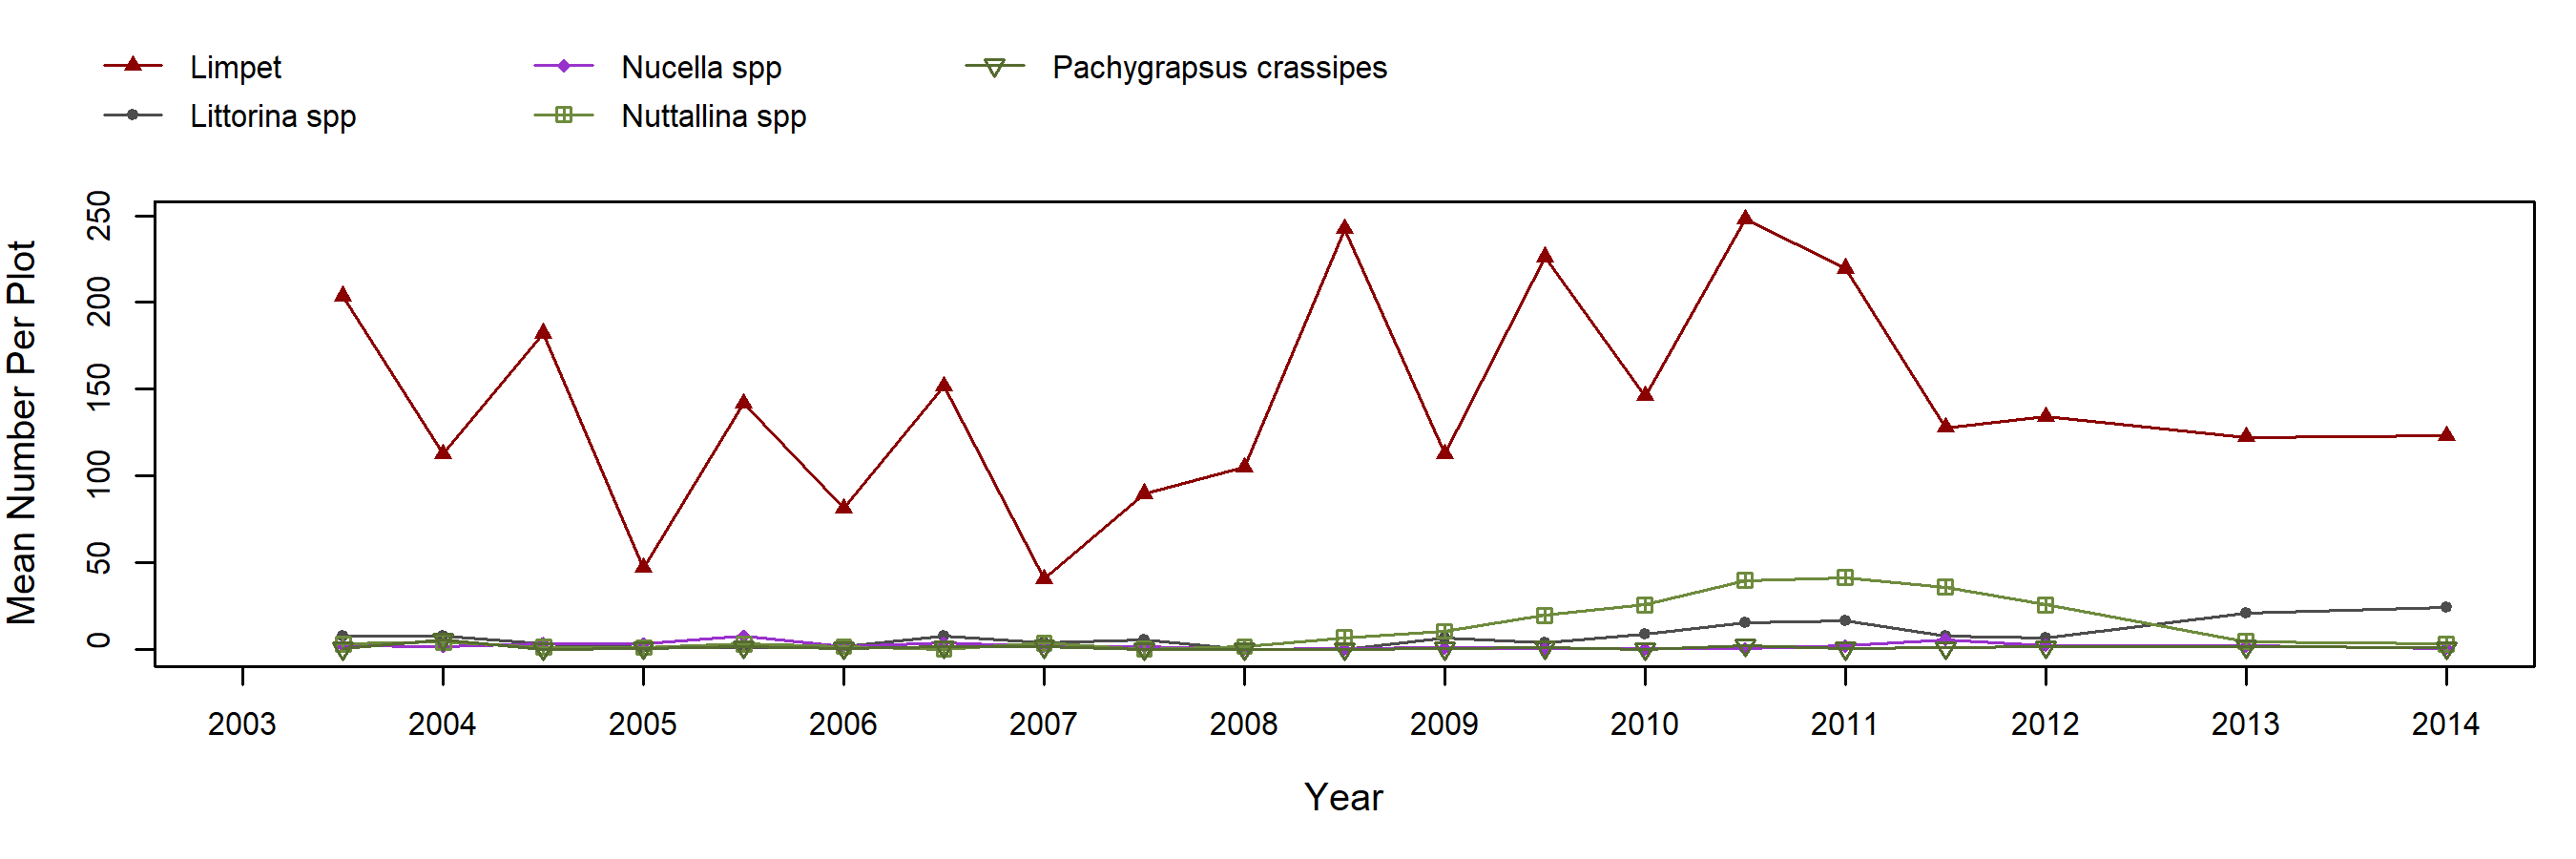
Mussel cover was high (~80%, on average) from the establishment of permanent plots in 1996 through Fall 1997. Cover declined during the 1997-1998 El Niño in a manner similar to other sites in this region (see Treasure Island, Dana Point, and Crystal Cove) and remained at this lower level (on average, around 60 % cover) through 2003. During this period of lowered mussel cover, the surveys recorded a moderate amount of bare rock cover and low cover of barnacles, crustose corallines, articulated corallines, and non-coralline crusts. Mussel cover increased by more than 20% (on average) between Spring and Fall 2003, as gaps within the mussel patches were filled by the movement of adult mussels (recruitment did not appear to play a role). Cover remained high until a storm accompanied by large waves hit the site in spring 2007. Two plots were almost completely denuded of mussels, while other plots remained undisturbed, and the average cover of mussels in the plots declined by approximately 35%. In disturbed plots, there was an increase in cover of the ephemeral alga Ulva in fall 2007 followed by a steady increase of barnacles which replaced Ulva in 2008 and 2009. After the drop in mussel cover in 2007, mean cover remained relatively constant for three years before increasing again in 2010. From Fall 2012 - 2016, mussel cover declined at the site, dropping below 50% average cover for the first time since sampling was started at this location. Since 2017, mussel cover has been on a steady rise, with an increase of ~20% cover in 2017 from the previous sampling period. From 2013 – 2017, the area previously occupied by mussels remained as bare rock, while low abundances of barnacles (Chthamalus, Balanus, and Tetraclita) and articulated corallines were found in some plots. In motile invertebrate surveys in mussel plots, the abundance of limpets demonstrated a clear seasonal pattern, with higher numbers present in plots in Fall surveys than in Spring surveys (note that spring surveys were discontinued after 2011). Other species of molluscs (Nuttallina spp, Littorina spp, and Nucella spp) and arthropods (Pachygrapsus crassipes) were occasionally encountered in mussel plots.
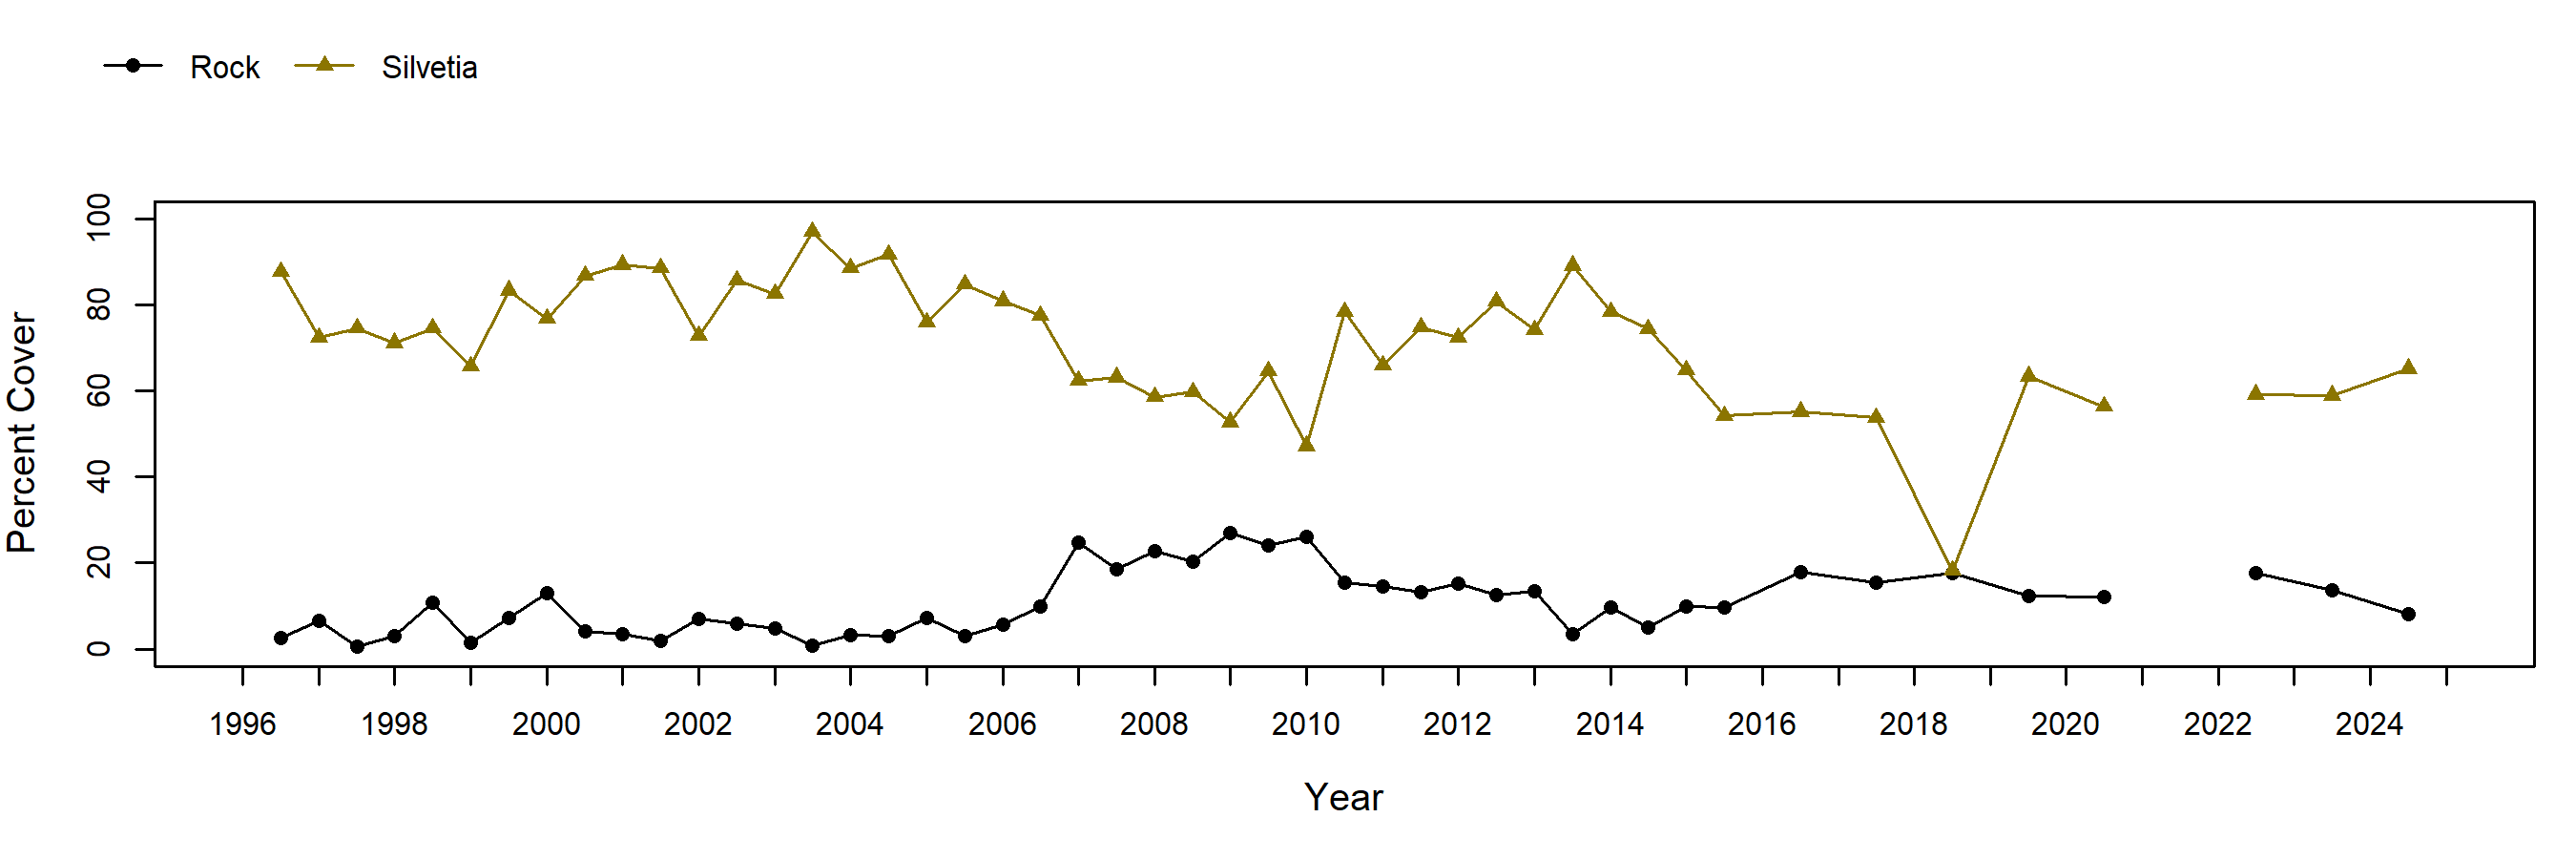
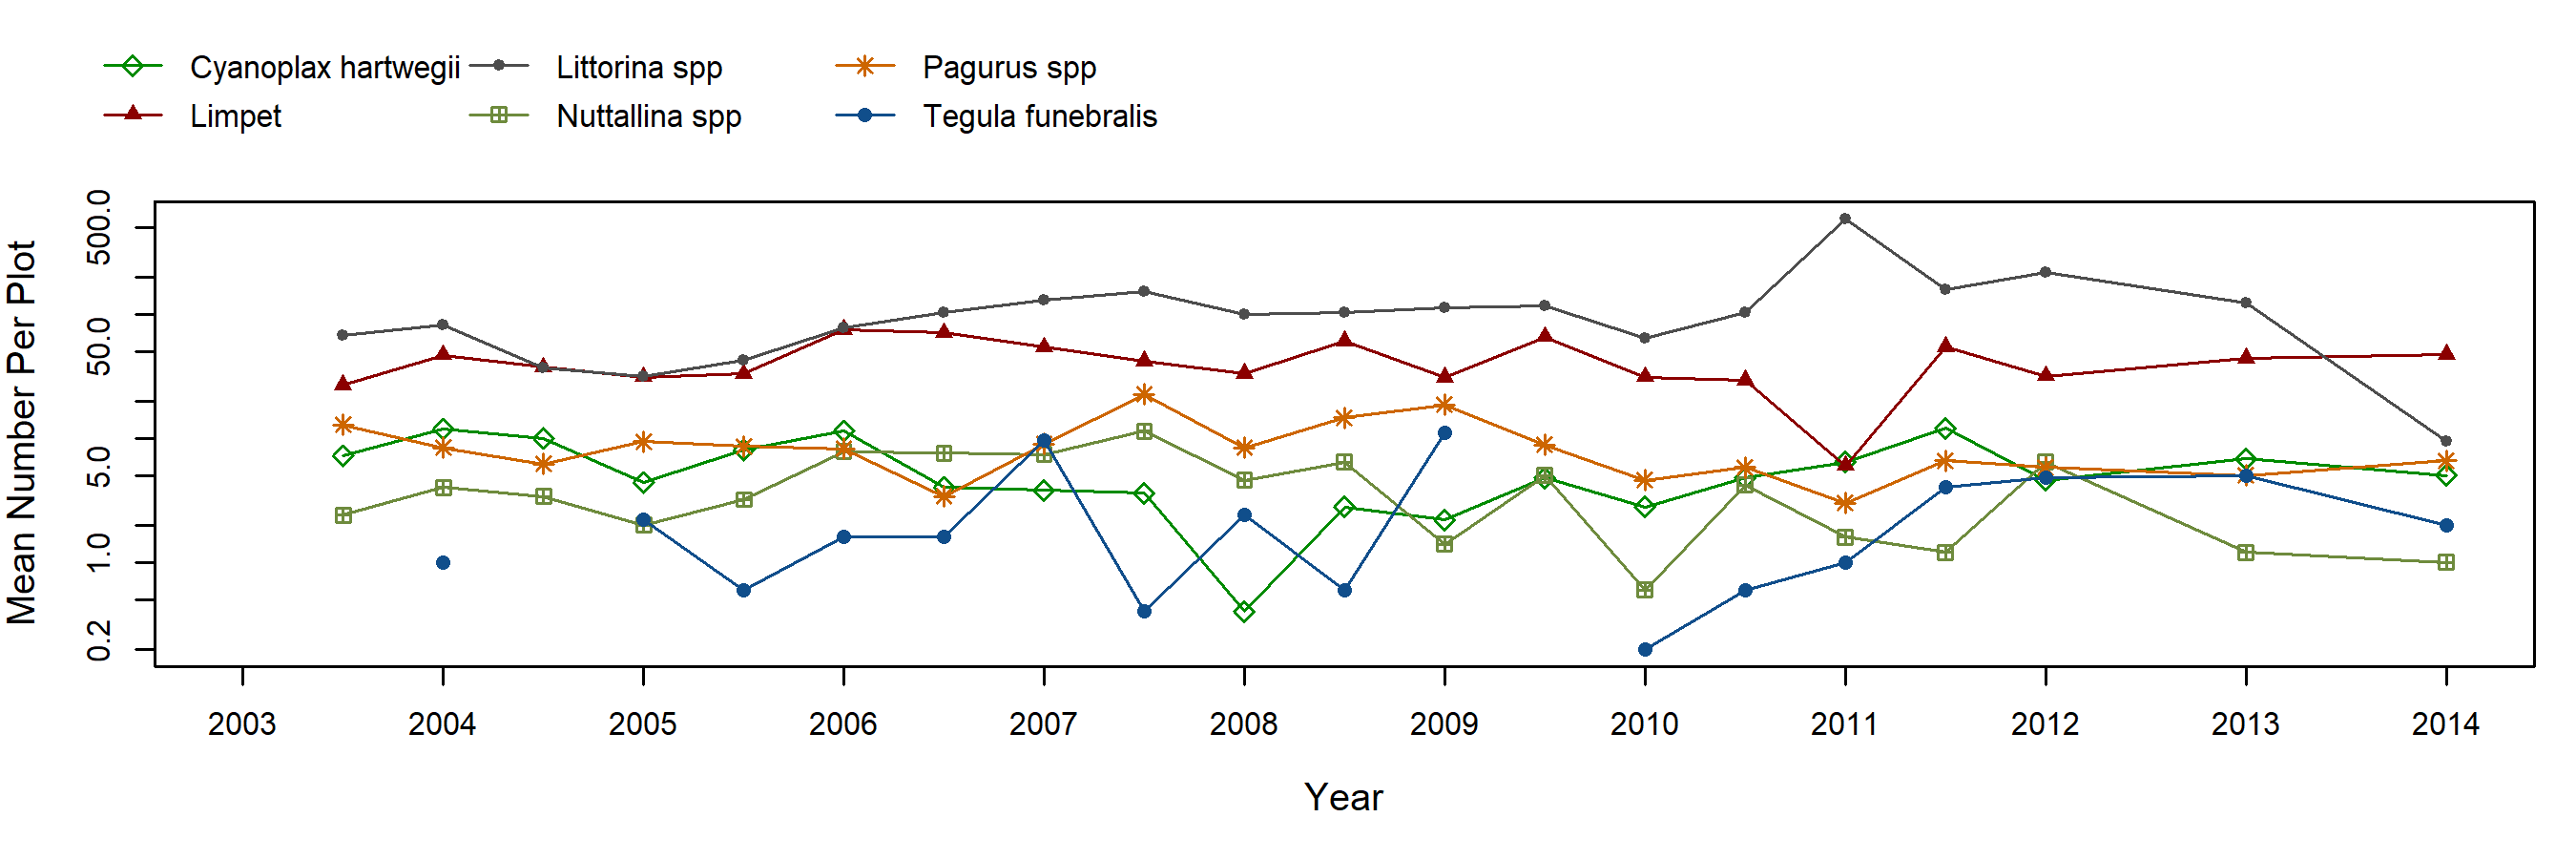
Rockweeds at Shaws Cove exhibited variations in cover within and across years with a pattern of generally higher cover in the fall than in the spring sampling periods. From 1996 to 2006, cover remained generally high (on average above 60%). Mean cover in the permanent plots declined noticeably in 2006, driven in part by loss of cover in a single plot. Cover in that single plot dropped to 0% in Fall 2008 and remained low through 2010. As cover in the plot began to increase again in 2011, the average cover increased to levels similar to those recorded pre-2004. Silvetia cover exceeded 70% of plot area, on average, from Fall 2011 - 2015. In Fall 2015 cover dropped again to a mean of ~55%, and subsequently remained steady until a drastic drop in Fall 2018. In 2019, however, cover had rebounded and again exceeded 60% (on average). When Silvetia cover was low, most of the plot area was bare rock, although we also observed low cover of crustose algae, the red alga Caulacanthus, articulated corallines, and mussels. Articulated and crustose corallines were particularly abundant from 2015 – 2018 (on average, articulated corallines 5-13% cover, crustose corallines 7-19% cover). Several species of motile invertebrates have been found consistently in rockweed plots. Periwinkles and limpets are the most commonly encountered animals, but chitons, turban snails, and hermit crabs have also been recorded at variable but low numbers over the years.
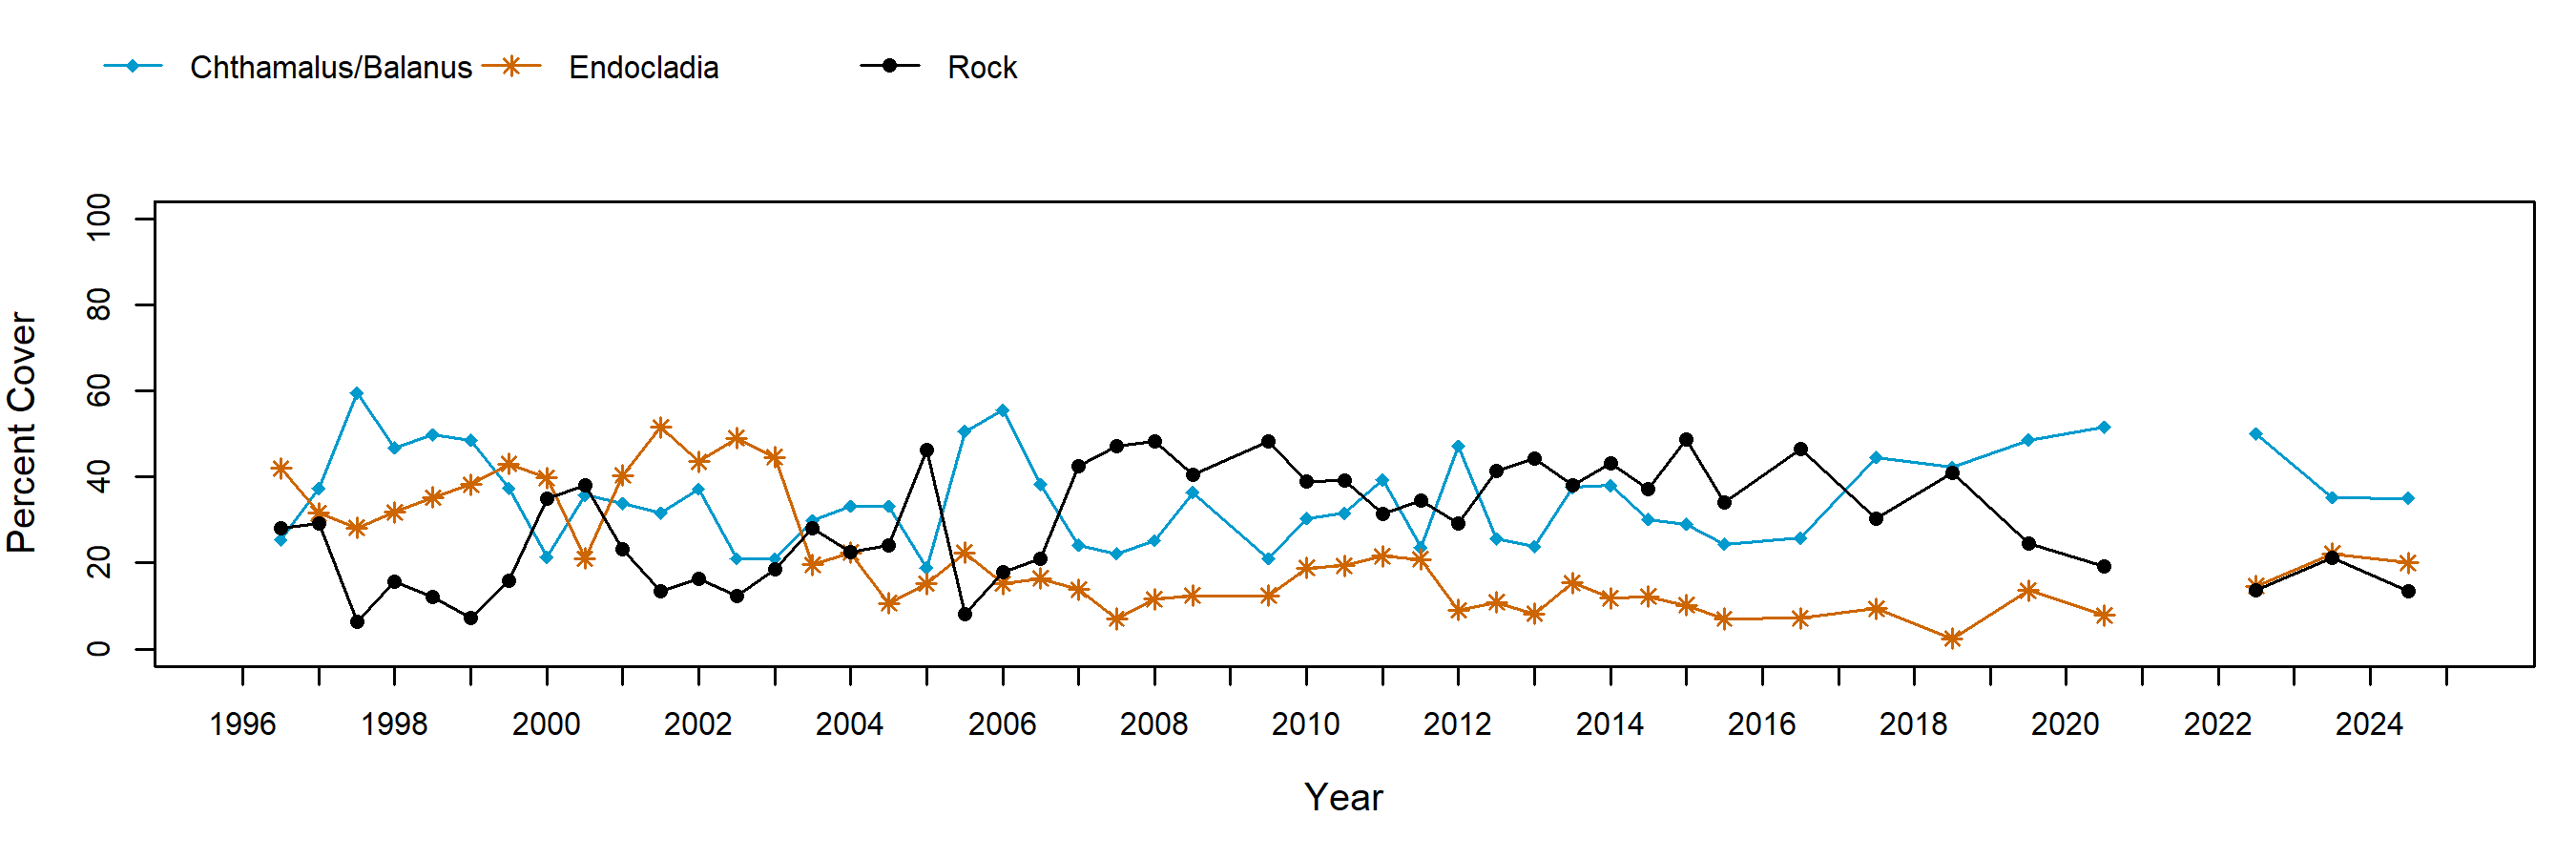
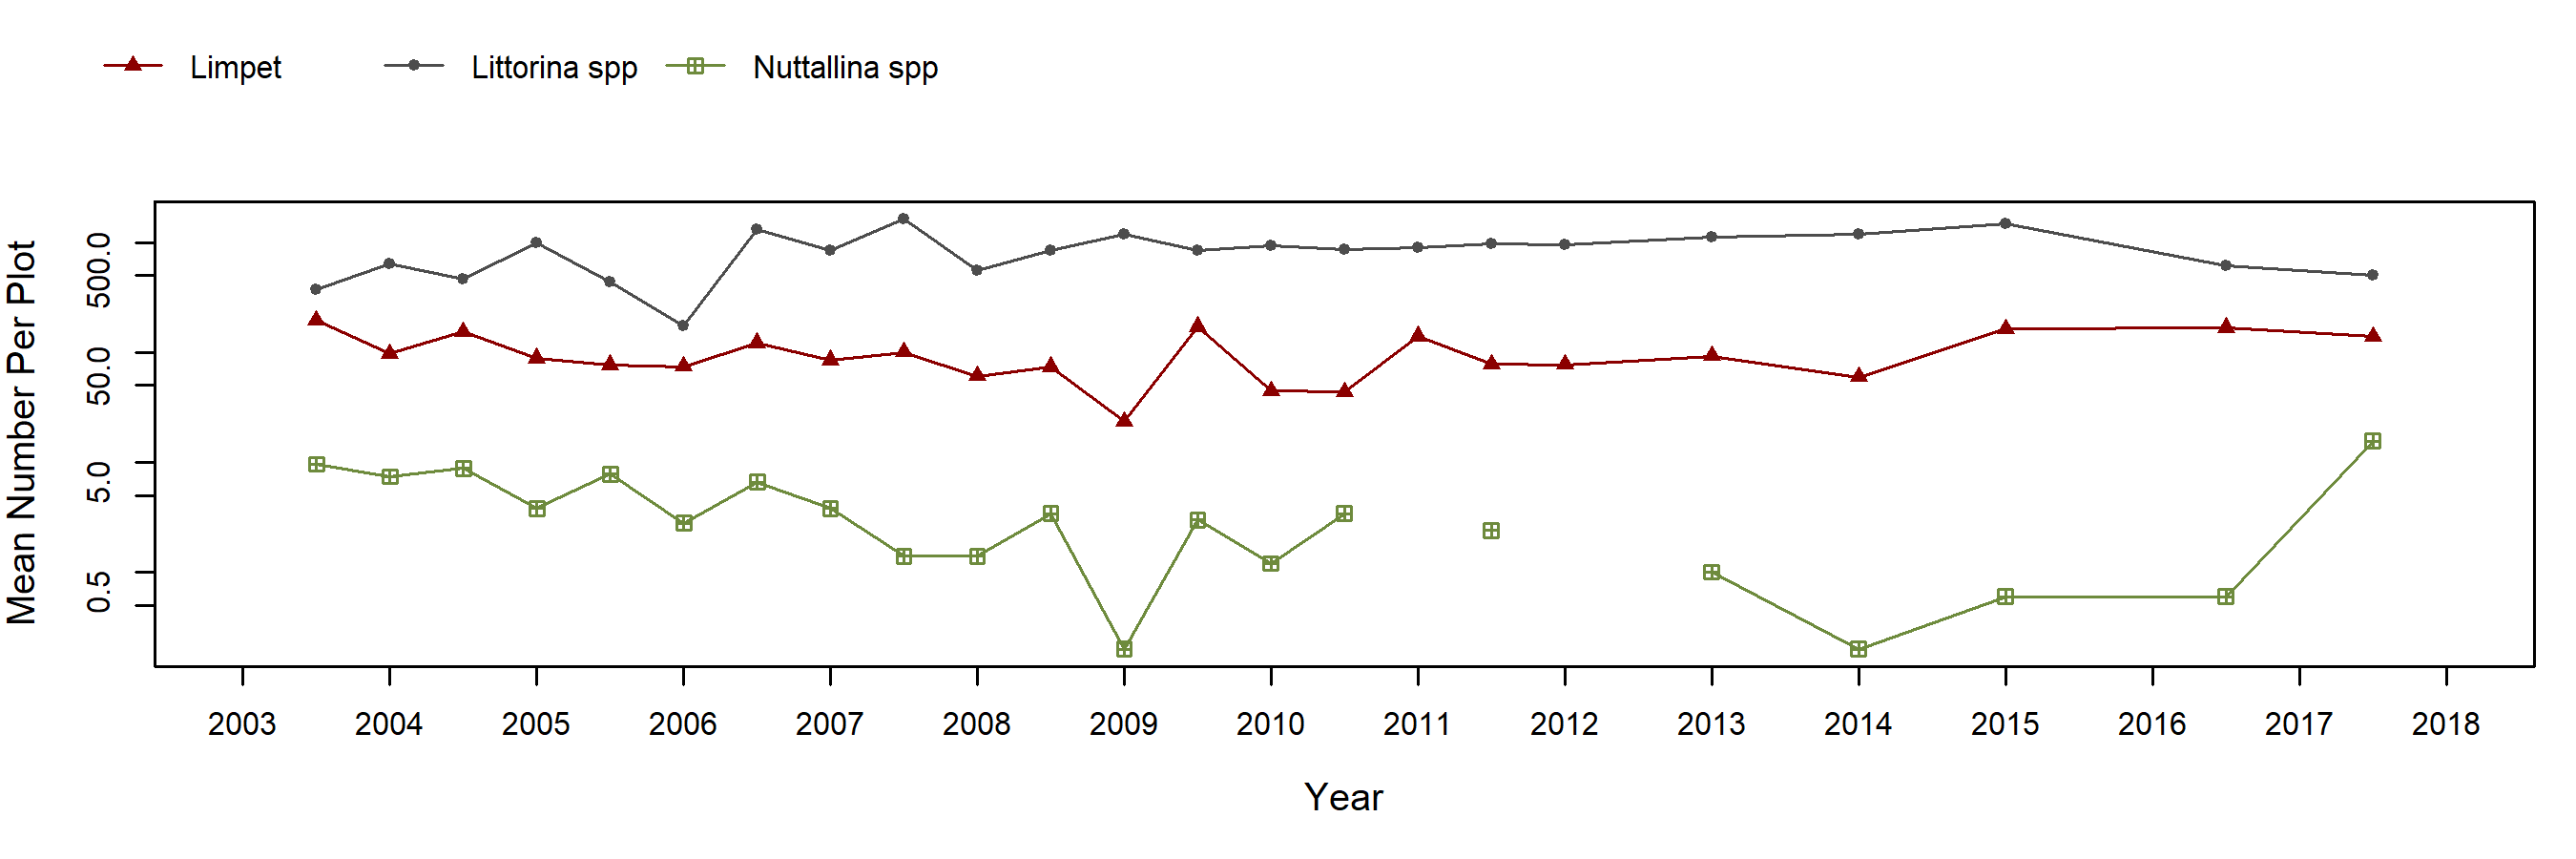
Abundance of the red alga Endocladia (turfweed) has varied greatly (from an average of 2 to 52% cover) at Shaws Cove since initiation of monitoring in 1996. Cover of Endocladia was at its highest from Spring 2001 to Spring 2003 with values between 40 and 50%. Large losses (~20% cover) occurred in Fall 2000, Fall 2003, and Fall 2007. Bleaching may have been a factor in the loss of cover in 2003: observers noted damaged thalli during annual sampling, and several patches of the turfweed were gone by the next sampling period. In Fall 2007, Endocladia cover dropped to a low of 7%, and after a moderate increase from 2008 – 2011, declined again in Spring 2012. Cover remained under 20% of plot area on average until it dropped again to a new all-time low of 2% (average across the five plots) in 2018 before increasing slightly in 2019. Portions of the plot not covered by Endocladia were primarily recorded as bare rock or covered with acorn barnacles. Barnacle cover, on average, hovered around 30% with peaks above 50% cover in Fall 1997, Spring 2006, and Spring 2012. The golden rockweed (Silvetia) is occasionally found in Endocladia plots, reaching a peak of 20% in Fall 2004. However rockweed distribution in Endocladia plots is extremely patchy: most of the cover in 2004 was limited to two plots located adjacent to a rockweed bed. After 2004, rockweed cover dropped again and has not exceeded 3% of plot area on average since 2007. Motile invertebrate counts were dominated by Littorina spp. and limpets with numbers remaining relatively stable over the years.
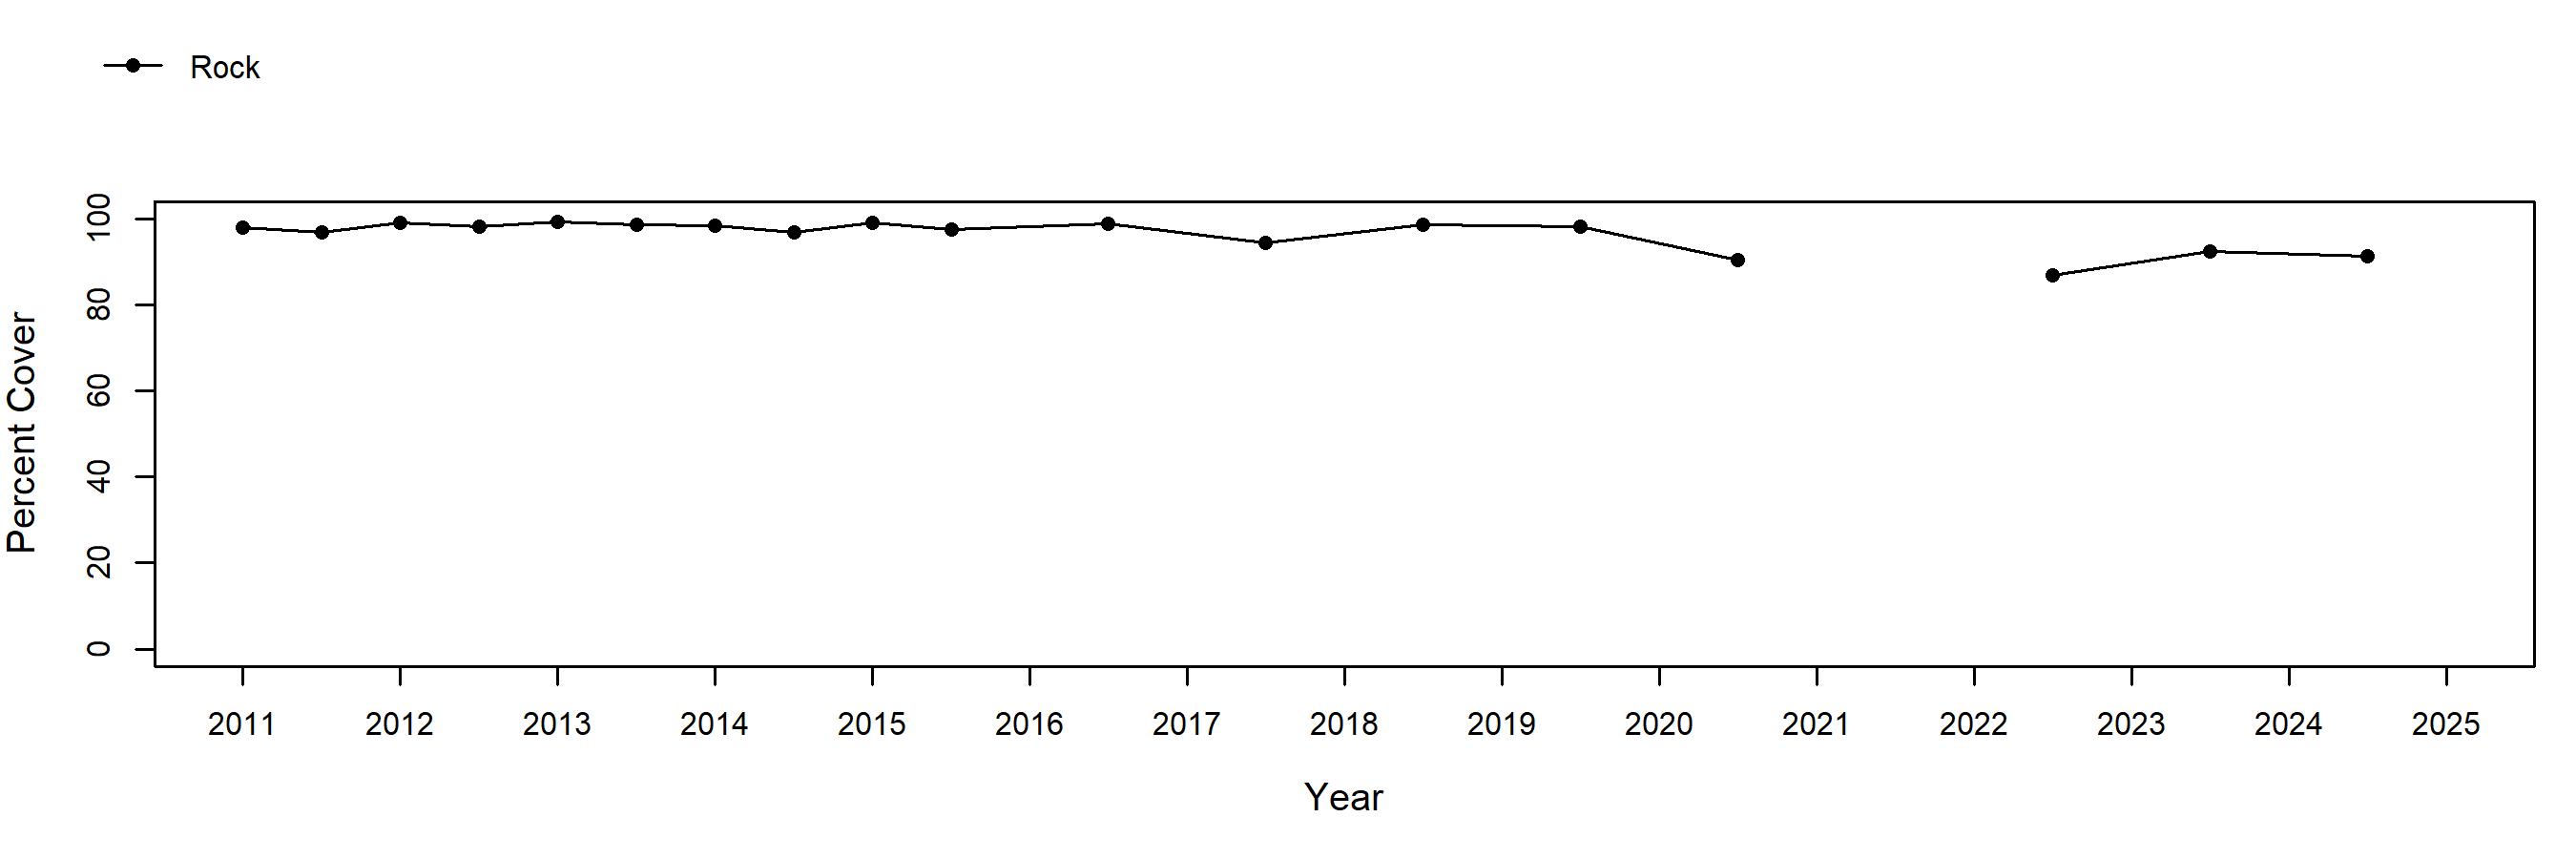
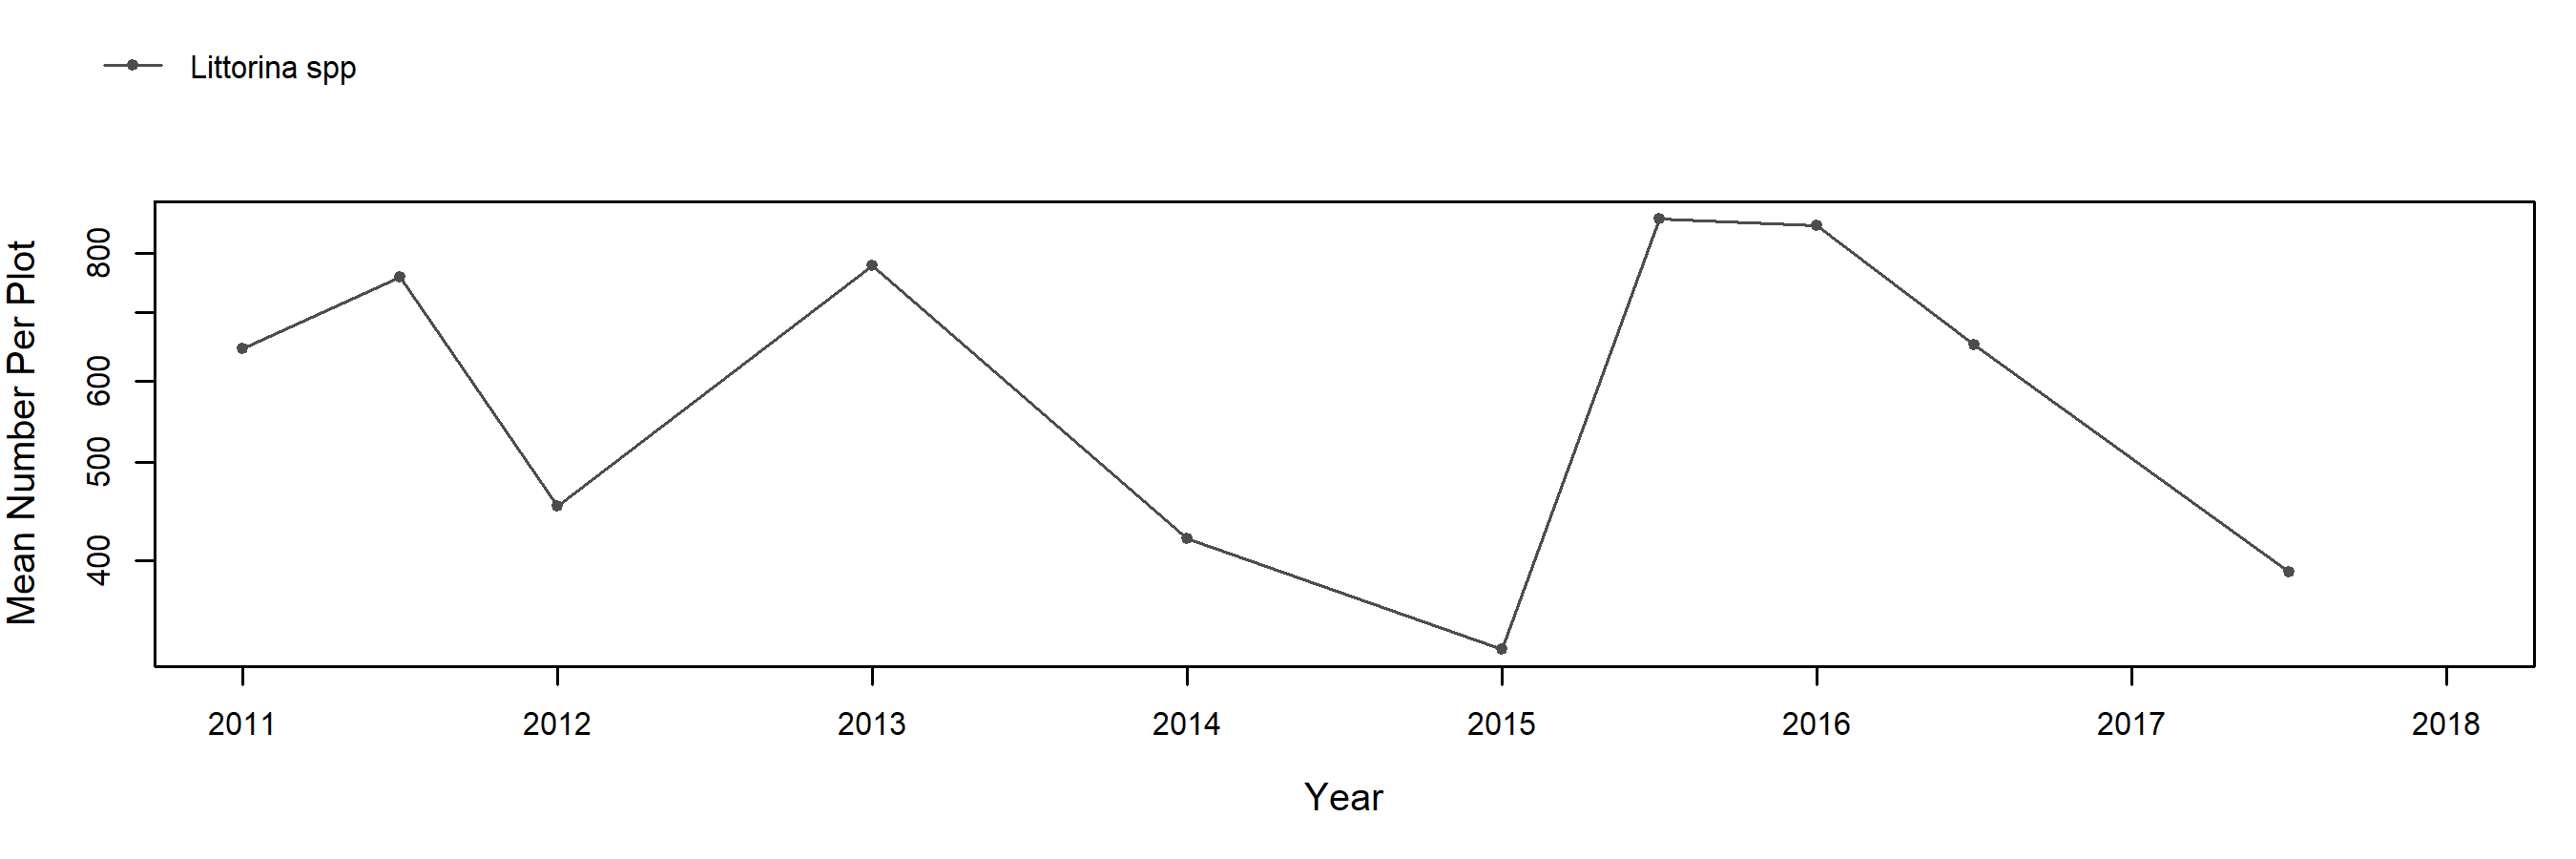
Rock plots were established at this site in Fall 2011 in areas above the barnacle zone. In general, the cover of these plots consisted almost entirely of bare rock. Motile invertebrates encountered in rock plots were primarily Littorina snails, which were present at high but variable numbers (on average, 400 – 800 individuals per plot).
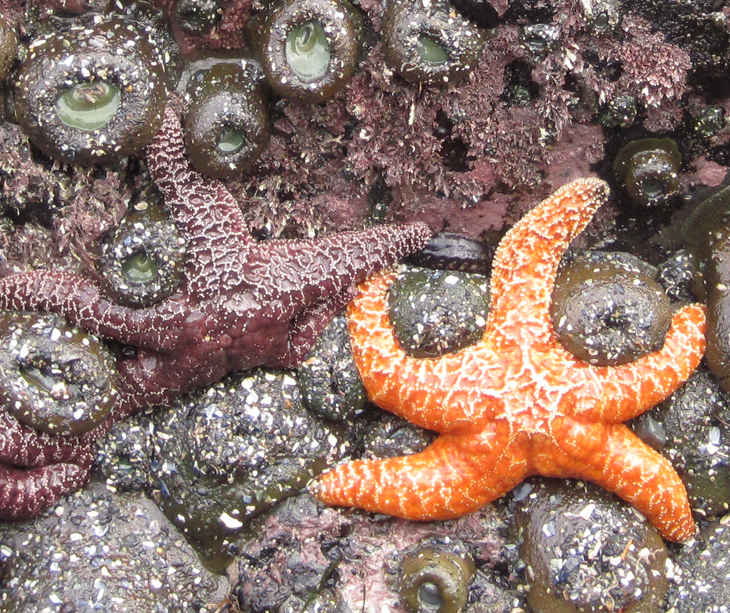
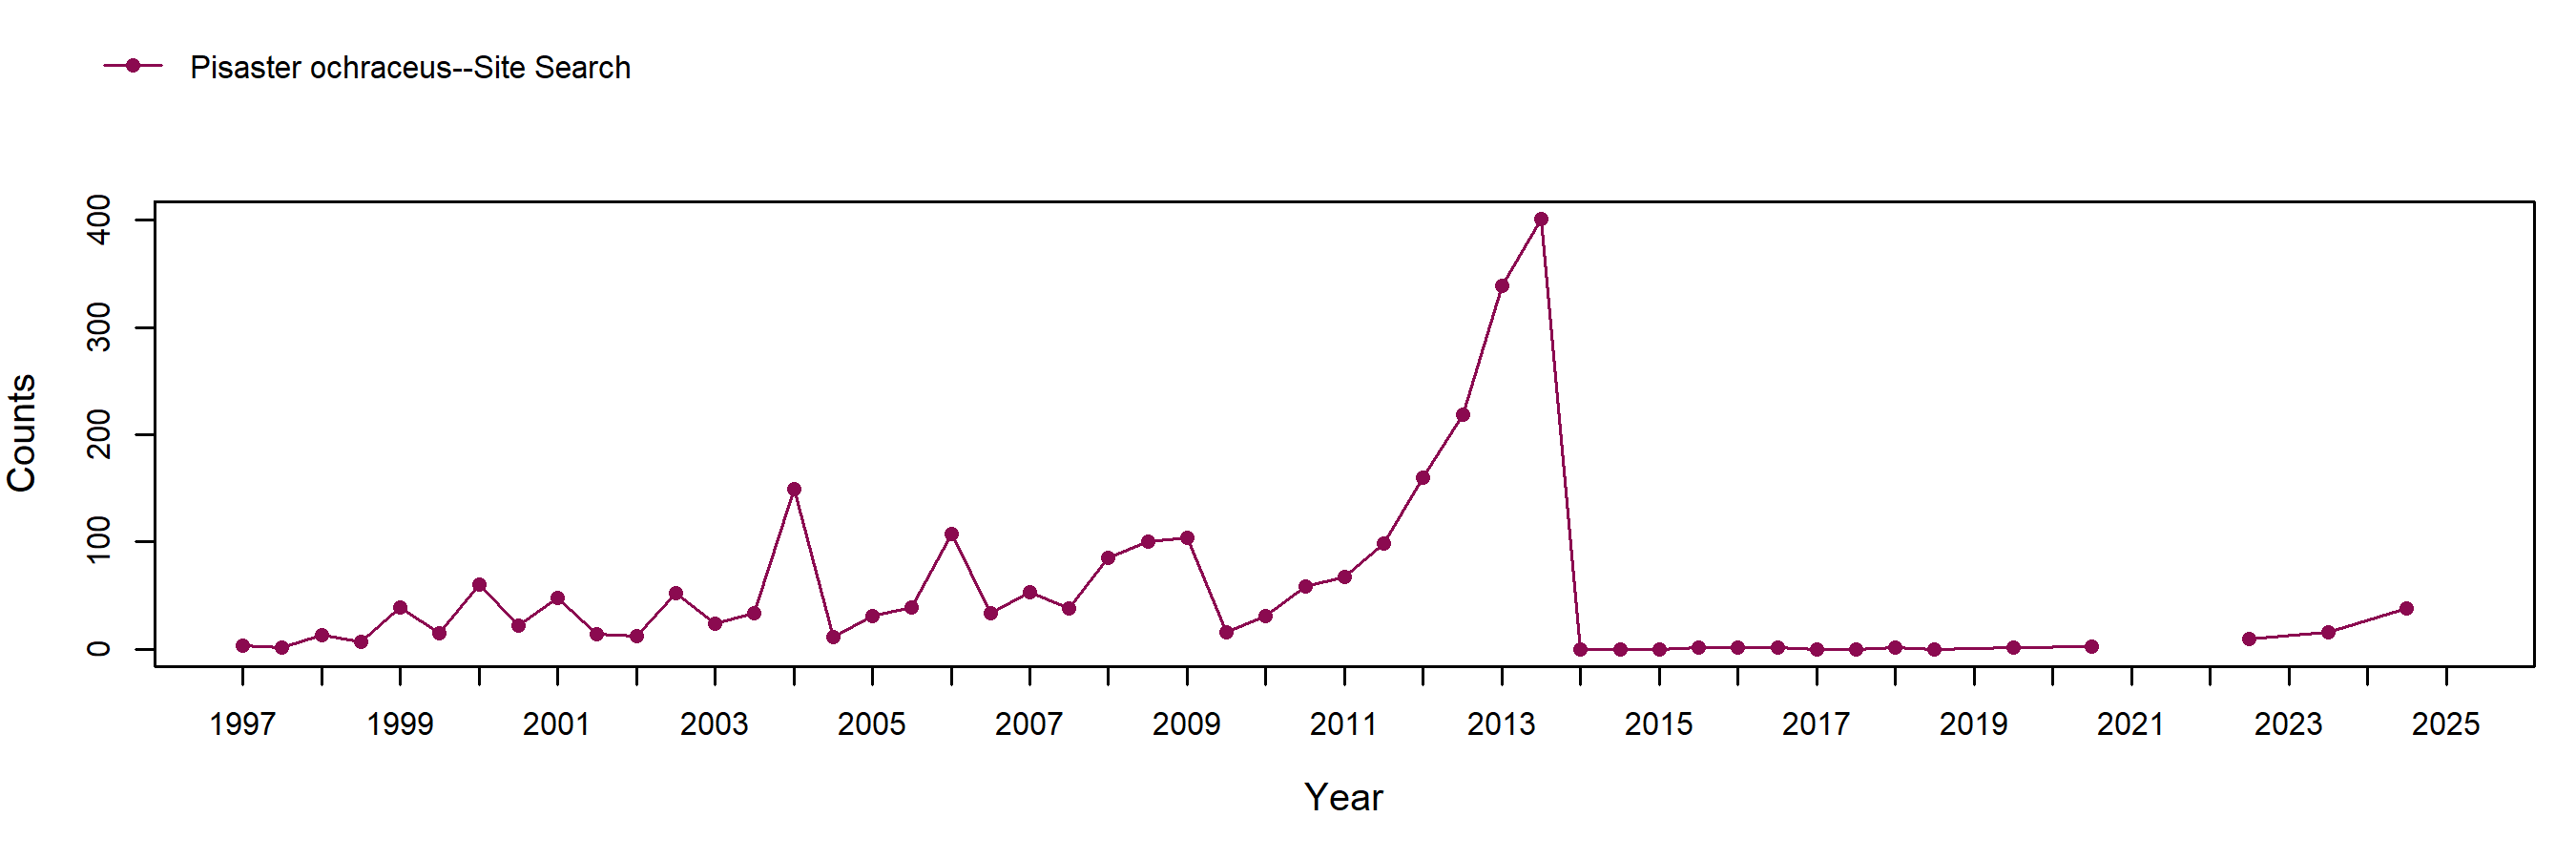
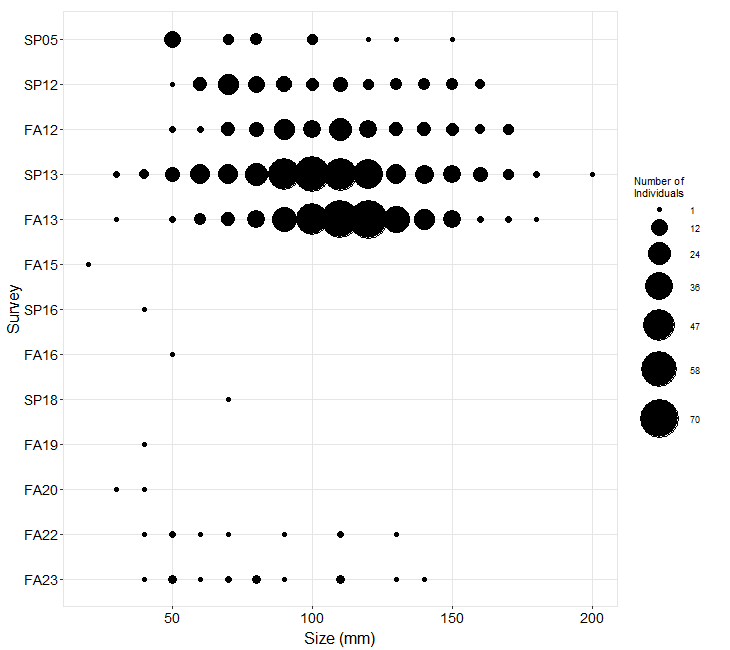
At Shaws Cove, sea stars are counted in site-wide surveys. For most of the sampling period, fewer than 60 individuals were counted in each survey, with occasional peaks of high abundance (in 2004, 2006, and 2008-2009) of approximately 100 individuals per survey. Increasing numbers of sea stars were encountered at the site between 2010 and 2012, with more dramatic increases noted in late 2012 and early 2013. Approximately 400 sea stars were counted at the site in Fall 2013, the highest number ever recorded here. No signs of sea star wasting syndrome were noted during this survey, although symptoms were observed in sea stars at nearby Orange County sites a few days after the Shaws Cove survey had been completed. In Spring 2014, no Pisaster were observed at this site; Sea Star Wasting Syndrome is a likely contributor to this sharp decline. Pisaster abundance has remained extremely low since 2014: from 2015 – 2019, no more than 1 individual was encountered in any single survey. From 2012 (when size measurements were started) through 2014, the population of Pisaster at Shaws Cove included individuals of a wide range of sizes (from < 50 mm to 200 mm) with most individuals measuring between 80 to 130 mm. Only small individuals (< 80 mm) were encountered from Fall 2015 to Fall 2019.
Photo Plots
Below are the trends observed for each Photo Plot target species at this site. Long-Term percent cover trend graphs also include any species that reached a minimum of 25% cover during any single point in time within a given target species assemblage. Breaks in trend lines represent missed sampling events. For additional species observed that did not meet this 25% threshold, please use the Interactive Map.
For motile invertebrate Species Counts, a mean across all plots was calculated, and only those species with a value of at least 5 individuals for at least one sample are shown. Due to time constraints, motile invertebrate counts have not been done at most sites since 2012. For motile invertebrate size trend graphs by site, please use the Interactive Map.
Chthamalus/Balanus (Acorn Barnacles) - percent cover
Chthamalus/Balanus (Acorn Barnacles) - motile invertebrate counts
Mytilus (California Mussel) - percent cover
Mytilus (California Mussel) - motile invertebrate counts
Silvetia (Golden Rockweed) - percent cover
Silvetia (Golden Rockweed) - motile invertebrate counts
Endocladia (Turfweed) - percent cover
Endocladia (Turfweed) - motile invertebrate counts
Rock (Above Barnacles)
Rock (Above Barnacles) - motile invertebrate counts
Species Counts and Sizes
Species Counts and Sizes (where recorded) for Pisaster are shown below for this site. At some sites, other sea star species and Katharina are counted in addition to Pisaster. The sum of all individuals across all plots is displayed. Note that data gaps are represented by breaks in long-term count trend lines, but are not shown in size plots.
Pisaster ochraceus (Ochre Star) - counts
Pisaster ochraceus (Ochre Star) - sizes
See Also
