Long-Term Monitoring Trend Graphs
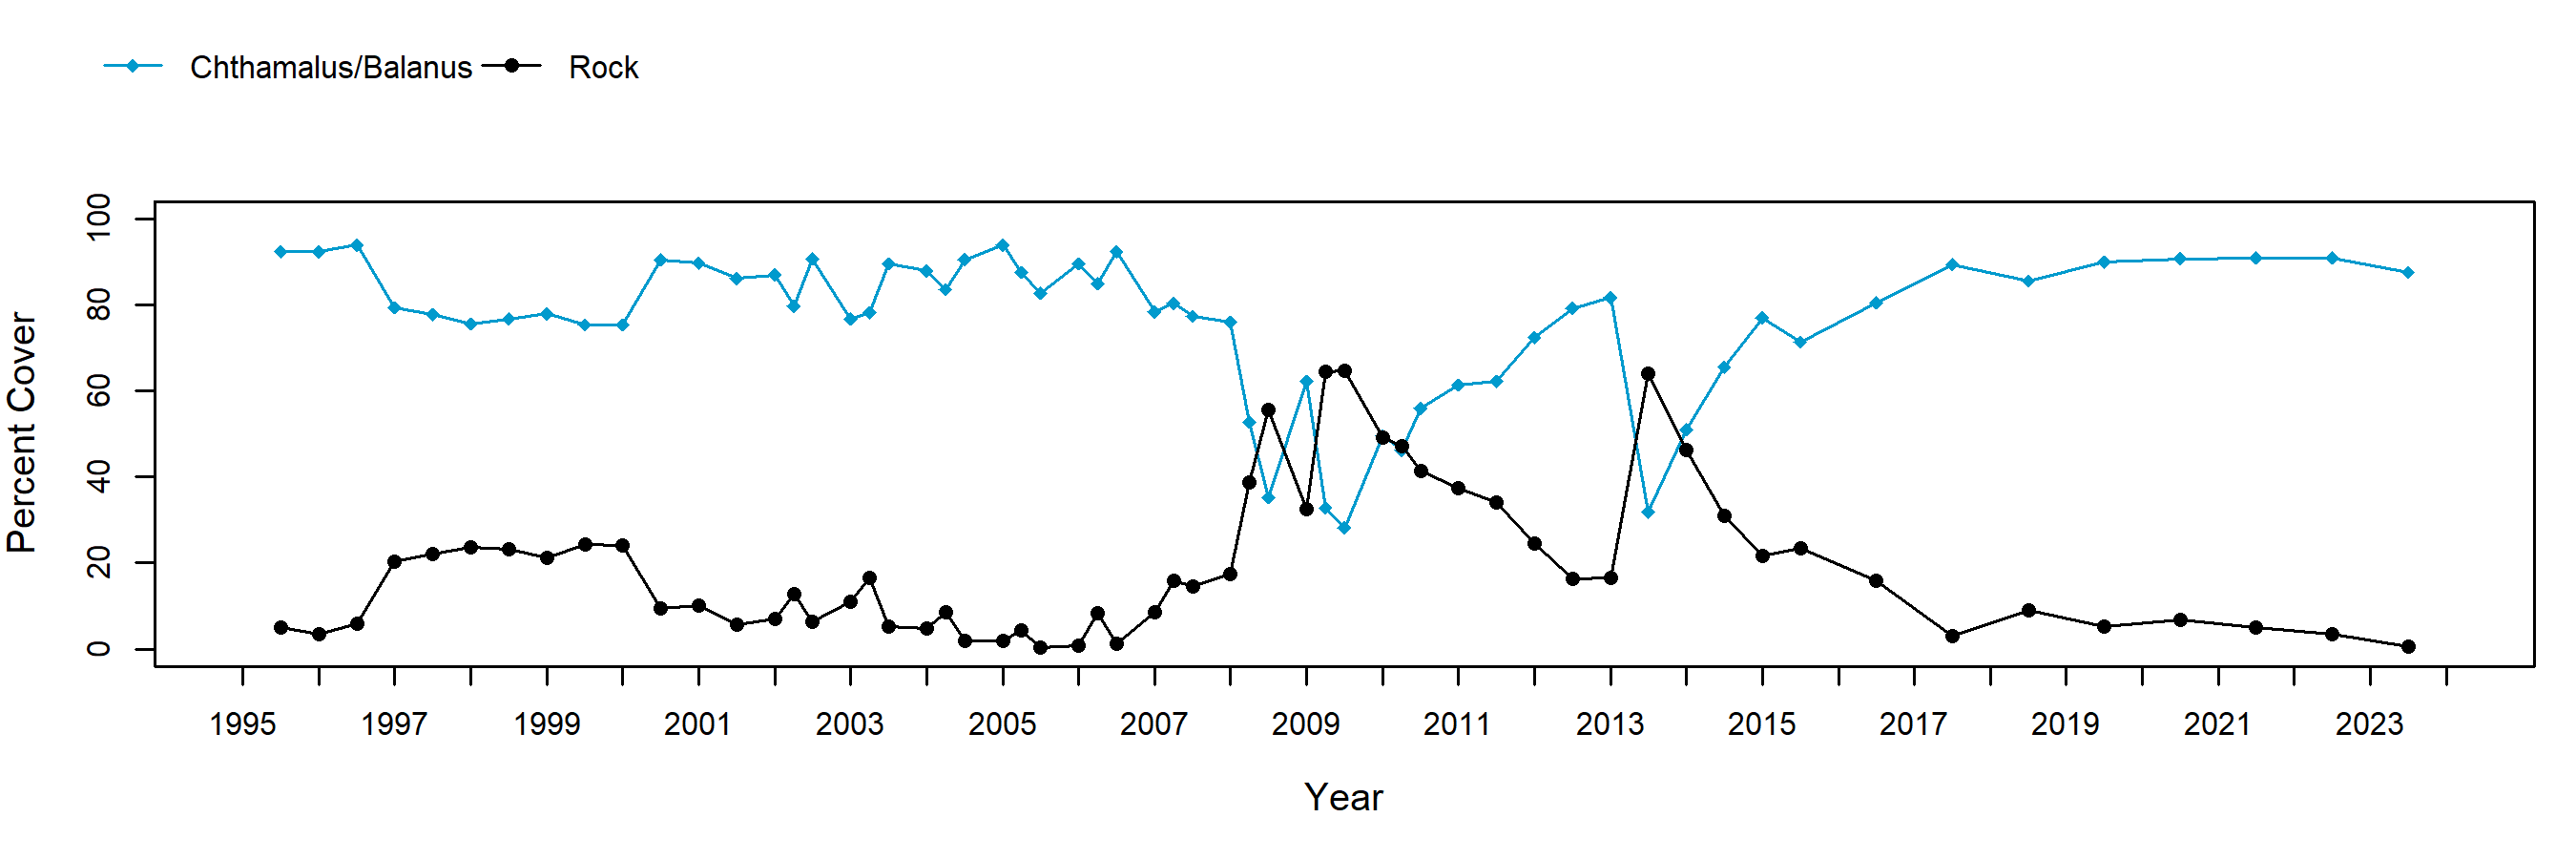
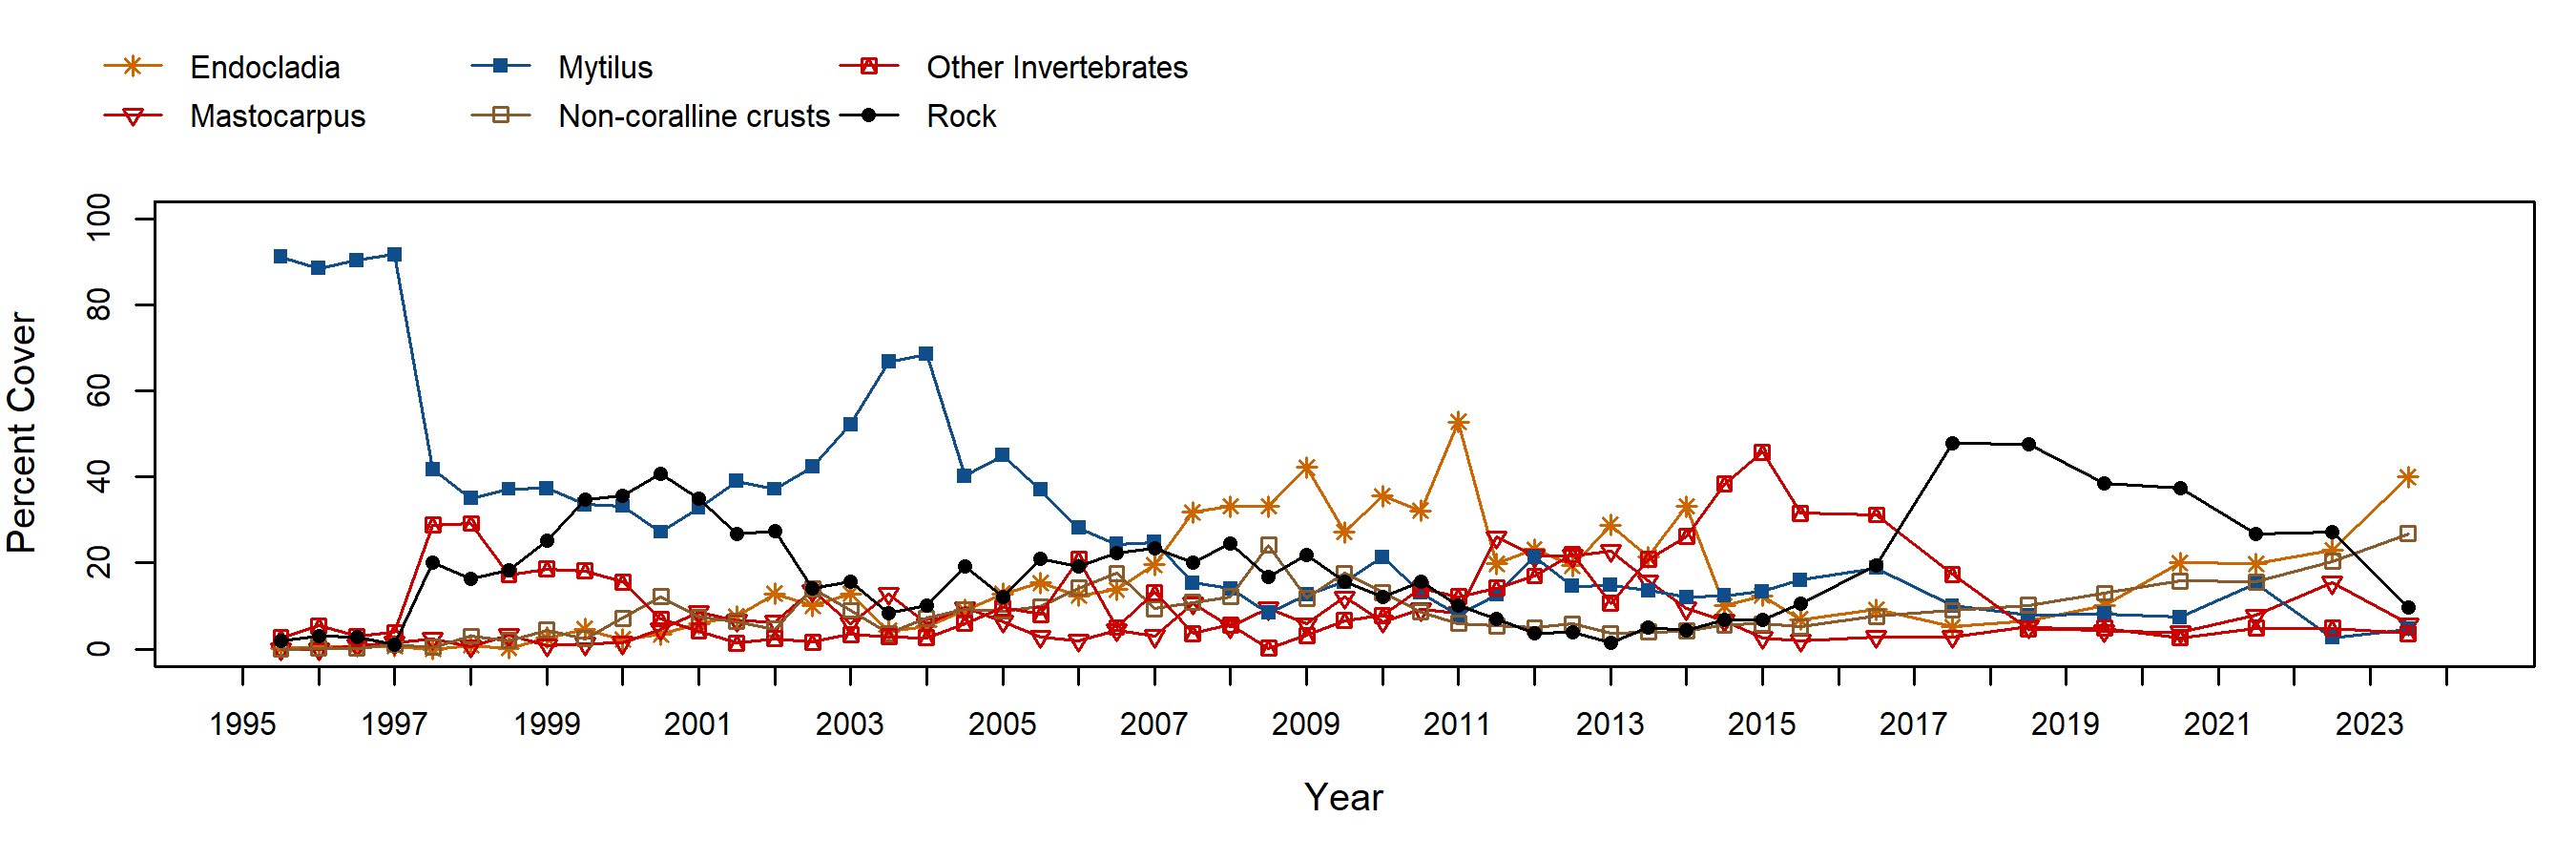
Barnacle cover in its’ target plots was consistently high at Shell Beach until 2008, when a sharp drop occurred. Barnacles recovered between 2009-2013 but then experienced another substantial drop in Fall 2013 due to a possible scouring event. Barnacles have since recovered to near initial levels. Mussel cover at Shell Beach was initially high but then declined during the 1997/98 El Niño event. Mussels experienced a brief recovery in 2003/2004, but then rapidly declined to low levels in subsequent years. Shell Beach is a highly accessible site and thus decline may be due, in part, to trampling and collection for food or bait. The mussel bed at Shell Beach is extremely small and would be highly impacted by even a small level of collecting. Endocladia was common within mussel plots between 2007-2014, but has since declined. Fluctuations in the broad group “other invertebrates” largely consisted of periodic mass settlement events of the tube worm Phragmatopoma, followed by gradual die-offs.
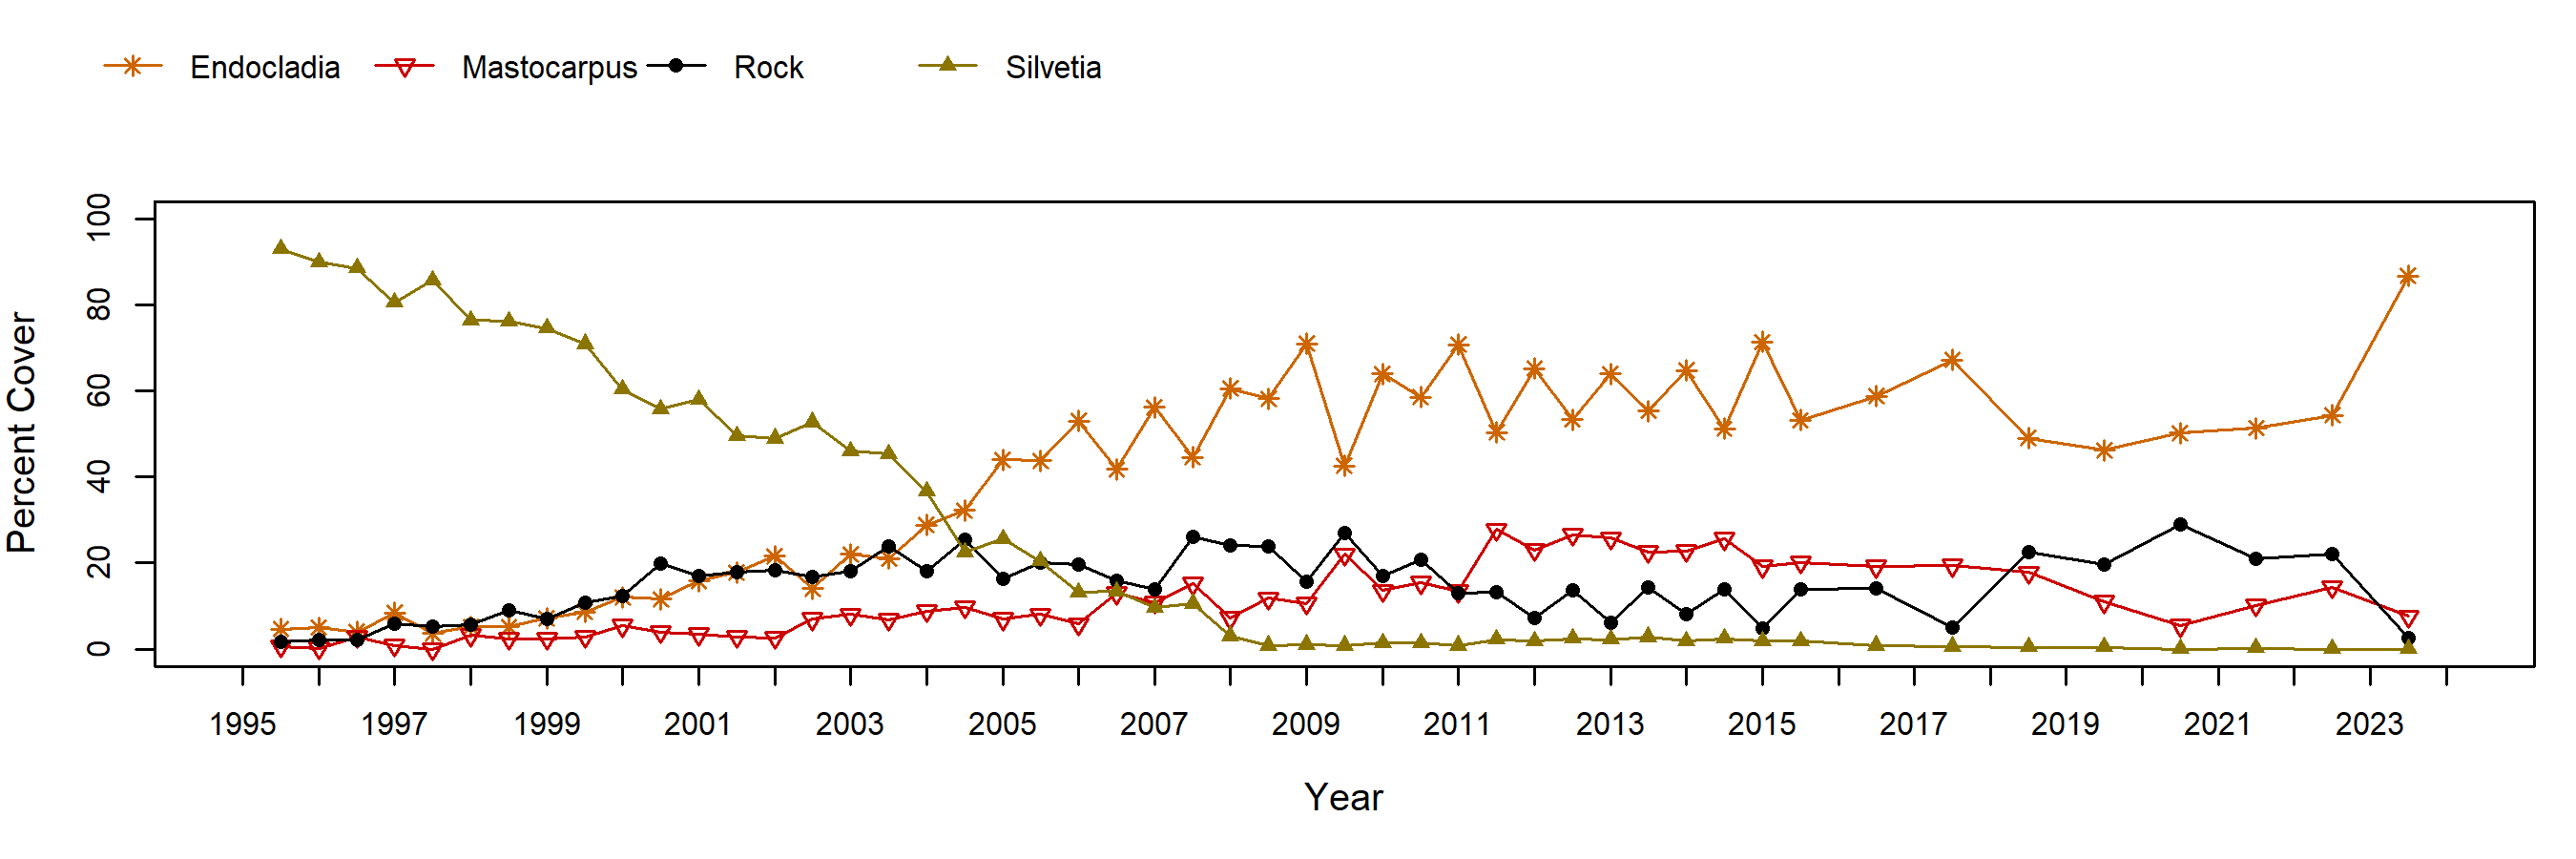
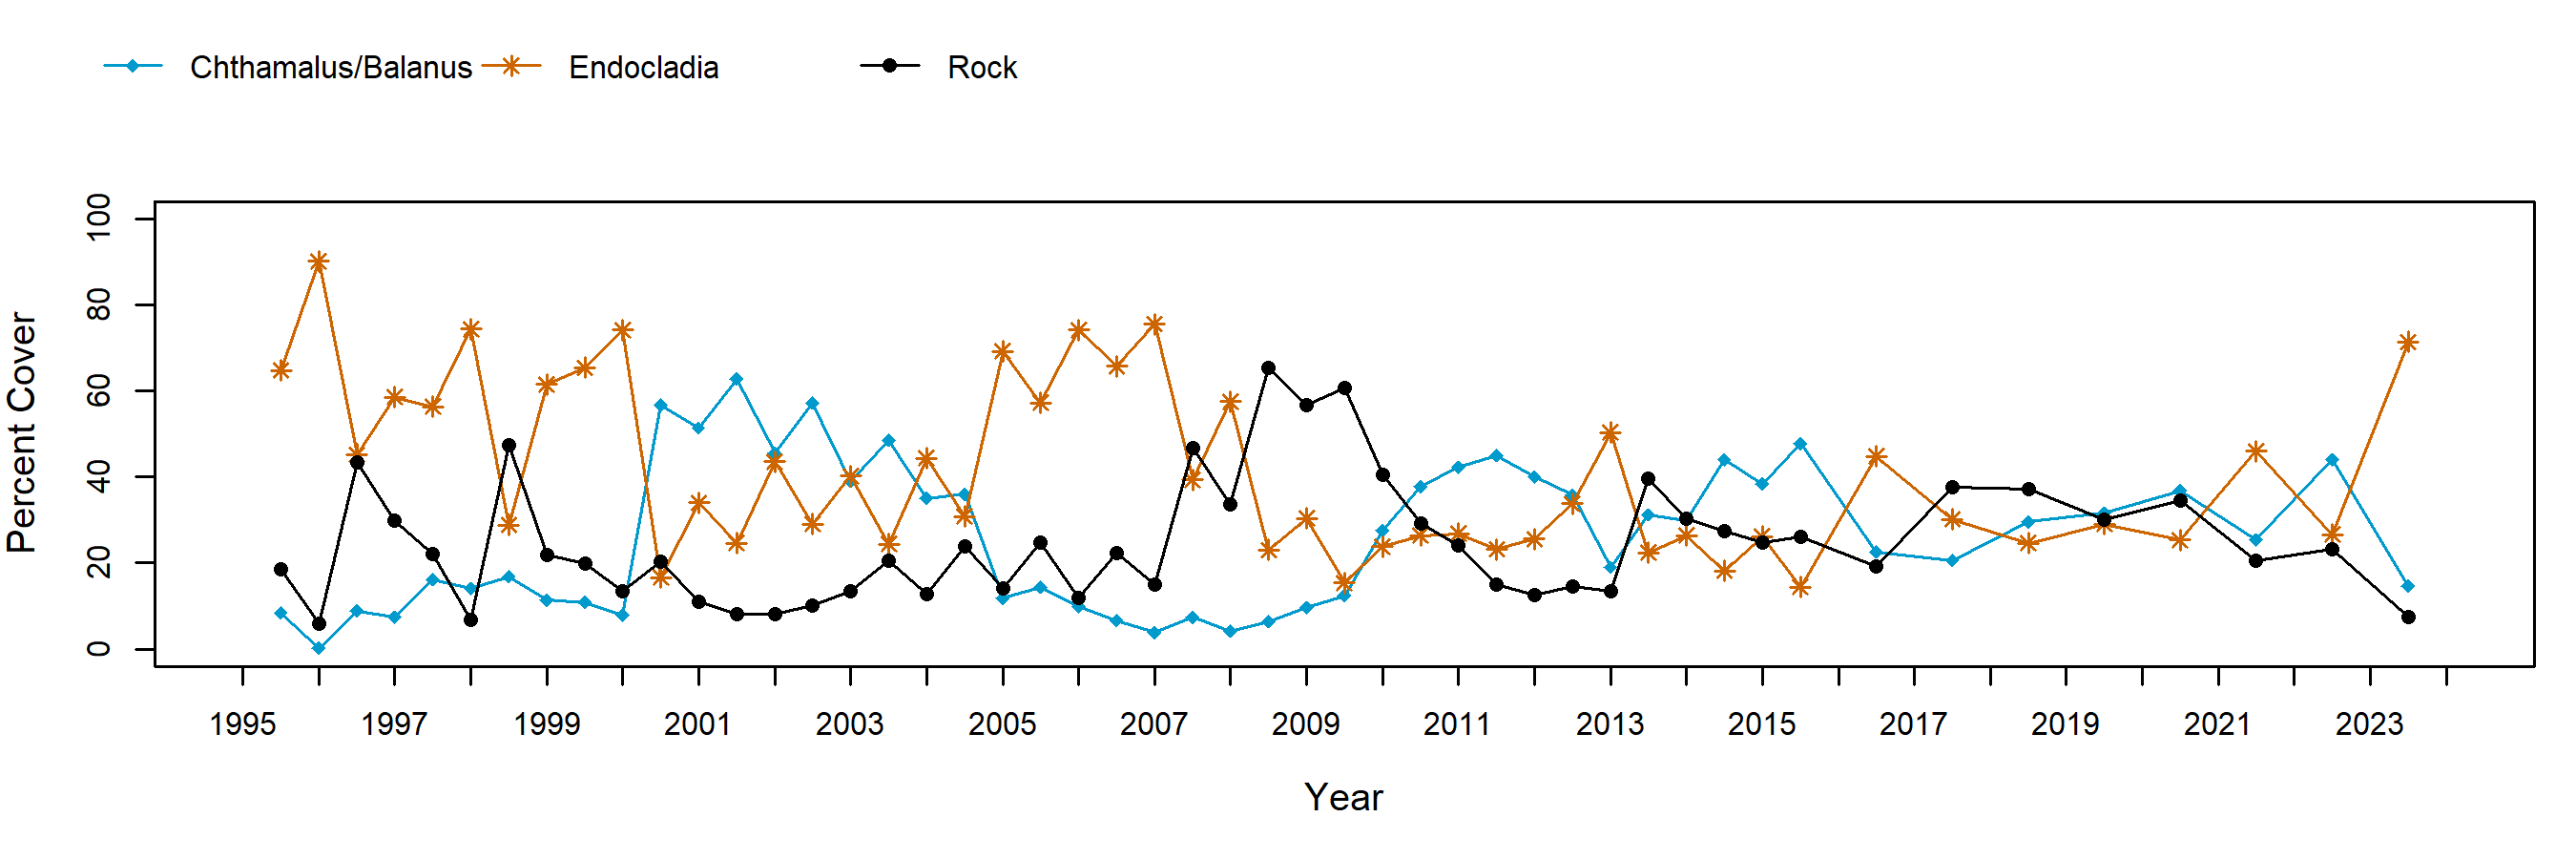
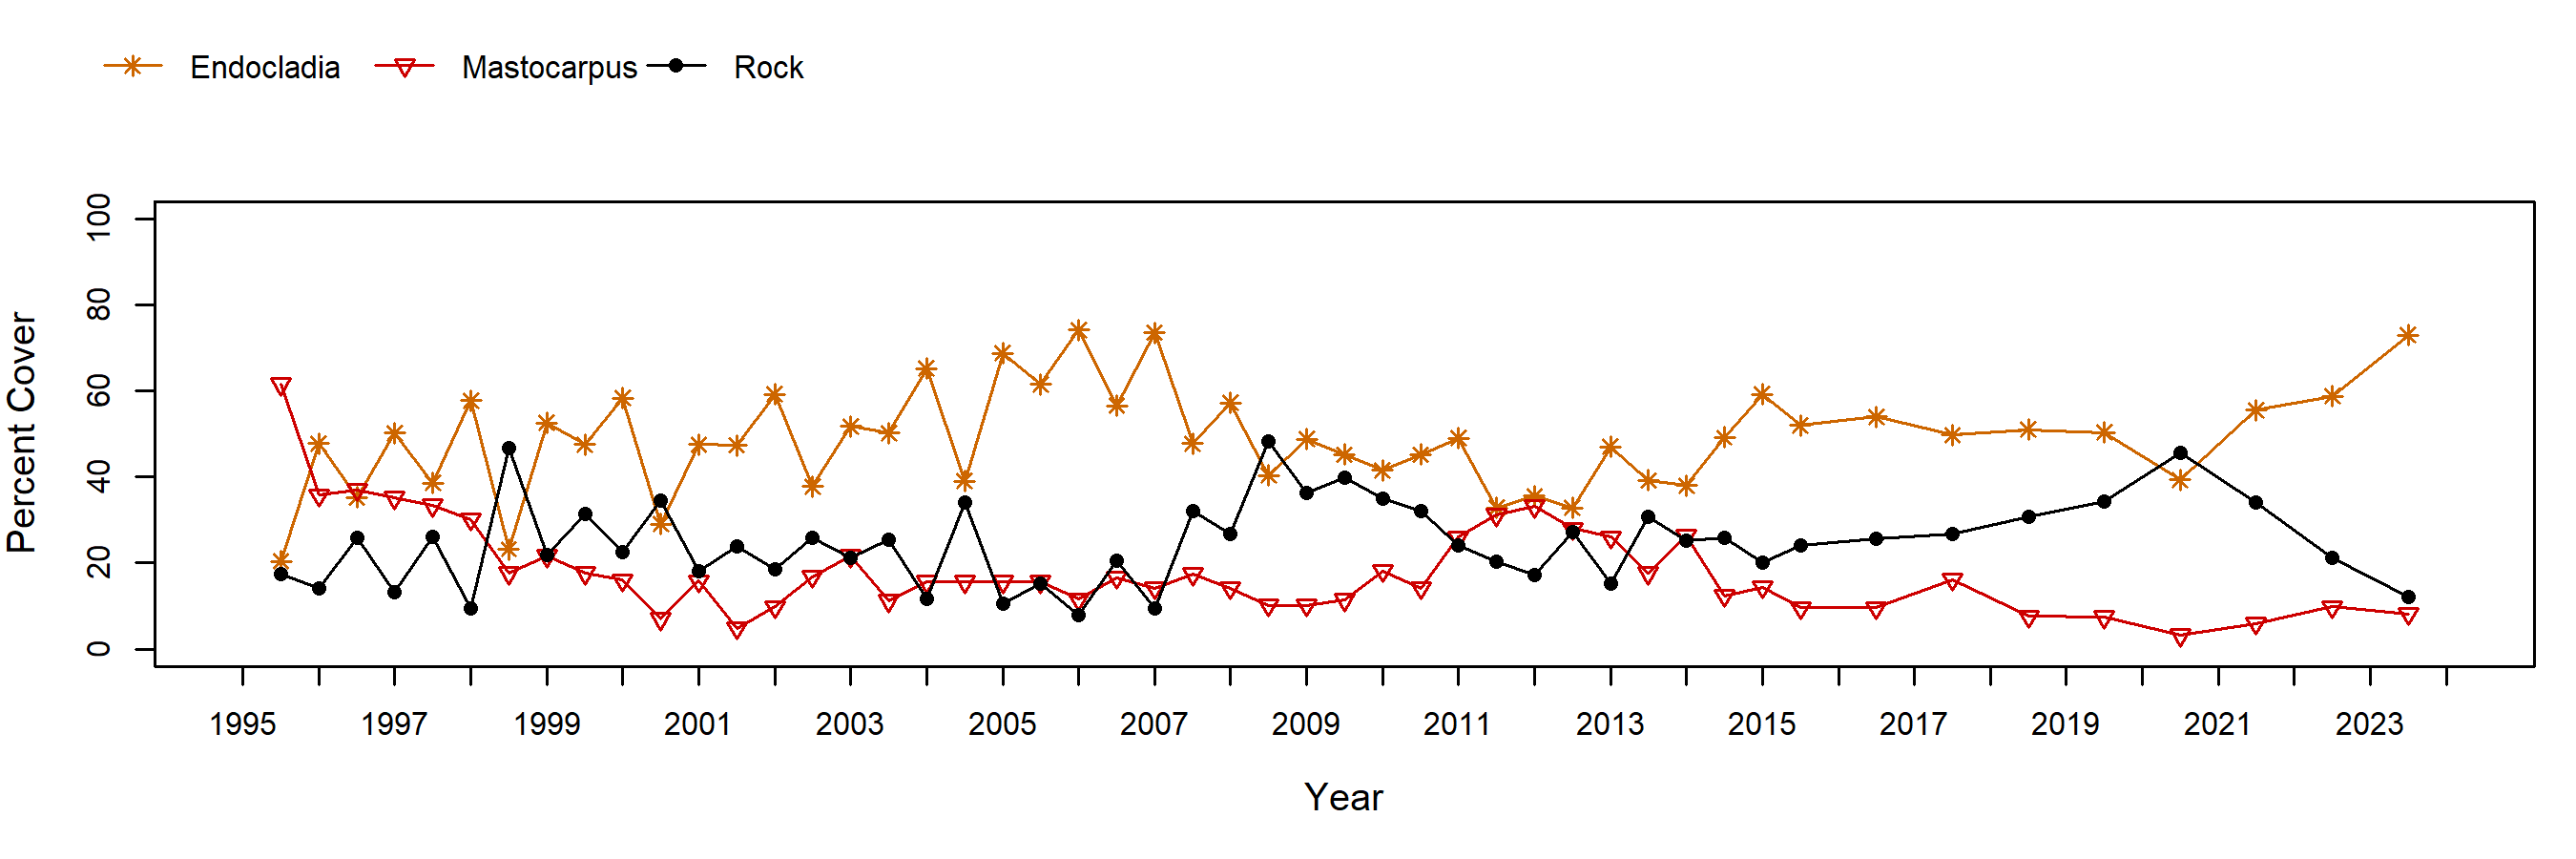
Endocladia dominates the mid-intertidal at Shell Beach. This is evident in the trend plots for Silvetia, where rockweed cover steadily declined over time, and was replaced largely by turf weed. Endocladia was also the most abundant species in Mastocarpus plots. Plots established to target Endocladia are located in the upper-mid intertidal zone, where the turf weed appeared to be near its upper limit, sharing dominance with barnacles.
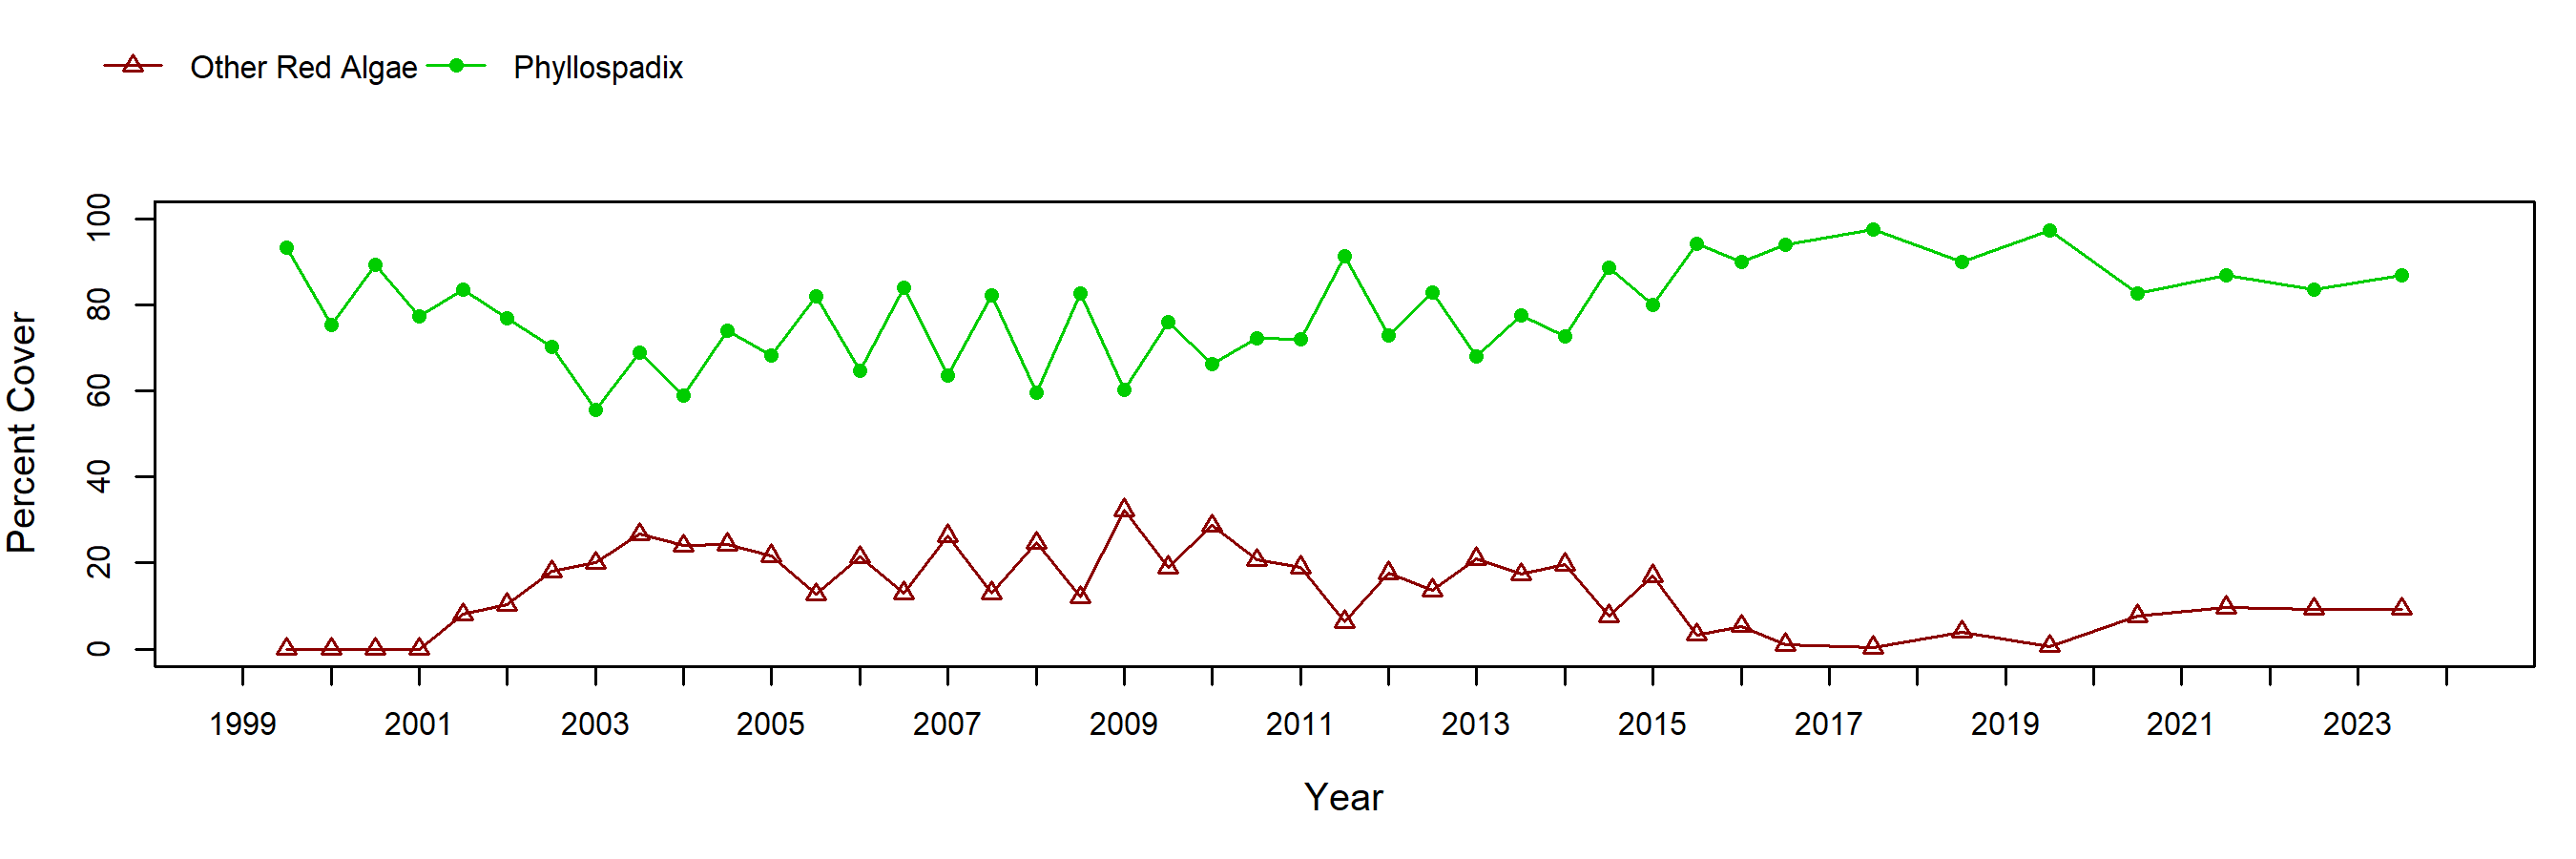
Phyllospadix cover remained relatively high over time at Shell Beach, and exhibited the strong seasonal variation seen at many other sites, with higher cover in fall than in spring. “Other Red Algae” consisted mainly of Chondracanthus canaliculatus and Gastroclonium subarticulatum.
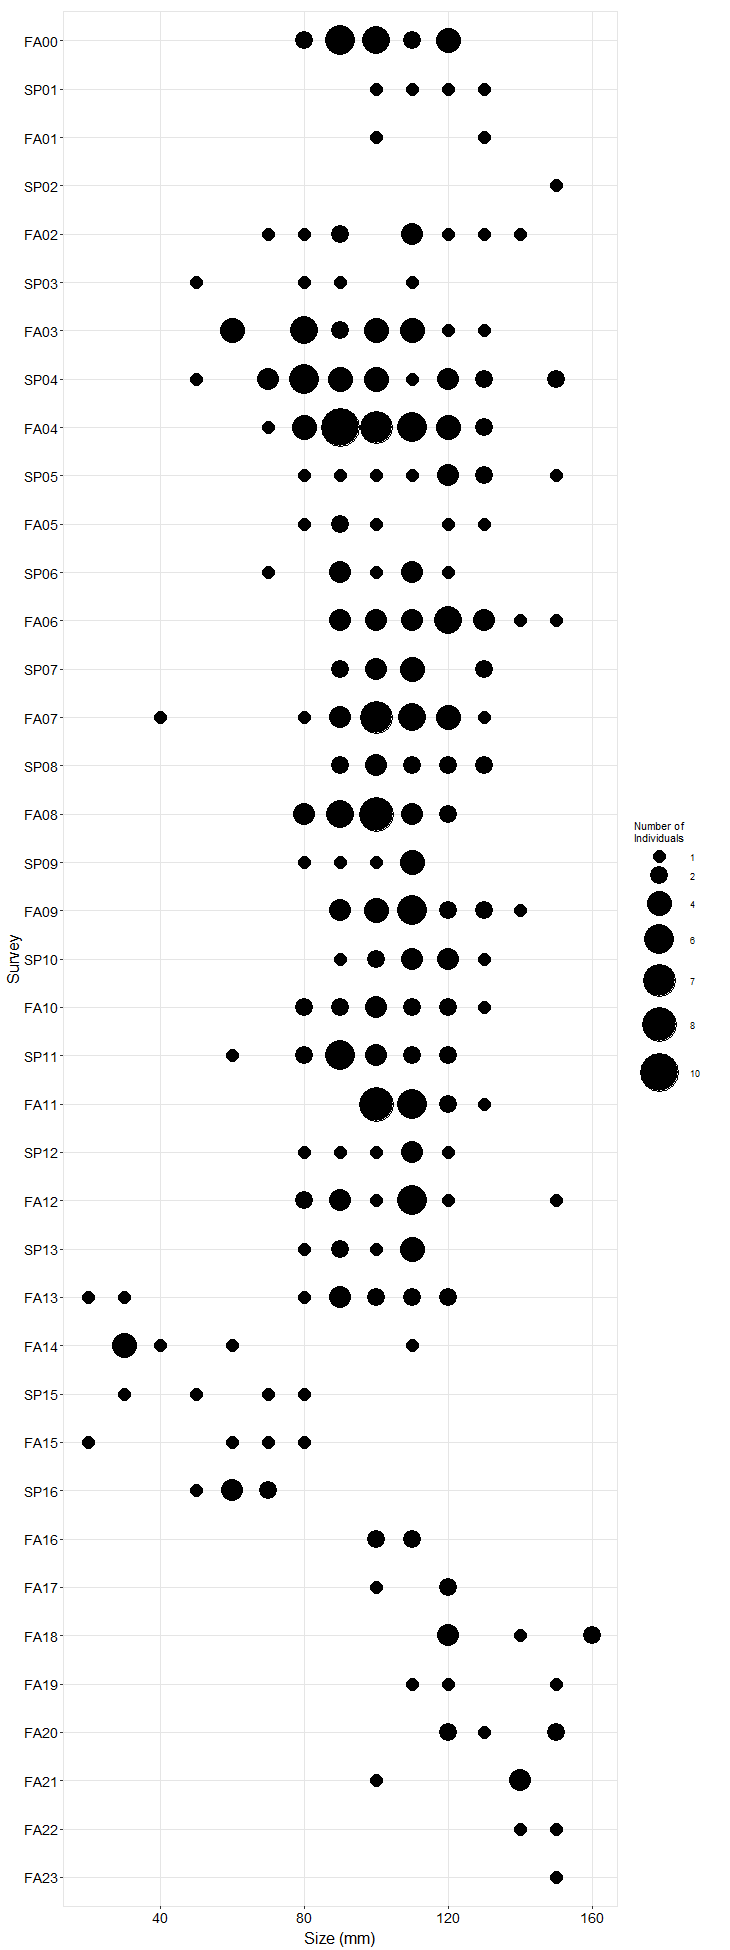
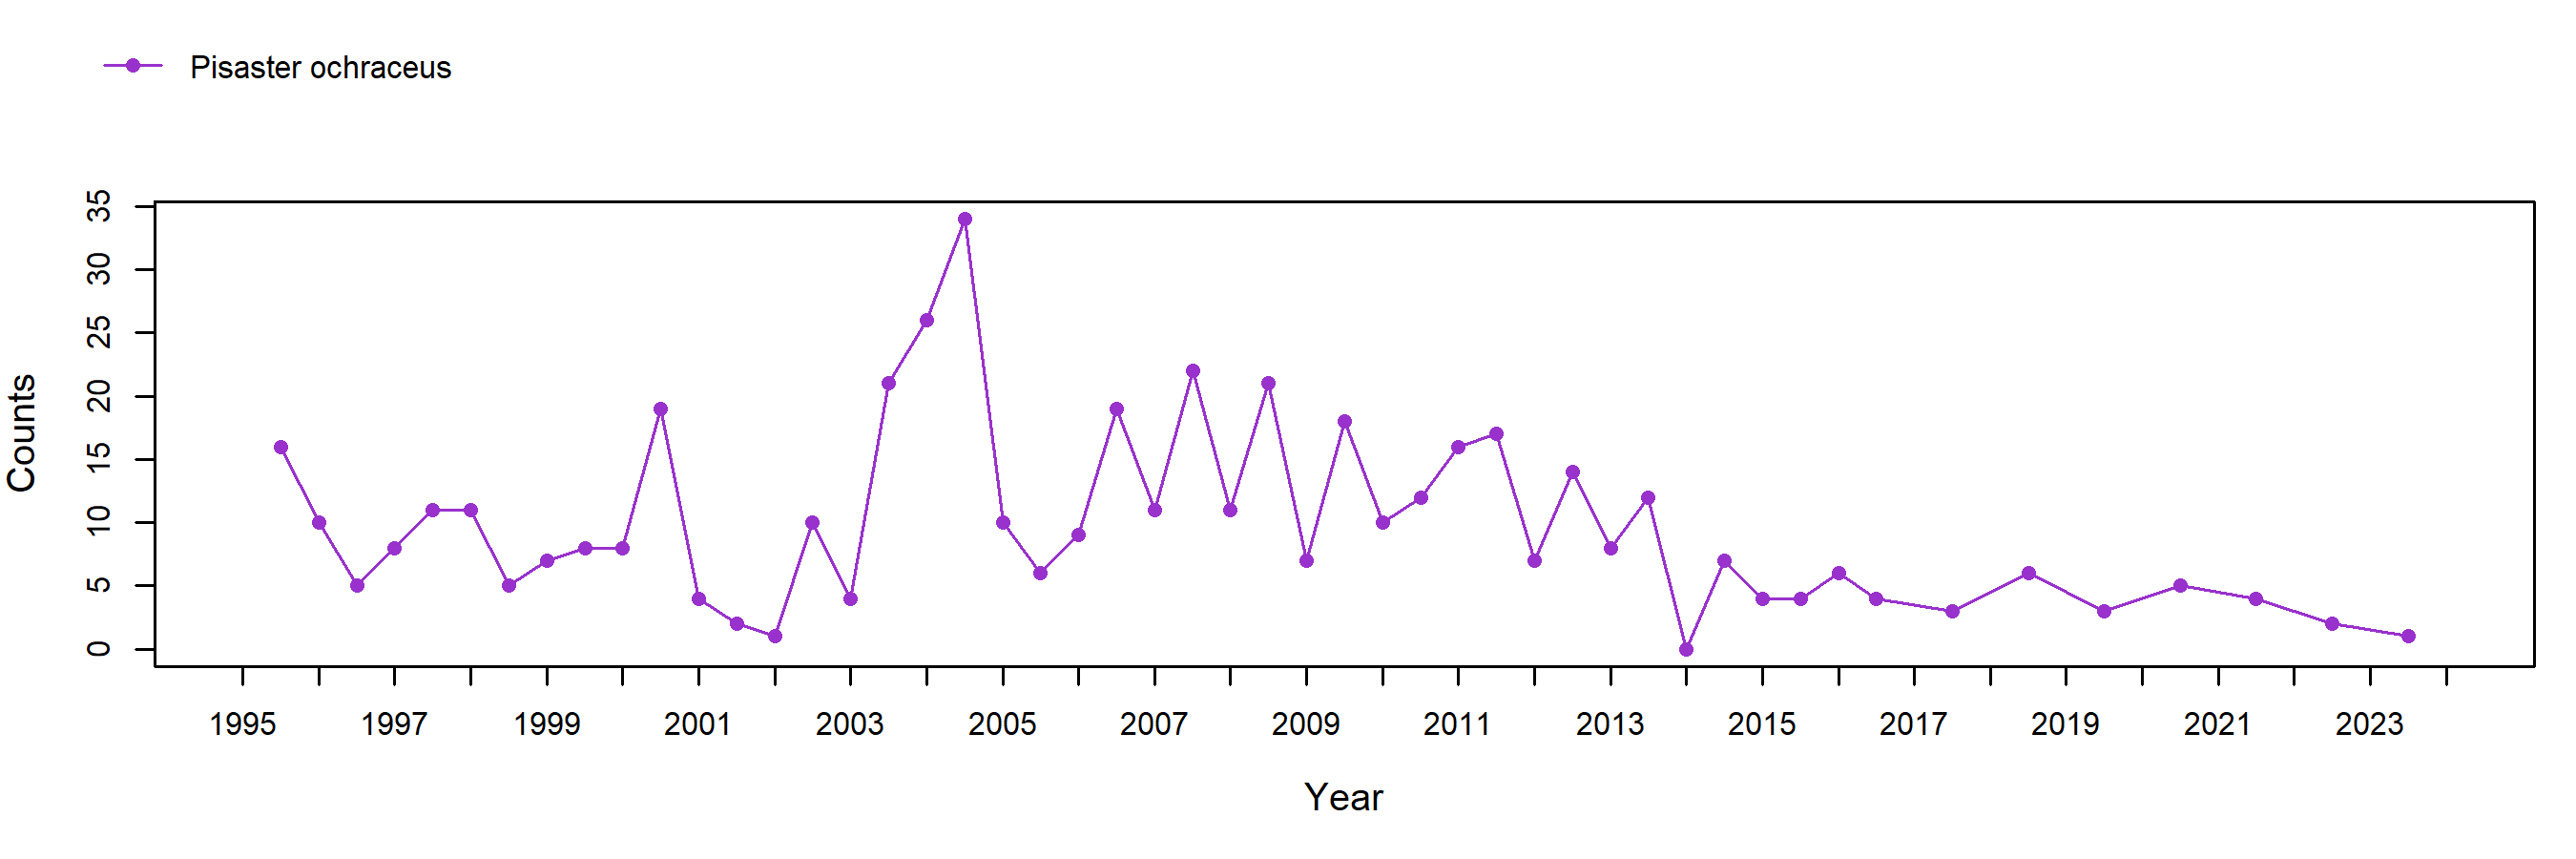
Counts of the sea star, Pisaster ochraceus, were variable over time, but in general not very high when compared to other sites, and sea star wasting syndrome (SSWS) resulted in the near-disappearance of stars at Shell Beach in spring 2014. While a handful of small stars (<40mm) were observed between 2013-2016, only large individuals have been observed in recent years, indicating a lack of recruitment. As discussed above, the mussel bed at Shell Beach is small and not very dense; thus, the low number of sea stars at this site is likely due to a combination of sea star wasting and low food availability.
In order to standardize species resolution across all MARINe groups and over time, some species (typically rare) were lumped for graphical presentation of Long-Term monitoring data. See lumped categories for definitions (some variation occurs between methods and over time).
If you experience any barriers accessing the trend graphs below, please contact (pacificr@ucsc.edu) for help.
Photo Plots

Below are the trends observed for each Photo Plot target species at this site. Long-Term percent cover trend graphs also include any species that reached a minimum of 25% cover during any single point in time within a given target species assemblage. Breaks in trend lines represent missed sampling events. For additional species observed that did not meet this 25% threshold, please use the Graphing Tool.
Chthamalus/Balanus (Acorn Barnacles) – percent cover
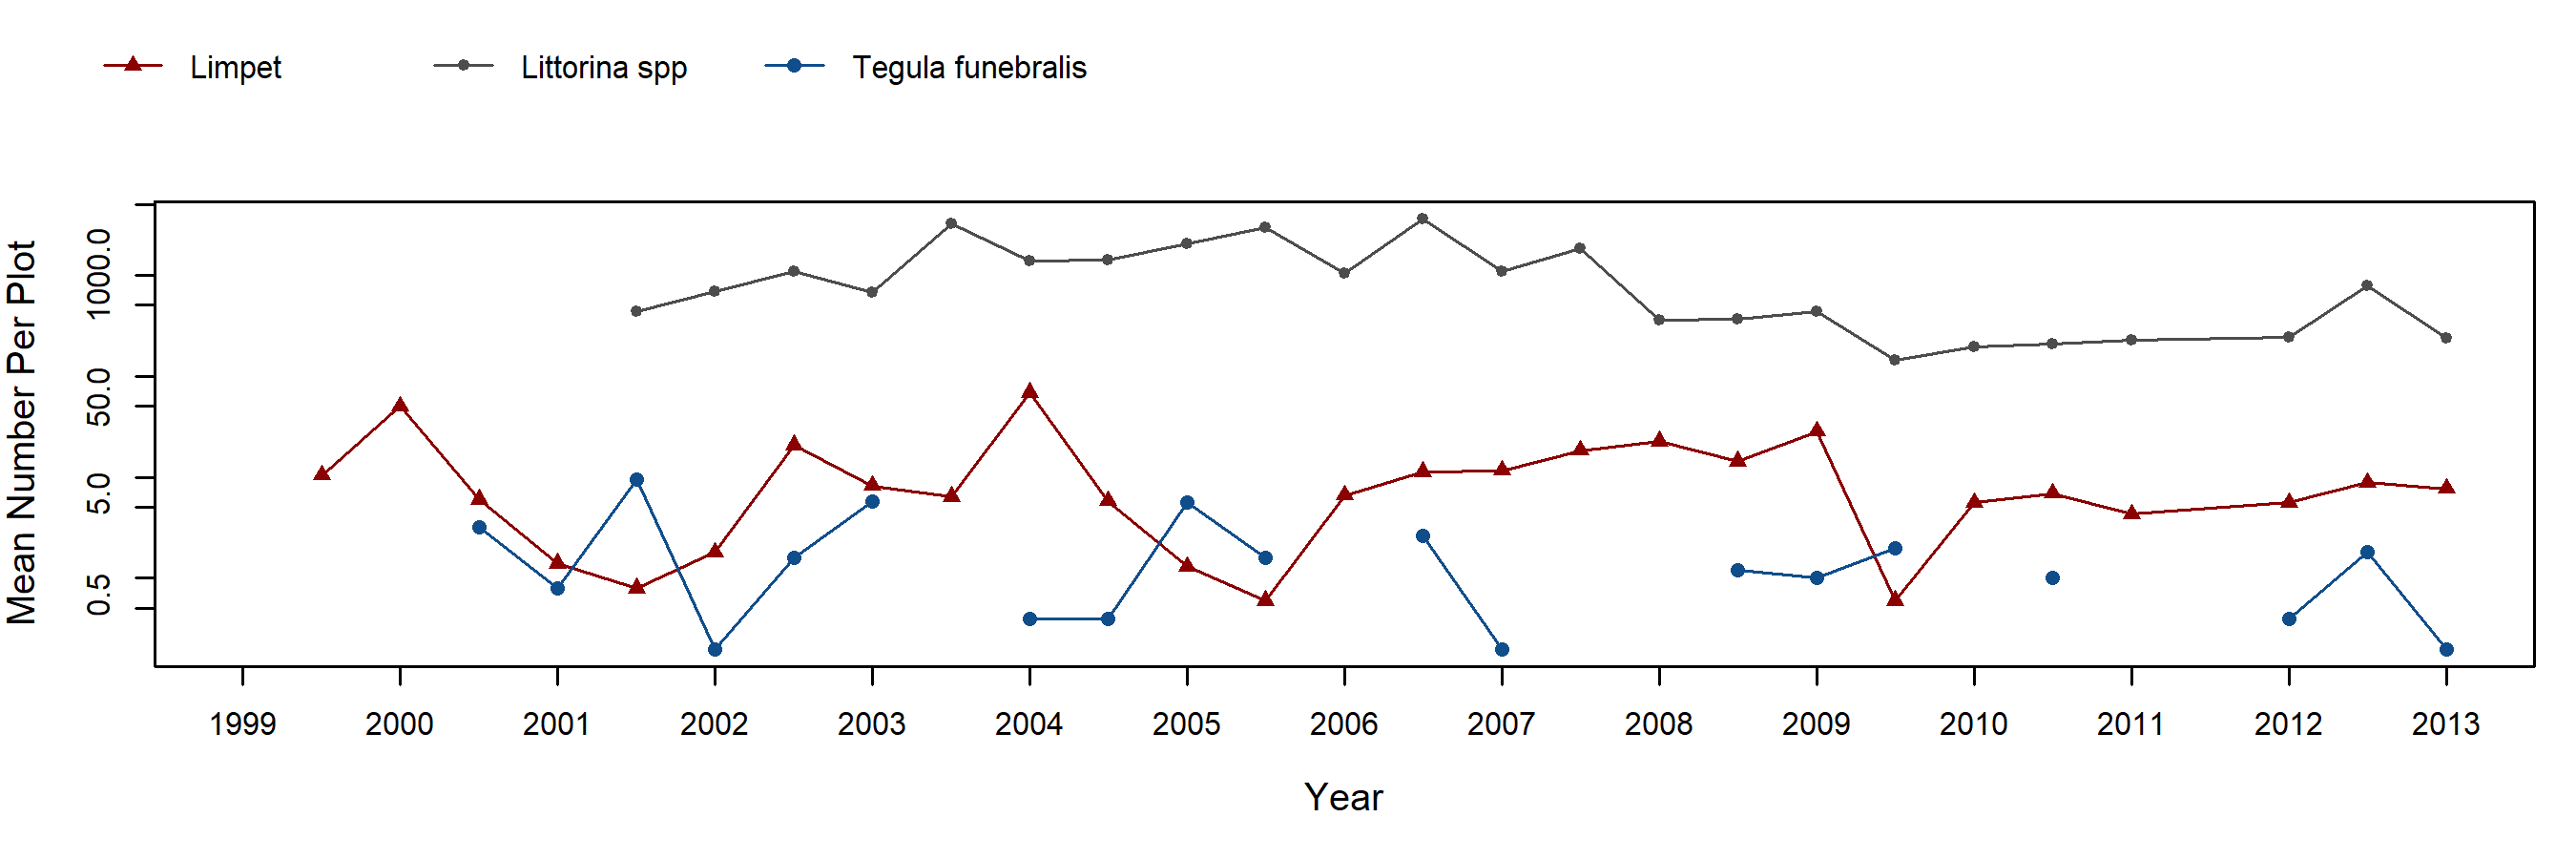
Chthamalus/Balanus (Acorn Barnacles) – motile invertebrate counts
Mytilus (California Mussel) – percent cover
Mytilus (California Mussel) – motile invertebrate counts
Silvetia (Golden Rockweed) – percent cover
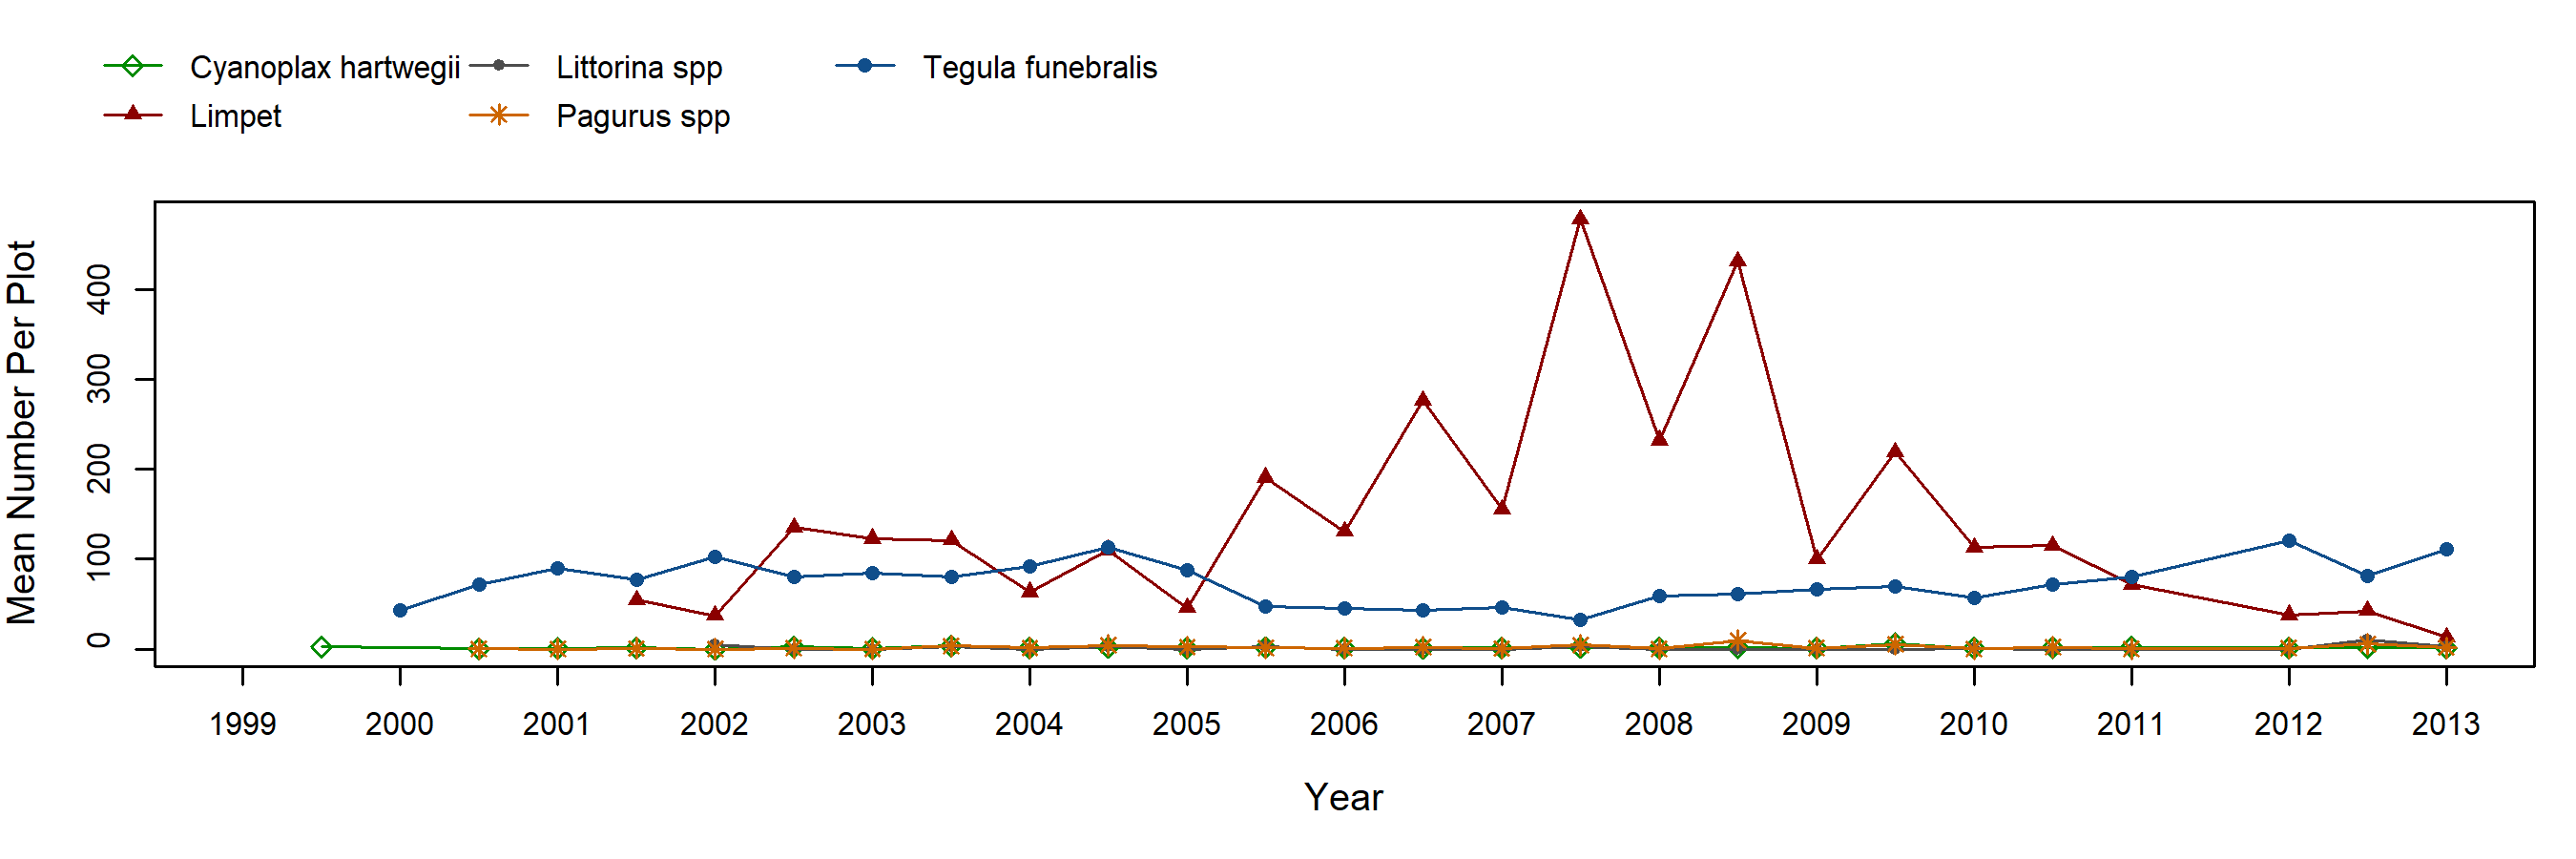
Silvetia (Golden Rockweed) – motile invertebrate counts
Endocladia (Turfweed) – percent cover
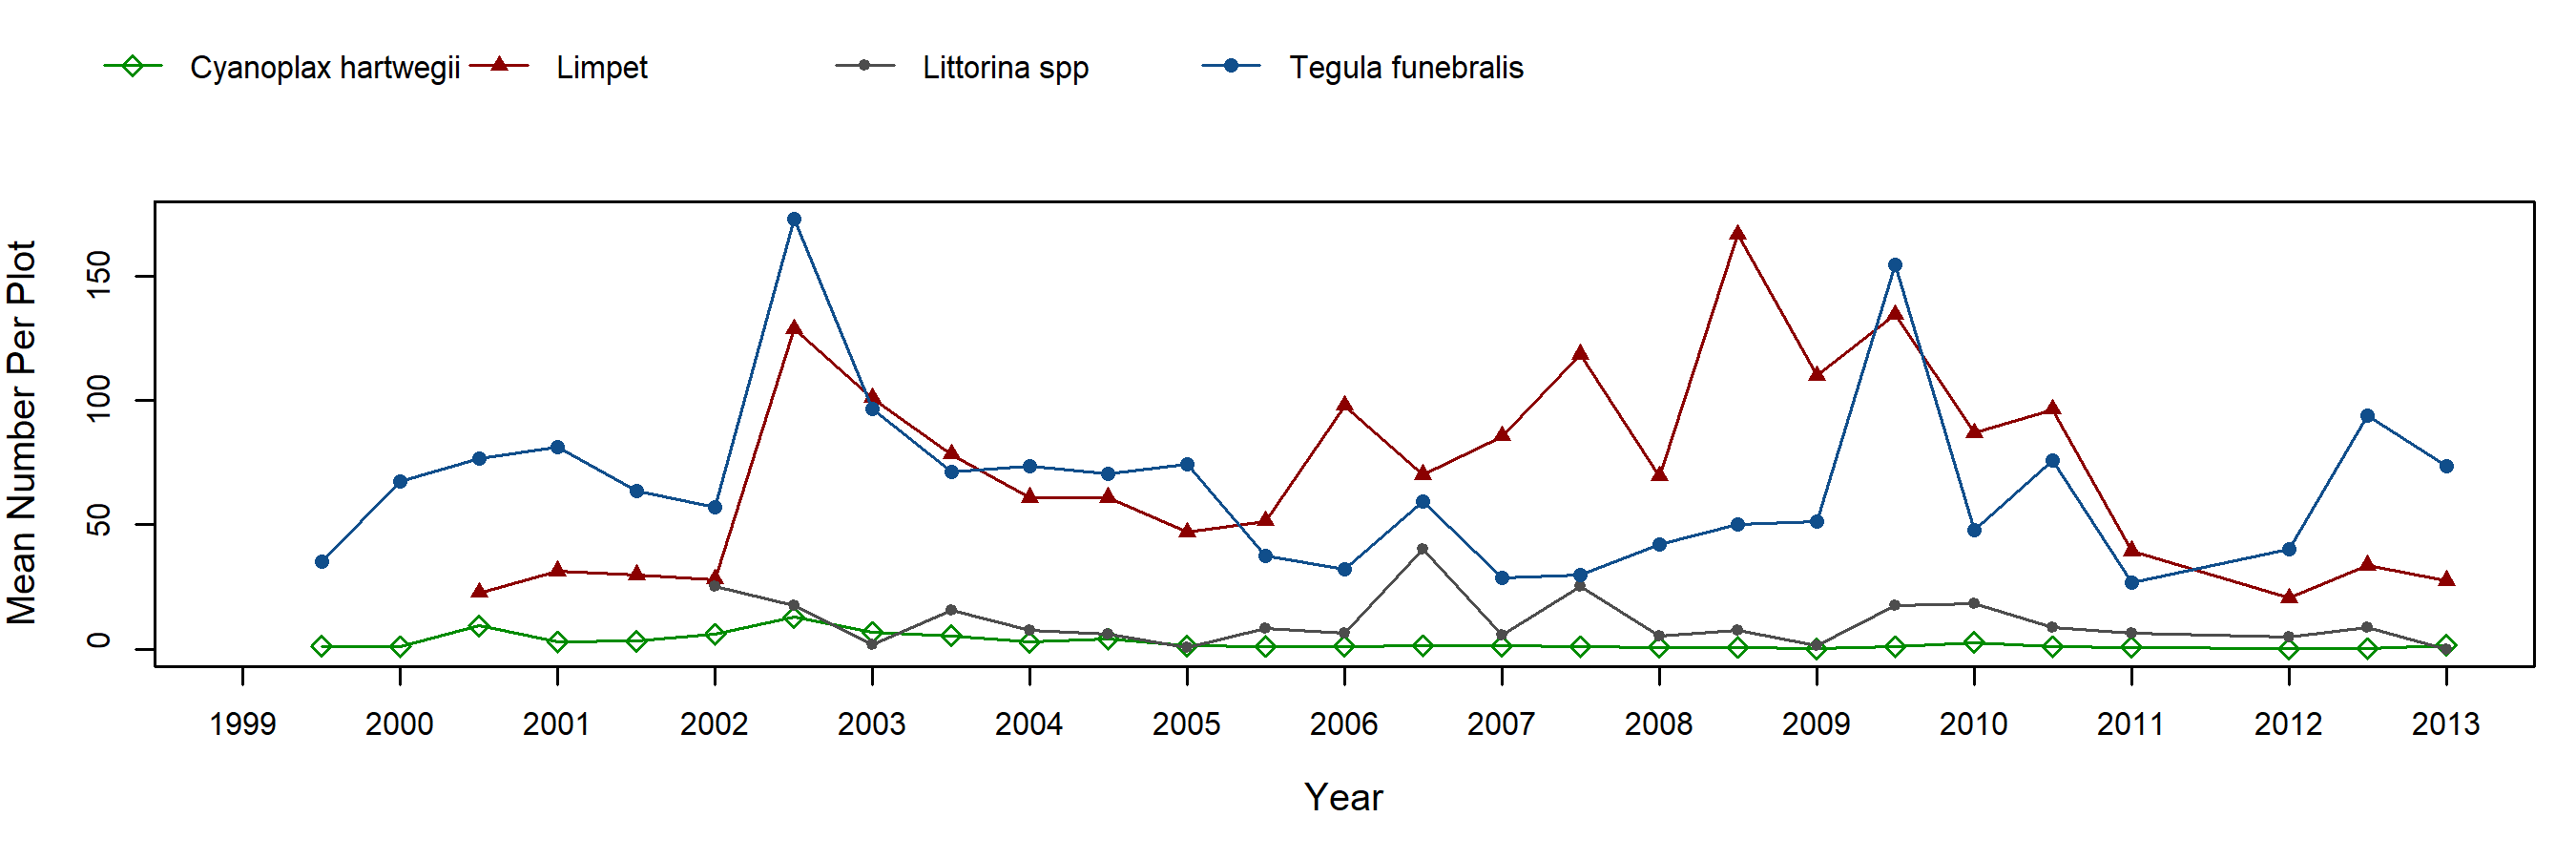
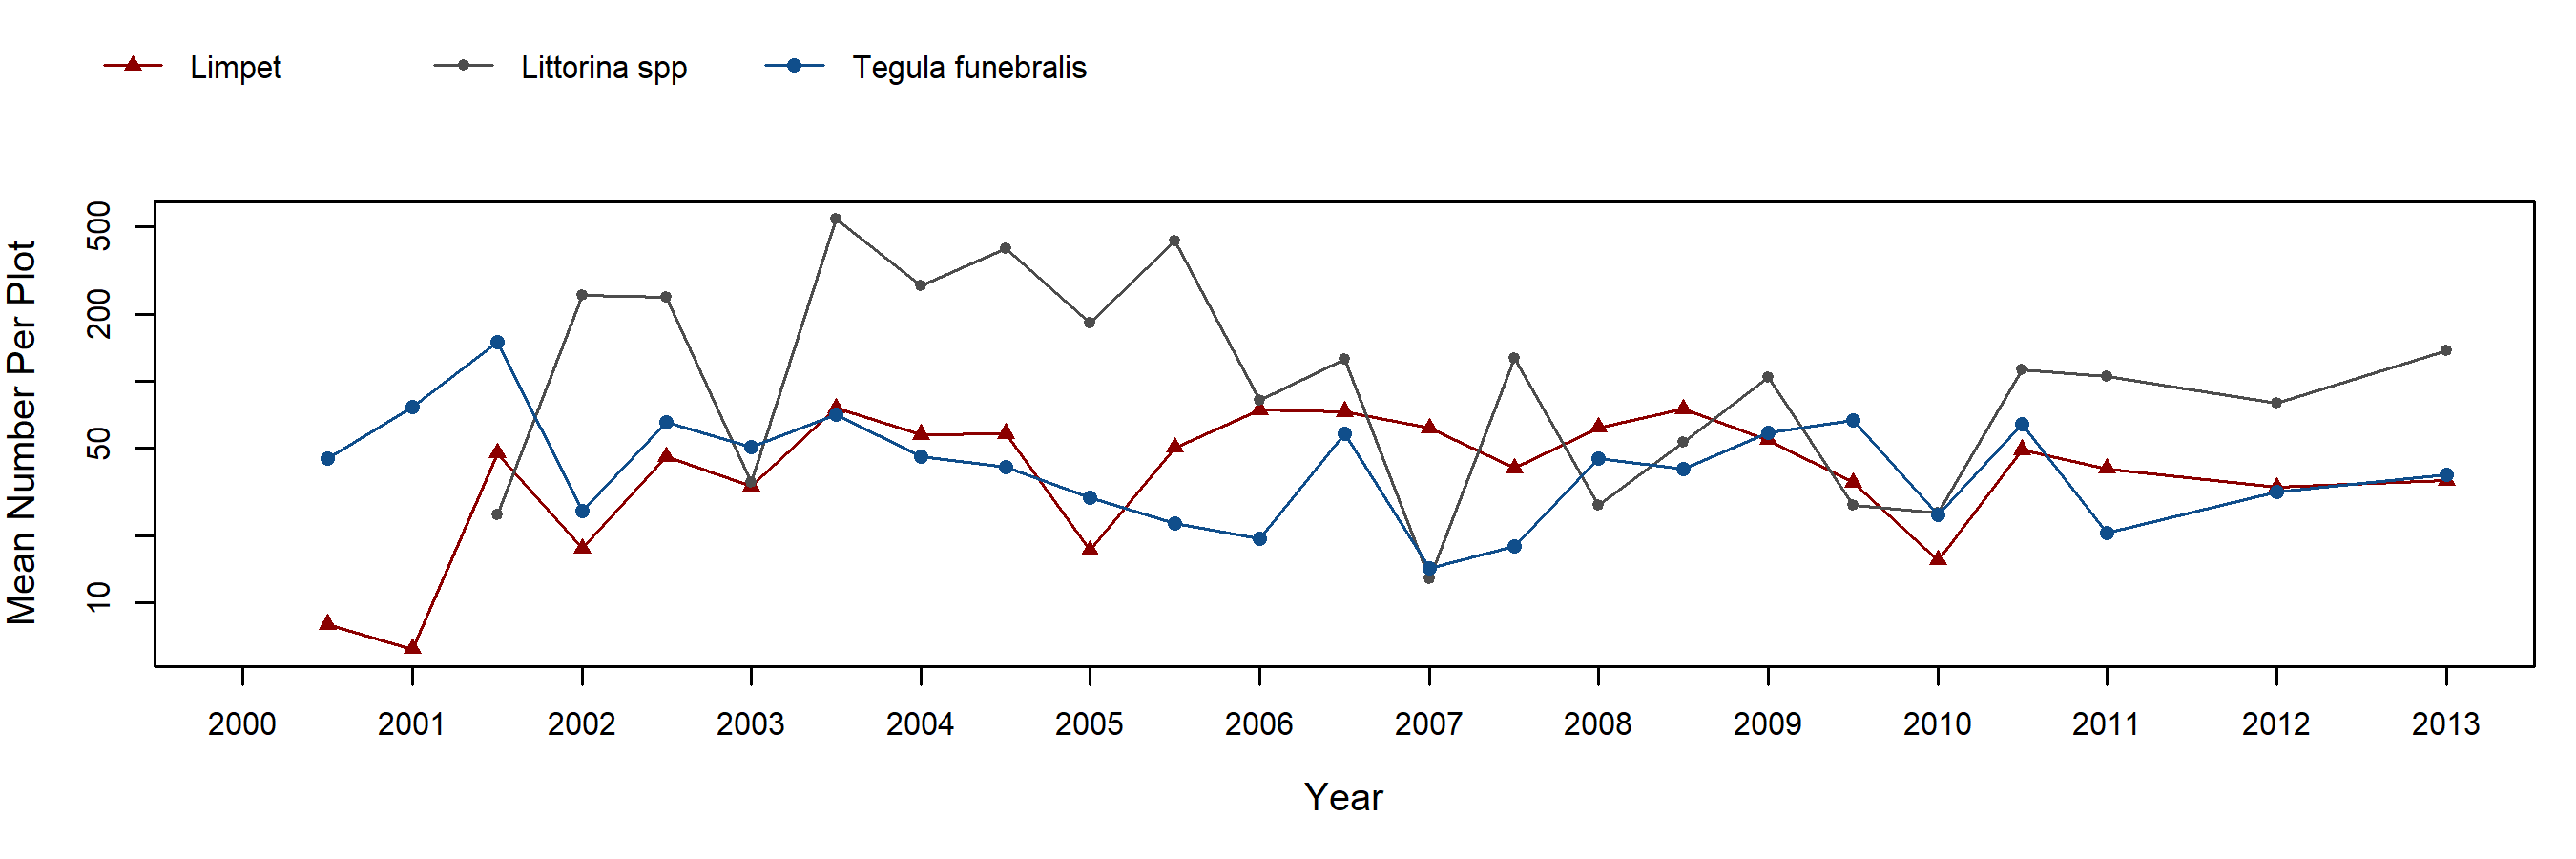
Endocladia (Turfweed) – motile invertebrate counts
Mastocarpus (Turkish Washcloth) – percent cover
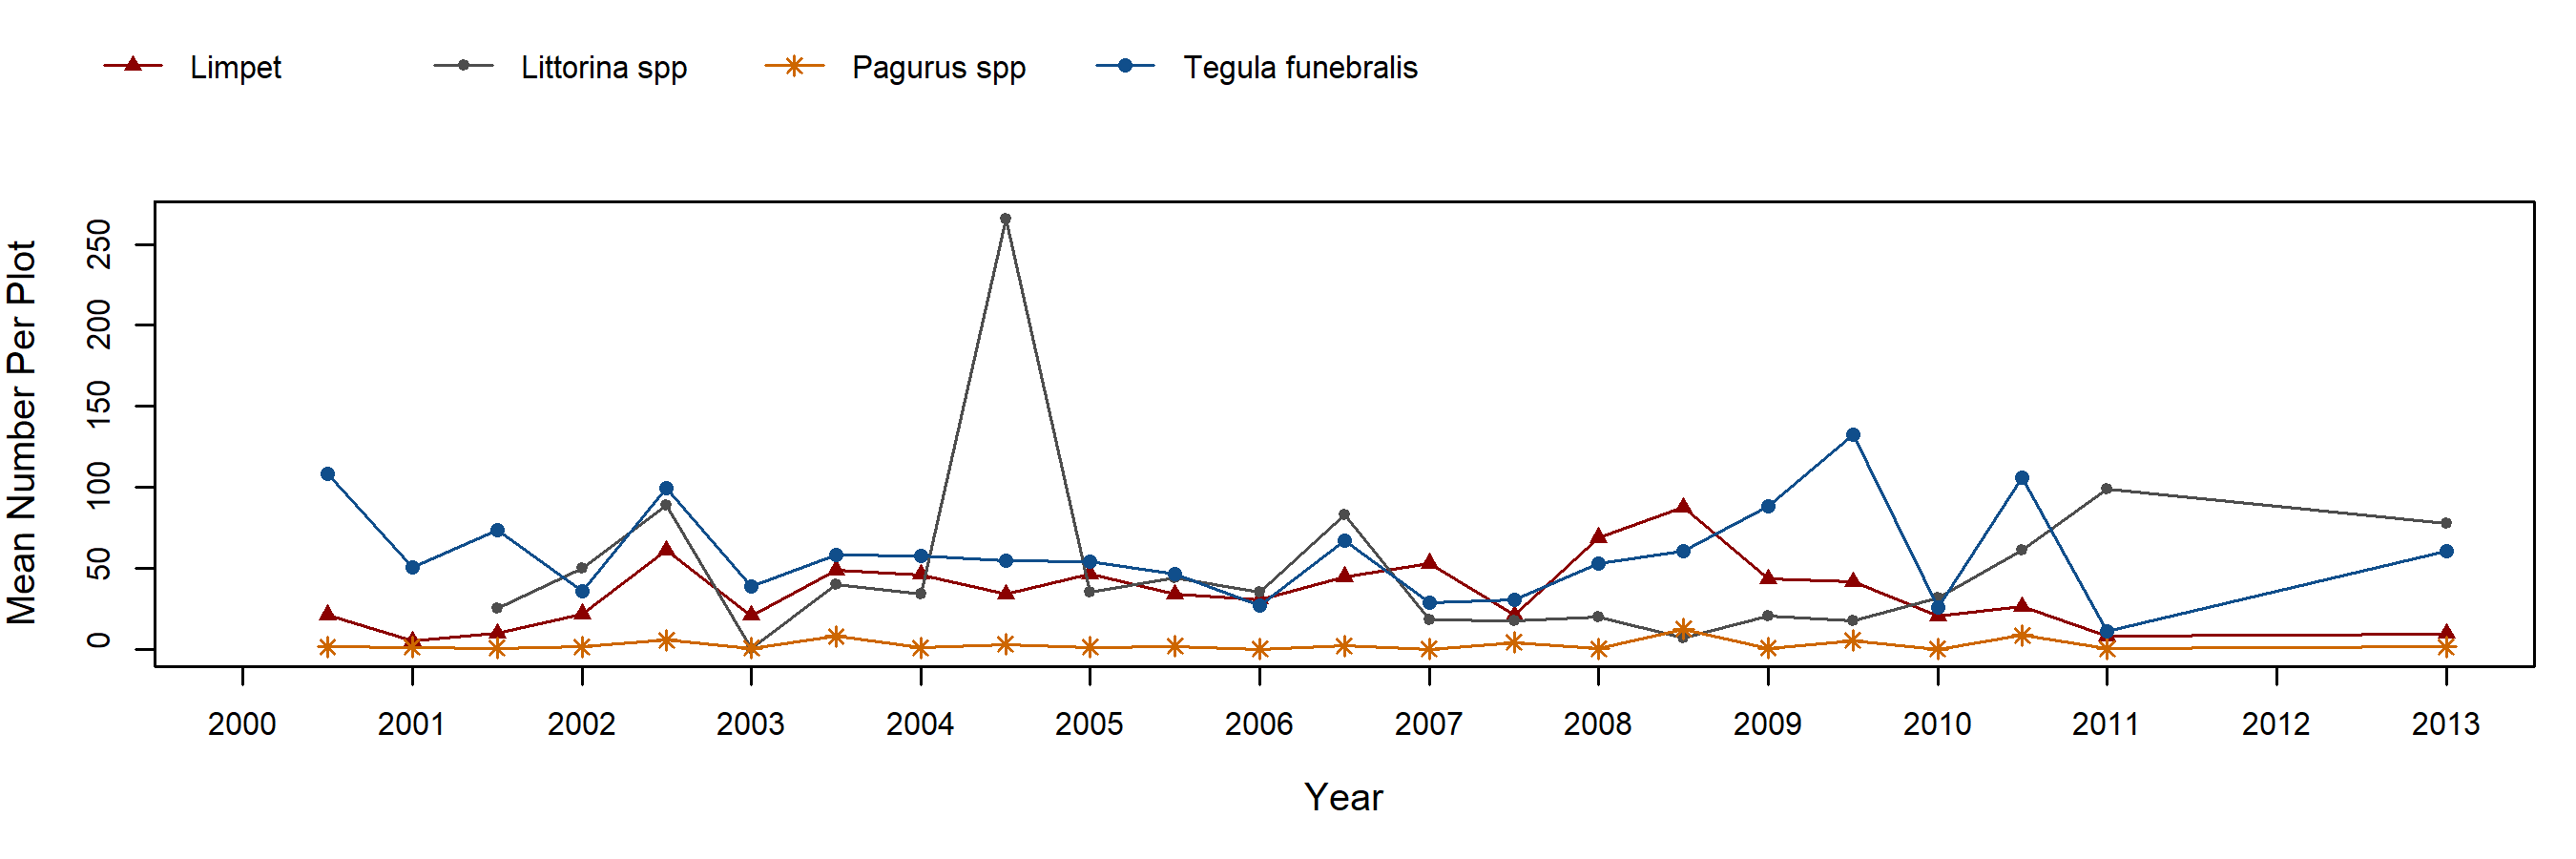
Mastocarpus (Turkish Washcloth) – motile invertebrate counts
Transects

Below are the trends observed for each Transect target species at this site. Long-Term trend graphs also include any species that reached a minimum of 25% cover during any single point in time within a given target species assemblage. Breaks in trend lines represent missed sampling events.
Phyllospadix (Surfgrass)
Species Counts and Sizes

Species Counts and Sizes (where recorded) for Pisaster are shown below for this site. At some sites, other sea star species and Katharina are counted in addition to Pisaster. The sum of all individuals across all plots is displayed. Note that data gaps are represented by breaks in long-term count trend lines, but are not shown in size plots.
Pisaster ochraceus (Ochre Star) – counts
Pisaster ochraceus (Ochre Star) – sizes