White Point Long-Term trends | MARINe
White Point Long-Term trends
See below for trend graphs
In order to standardize species resolution across all MARINe groups, and over time, some species (typically rare) were lumped for graphical presentation of Long-Term monitoring data. See lumped categories for definitions (some variation occurs between methods and over time). Due to funding constraints, semi-annual sampling of plots/transects was reduced to annual sampling beginning in 2016.
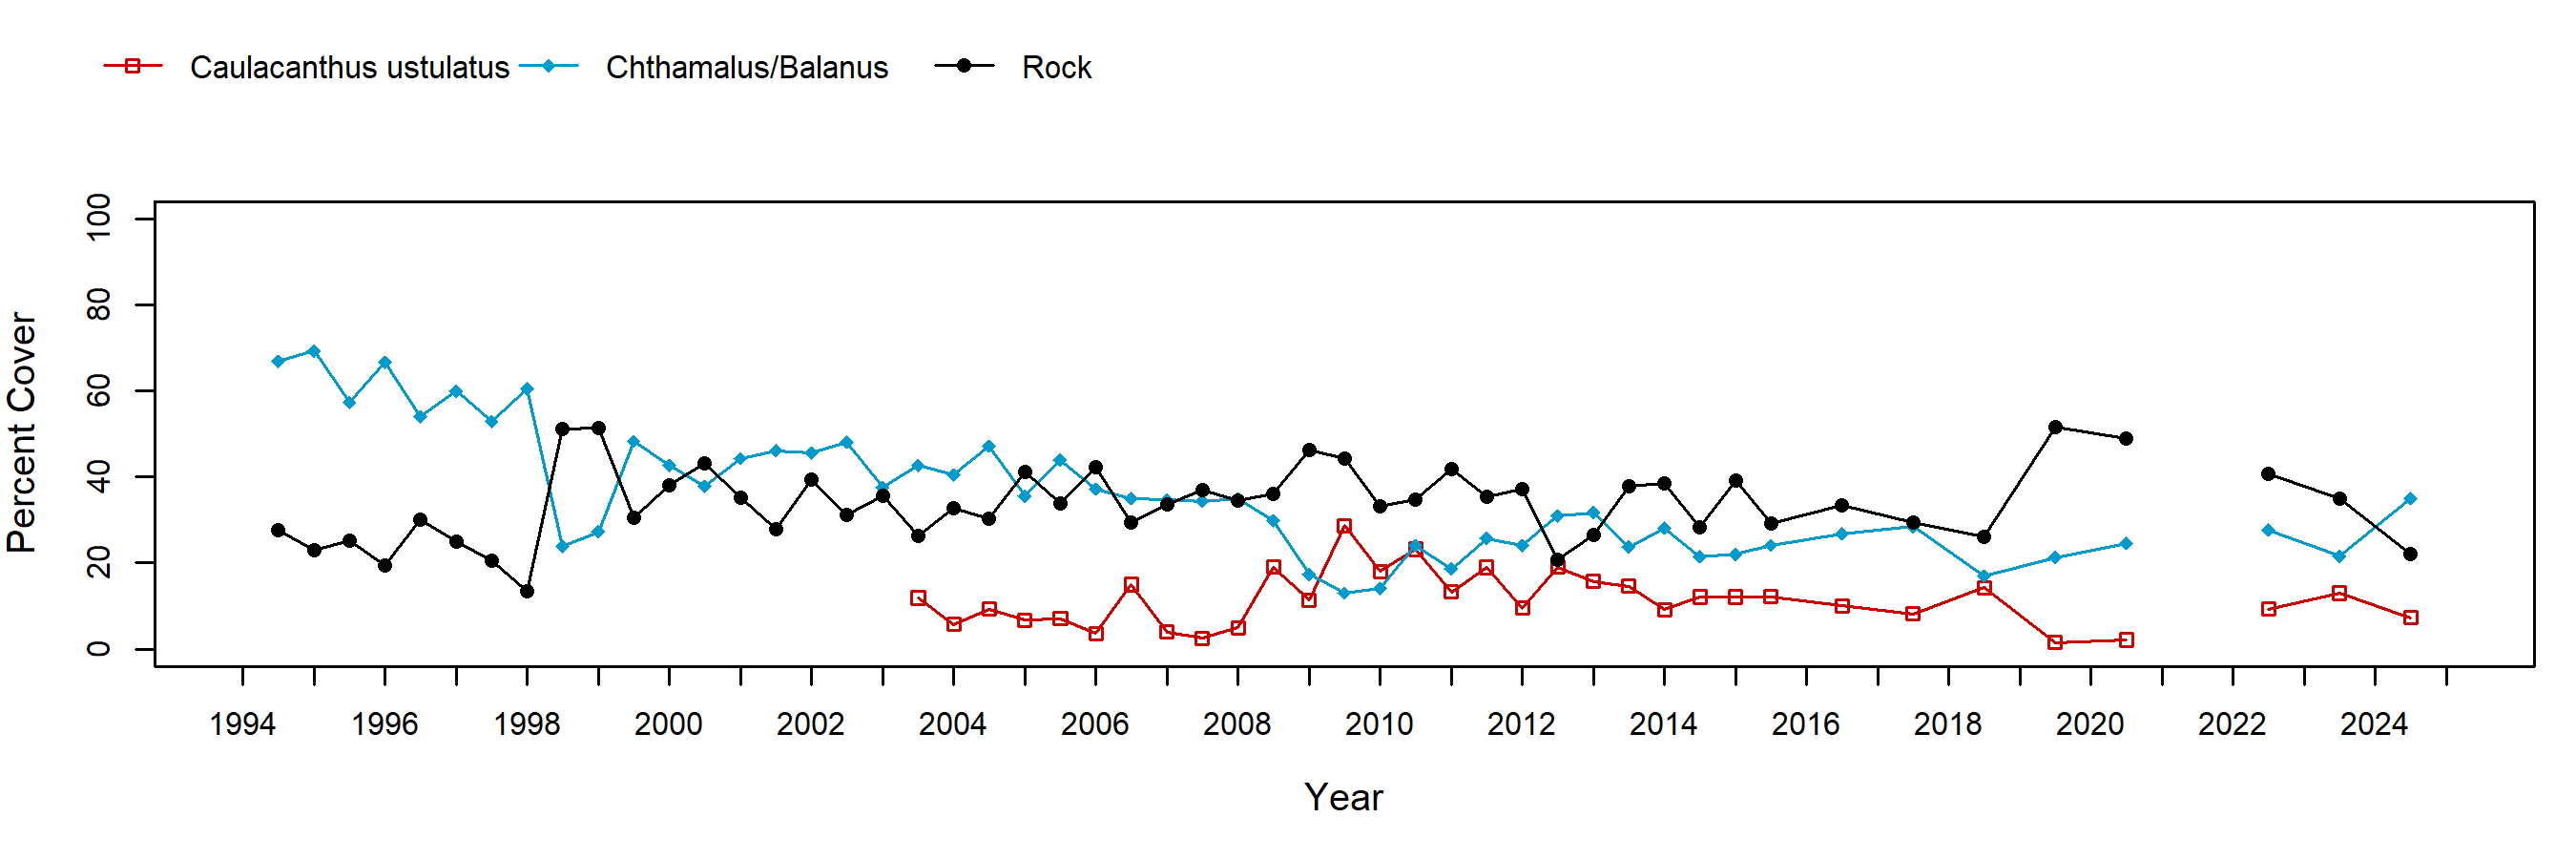
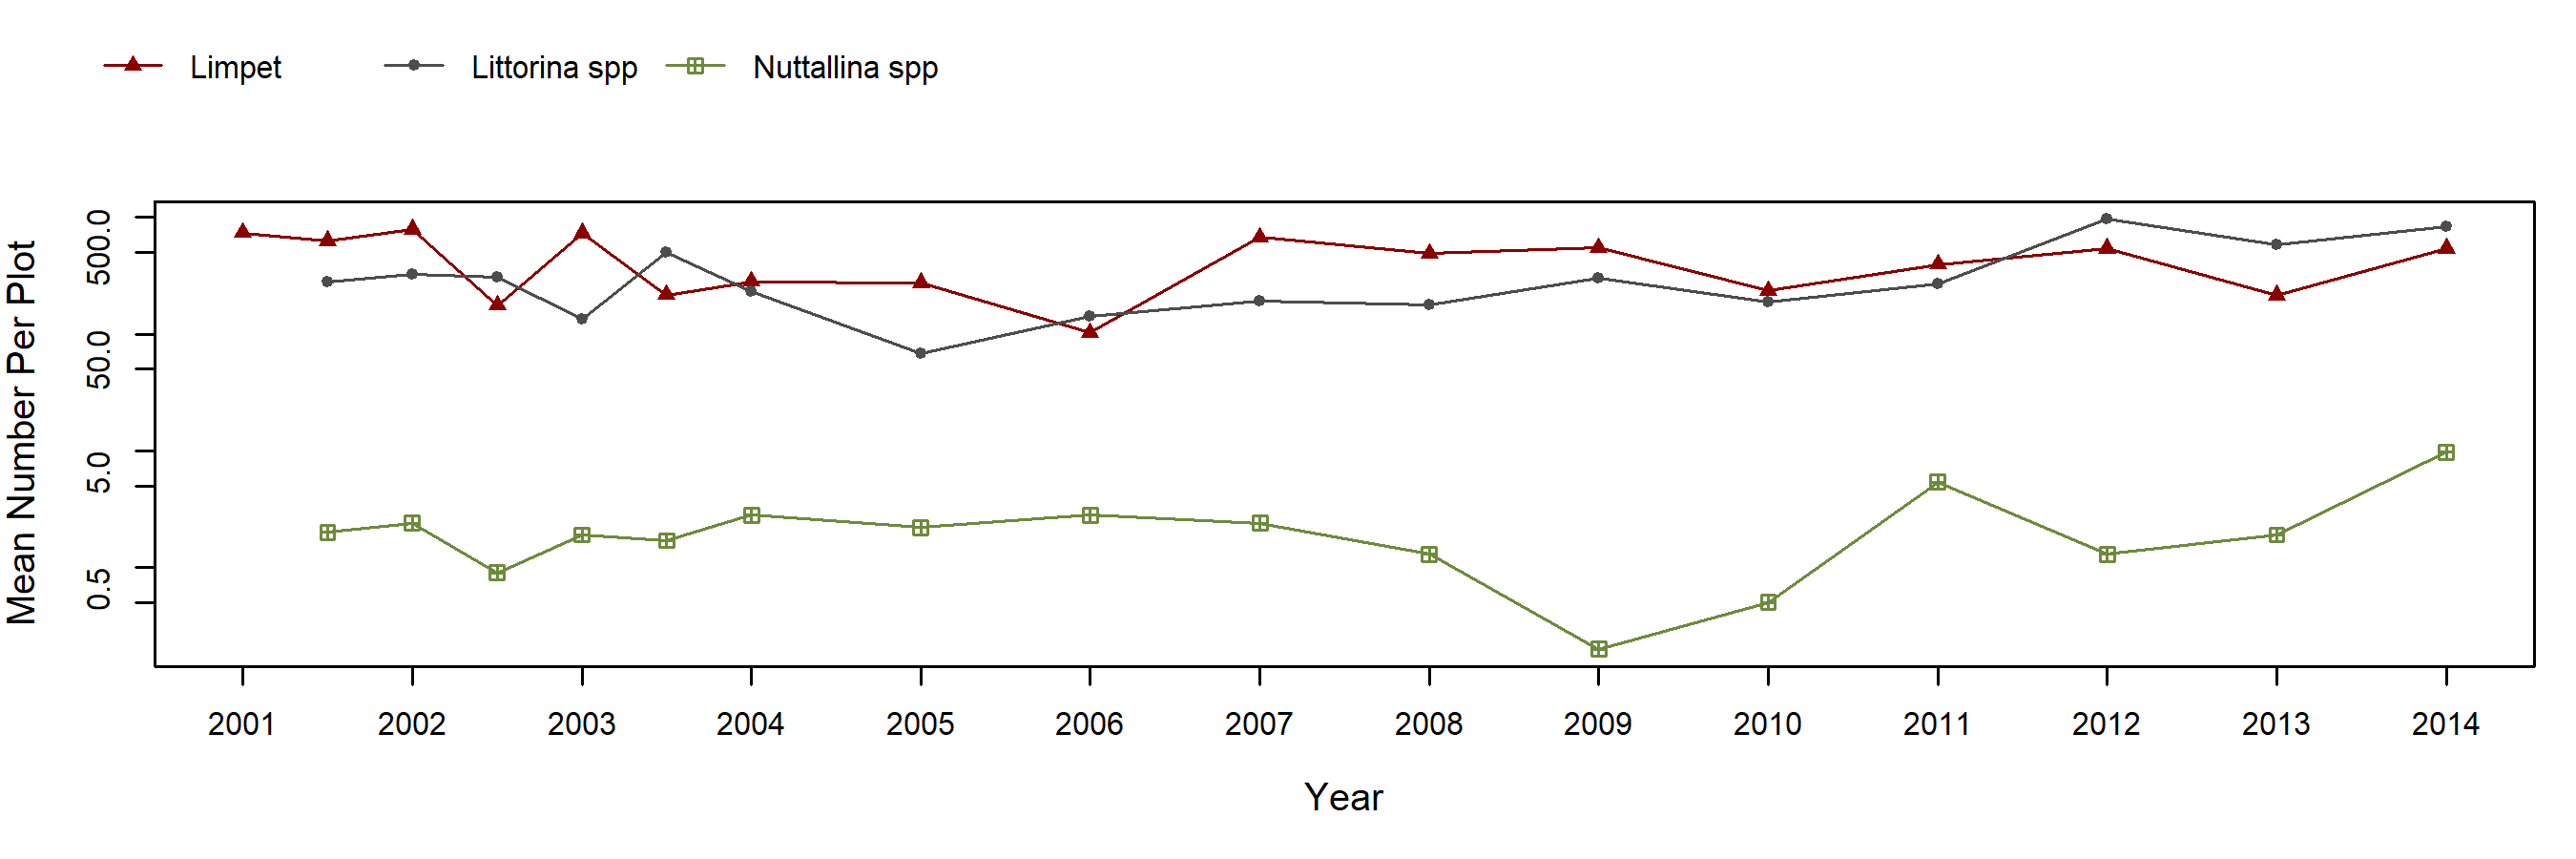
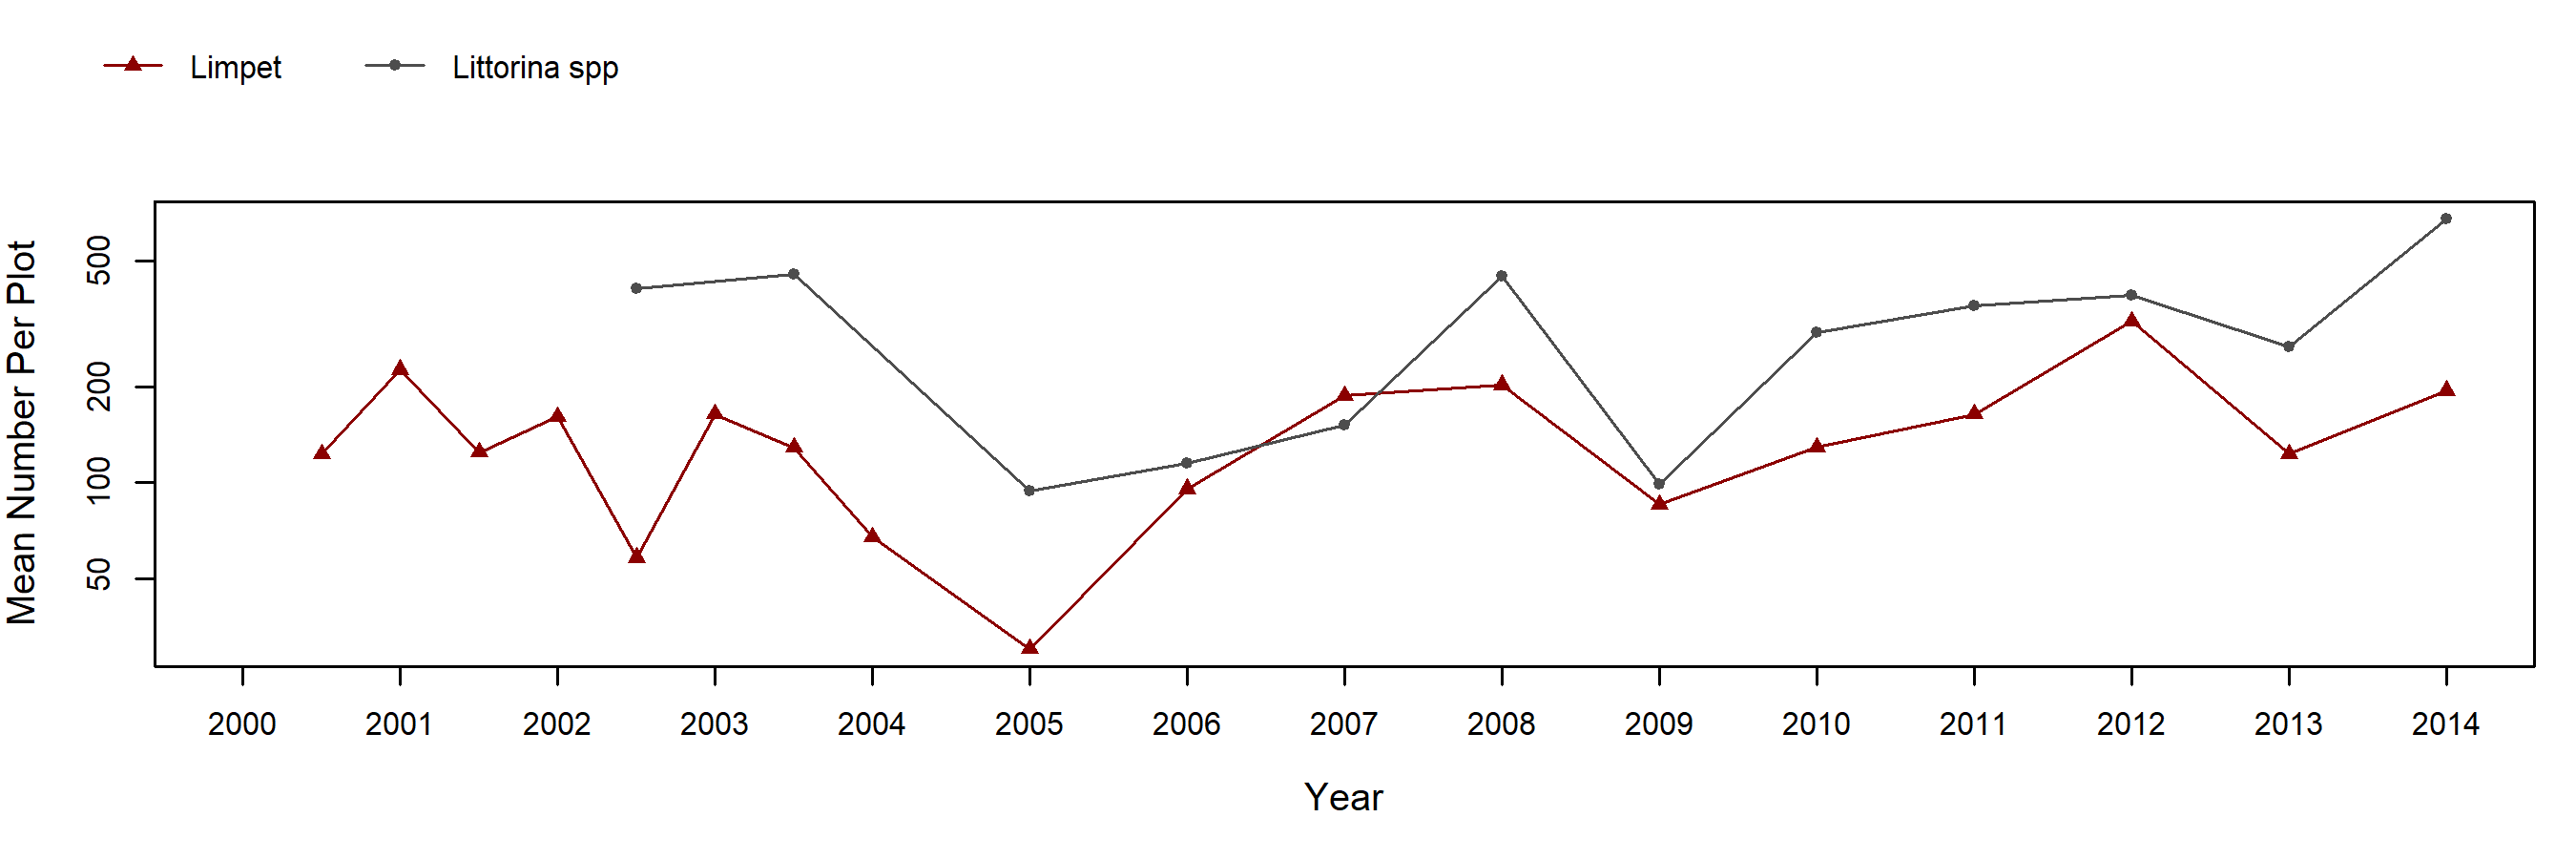
Chthamalus/Balanus barnacle plots at White Point consist of 5 plots initially dominated by Chthamalus dalli/fissus (note that species were not distinguished until 2001) and 5 plots initially dominated by Balanus glandula. While the original approach was to analyze these as separate assemblages, all ten plots were combined collectively as “barnacle plots” since the two genera were lumped during data collection. Within these ten barnacle plots, barnacle cover has declined gradually throughout the monitoring period from ~65% to ~30%, with one episode of precipitous decline and recovery in the late 1990's and another dip in cover in 2009-2010. Concurrently, bare rock cover exhibited a steady increase over time. In addition, the non-native red alga Caulacanthus invaded plots in 2003 with cover between 10-30%. Motile invertebrate counts at this site began seasonally in spring 2001 (with Littorine snails counted starting in fall 2001) but were changed to annual sampling in 2004 through 2014 when sampling ceased. Both limpets and Littorines were abundant, with 500 or more individuals per plot during some seasons. Nutallina chitons were also common, typically less than 10 individuals per plot, except in 2009 when abundance was low.
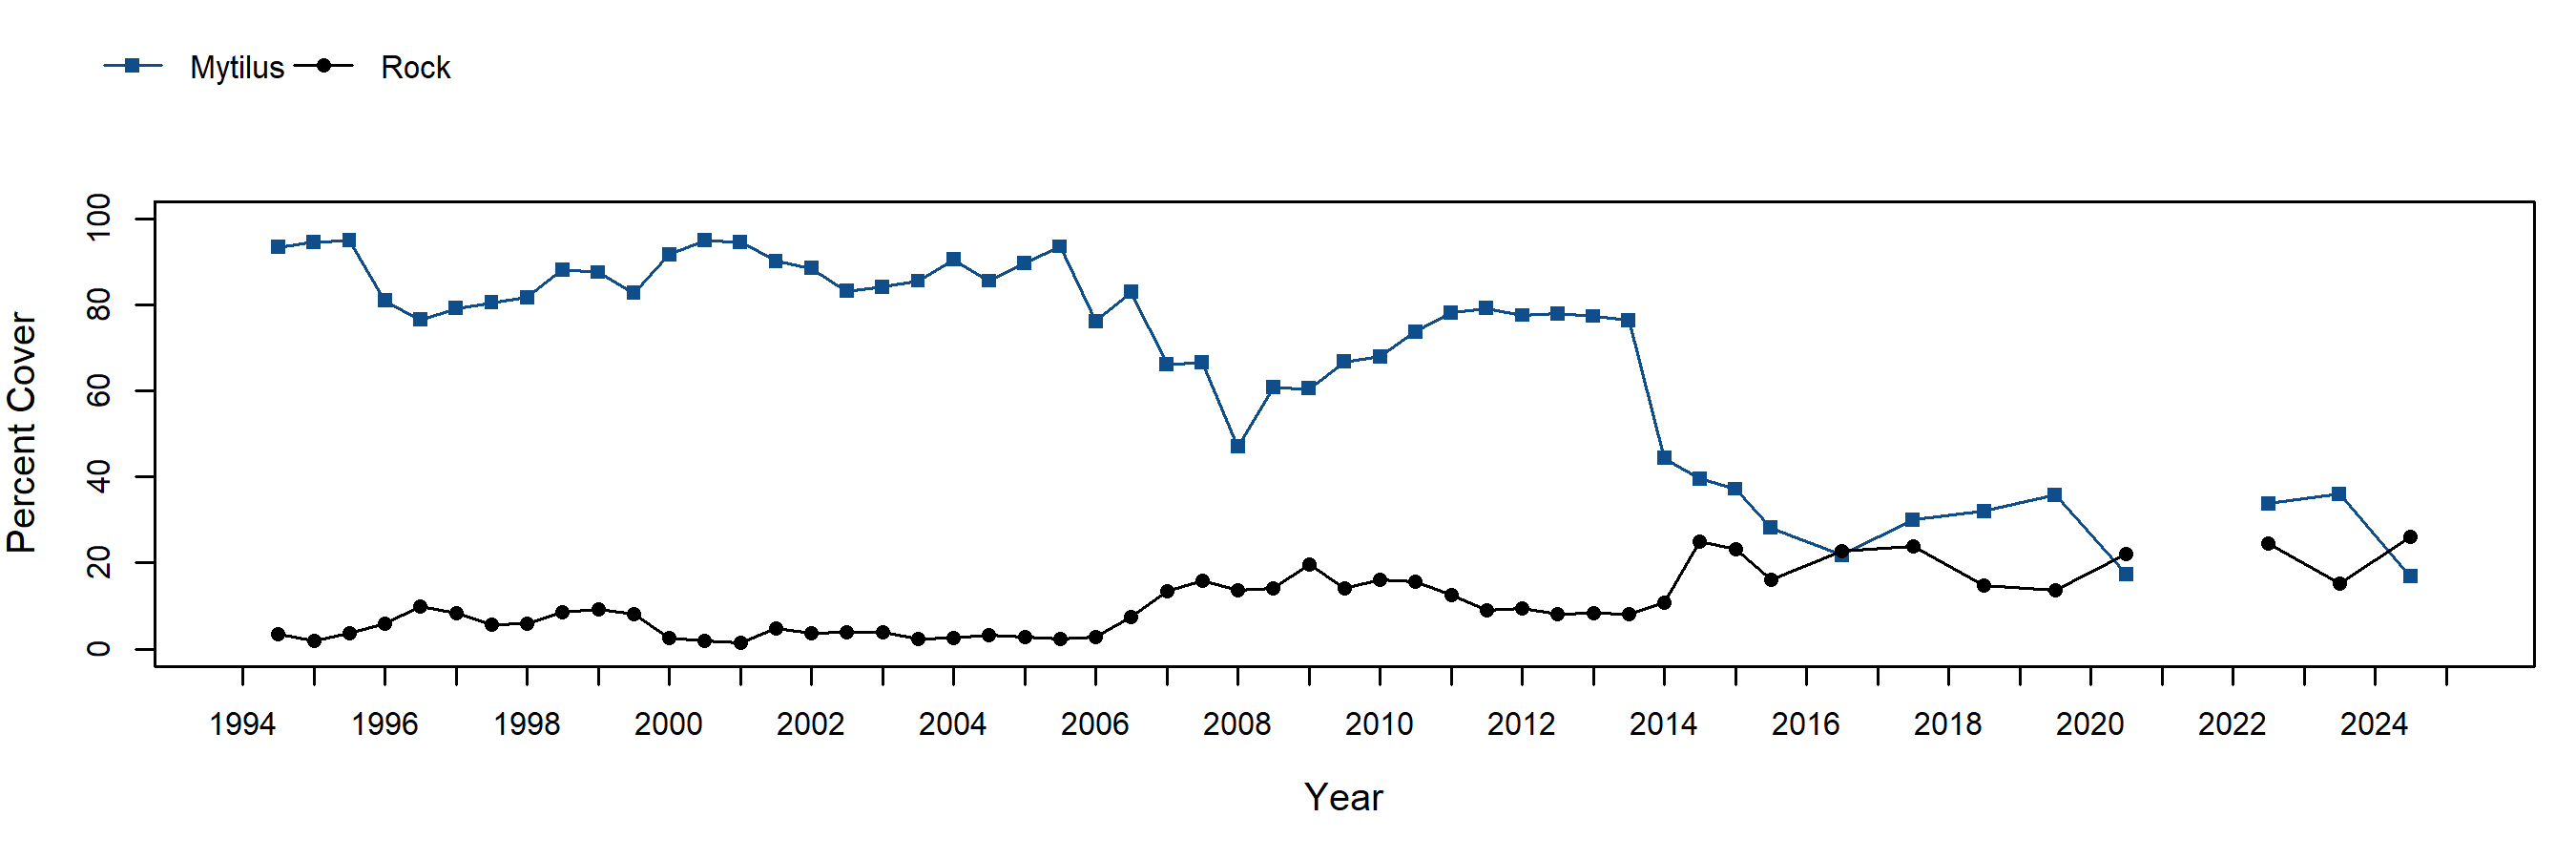
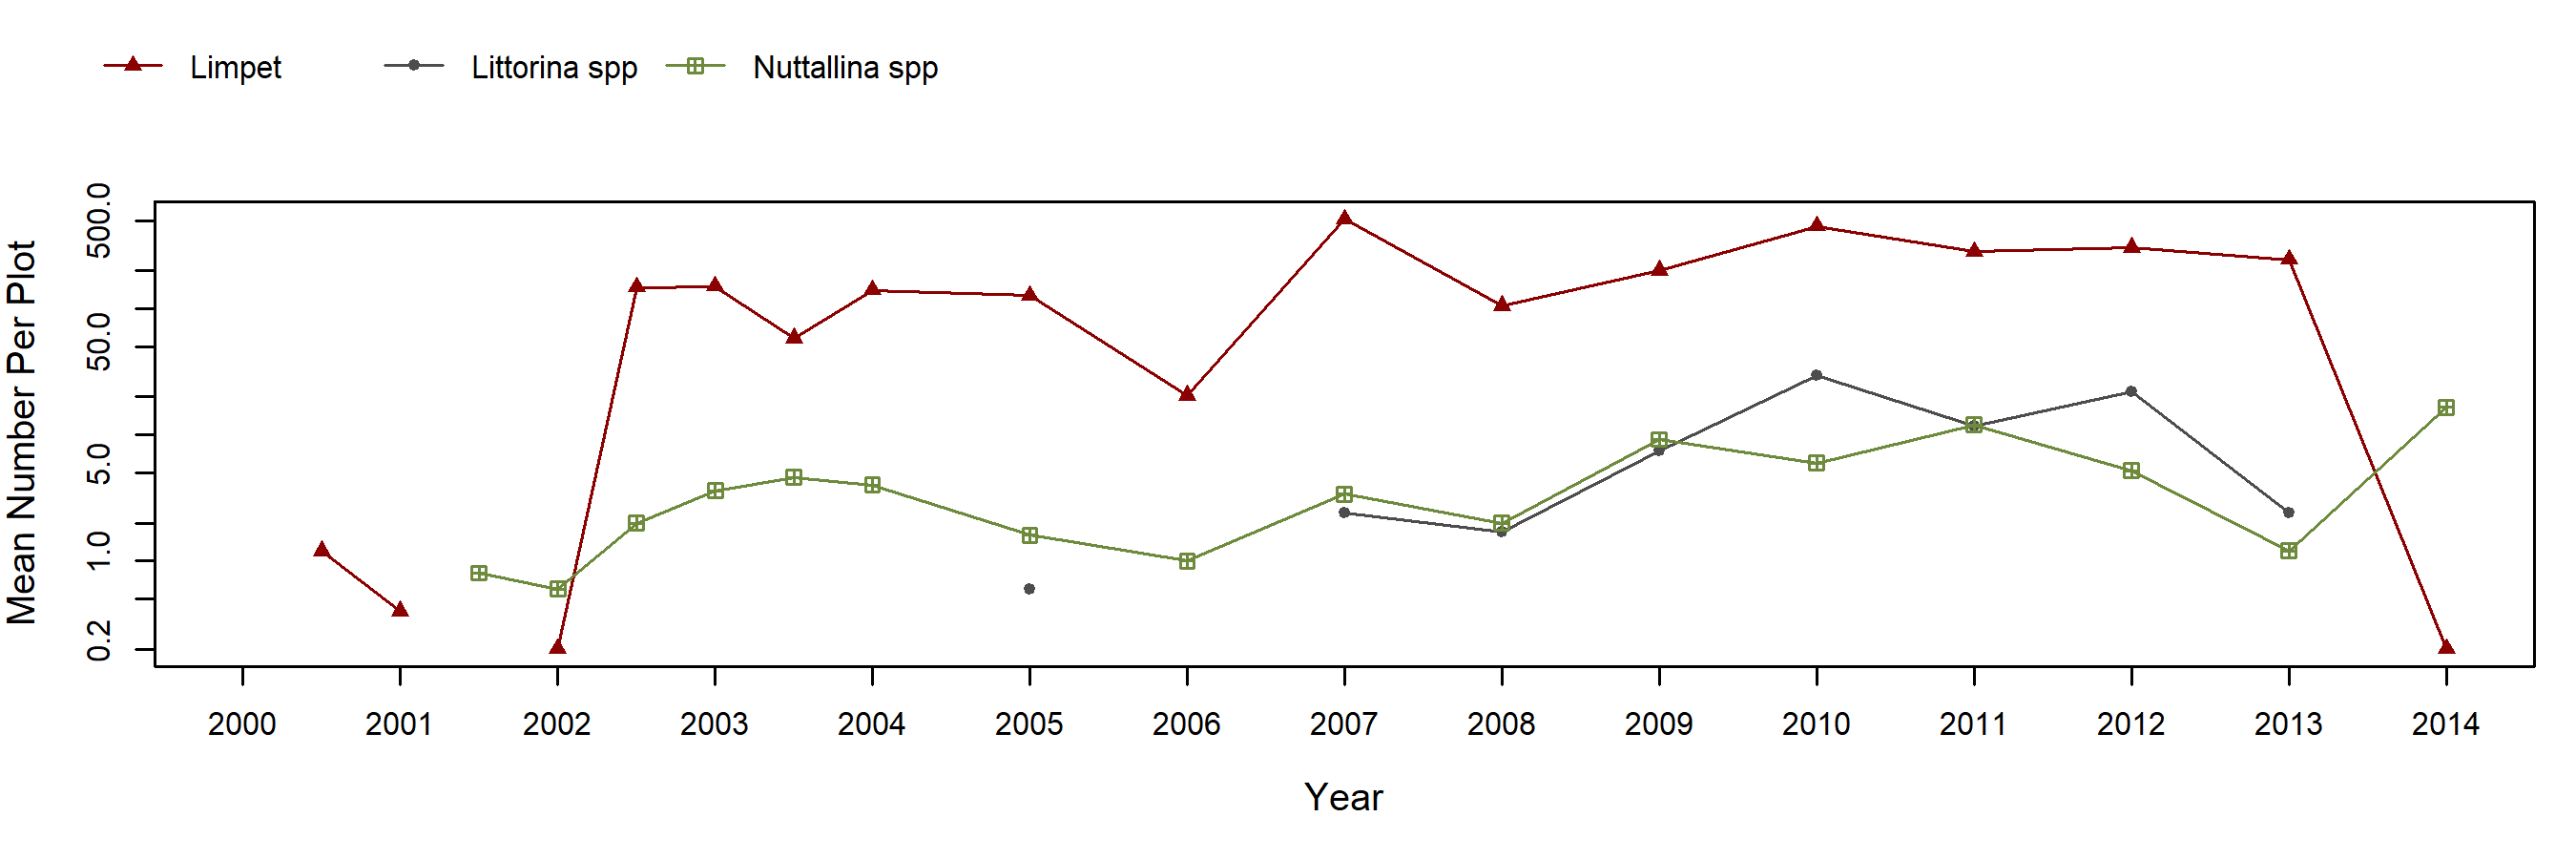
Mytilus cover in mussel plots was initially high (~90%) and remained above ~80% until 2005, after which cover dropped to a low of ~50% by 2008. From 2008-20013, a slow increase was observed, reaching ~75%. Cover then decreased markedly in spring 2014 to ~45%, stabilizing between 30-40% through 2018. The marked loss in mussels in 2014 where attributed to two plots which exhibited partial to complete mussel collapse, presumably as a result of unusually strong winter storms. The patterns observed in plots are indicative of declines in mussels on the upper, flat shelves of the site, where beds consist of single-layered, tightly packed patches of smaller sized mussels. However, mussel beds on a low shelf exposed to large wave action consist of much larger mussels within multi-layered beds. In some mussel plots, as well as in other areas of high shelf mussel beds at the site, mussels have periodically been found to be epiphytized by the non-native alga Caulacanthus that can be thick enough to obscure mussels entirely. It is unknown whether Caulacanthus may have contributed to mussel declines, but heavy overgrowth of mussels by this species could potentially influence mussel feeding, mussel recruitment, and bed replenishment. Motile invertebrate counts indicate that limpets were common in mussel plots, reaching between 100-500 individuals per plot in most years. Nuttalina chitons and Littorine snails are also present in these plots in low numbers, although exhibiting moderately higher numbers in 2008 to 2013 than 2001-2007. Littorines and limpets were not sampled in 2014.
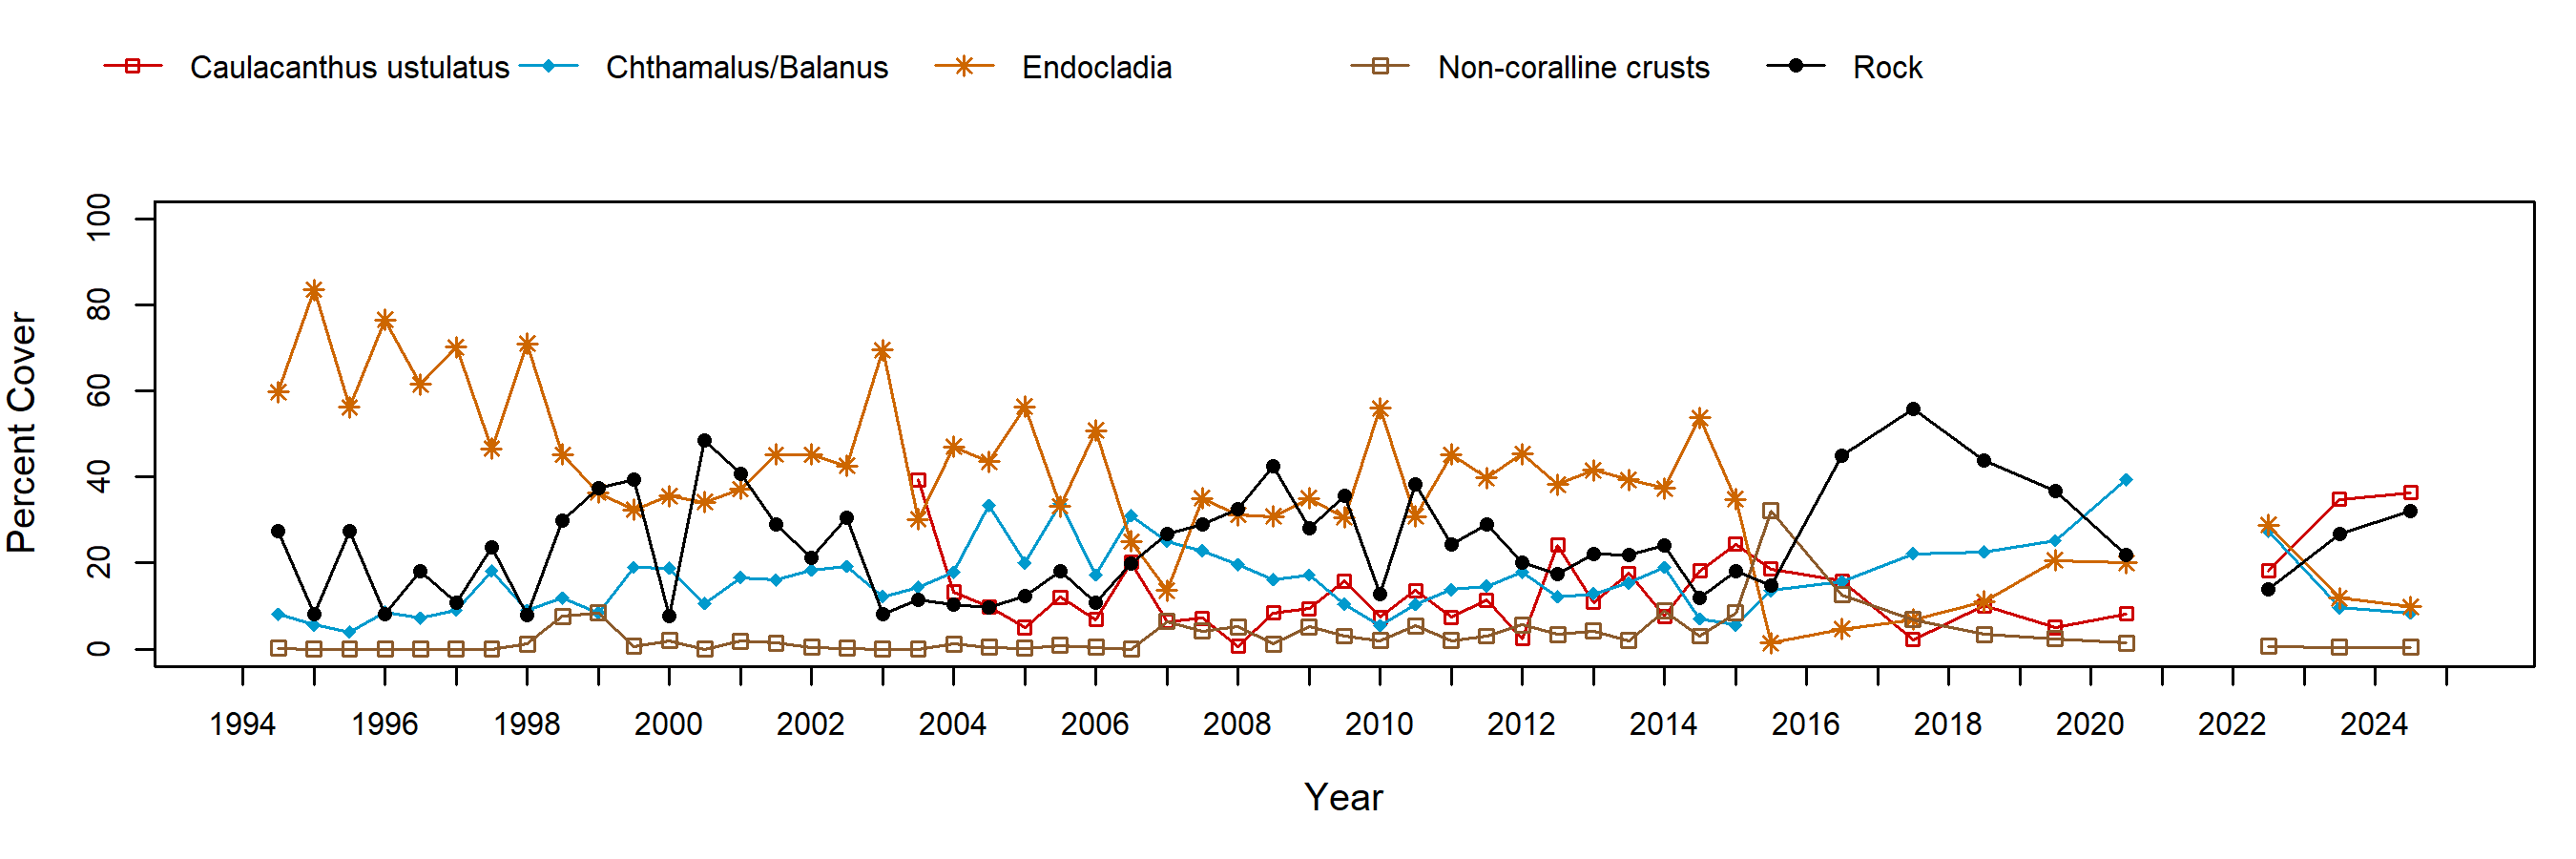
Within turfweed plots, Endocladia cover exhibited relatively consistent seasonal patterns, with higher cover in spring than in fall. Over time, Endocladia cover, although seasonally and interannually variable, slowly declined, with a notable drop in cover between spring 2015 and fall 2015 (~40 to 0%); since then, the turfweed has only slightly recovered through 2018 (<15%). Barnacle and bare rock cover have generally, but inconsistently, exhibited an inverse seasonal pattern to Endocladia. Following the large decline in Endocladia in 2015, bare rock became dominant through 2018 (~50%). The non-native red alga Caulacanthus was first recorded in plots in 2003 with relatively high cover (~40%) and has remained common in plots, ranging between 10-30%. Motile invertebrate counts within turfweed plots reveal a high abundance, as well as high variability, of both limpets and Littorine snails. A notable collapse in limpet numbers was observed in spring 2005.
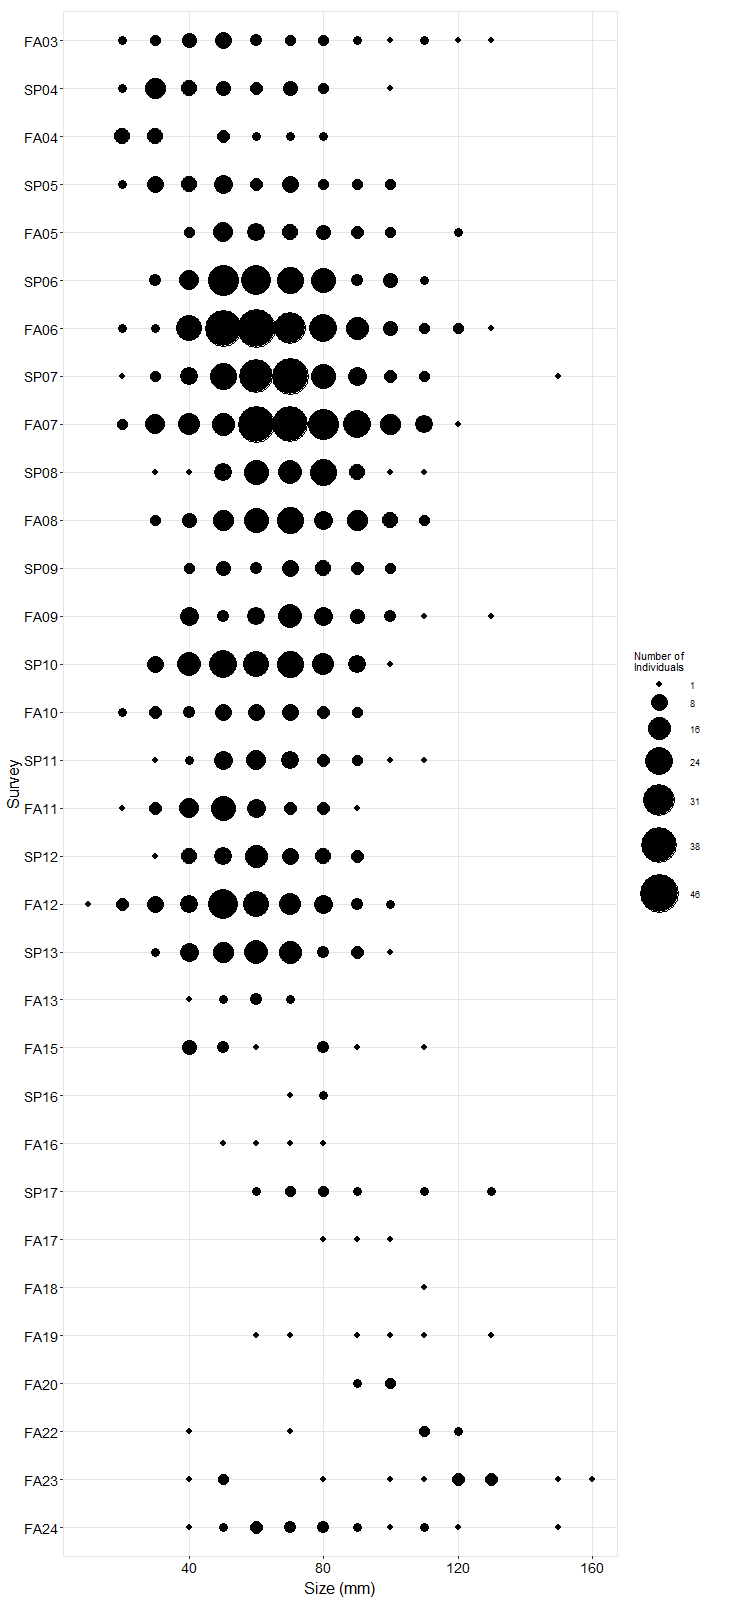
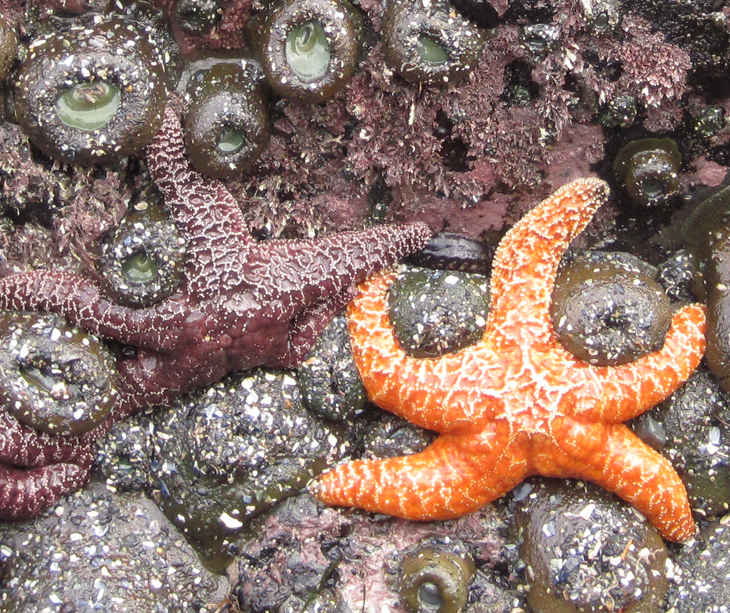
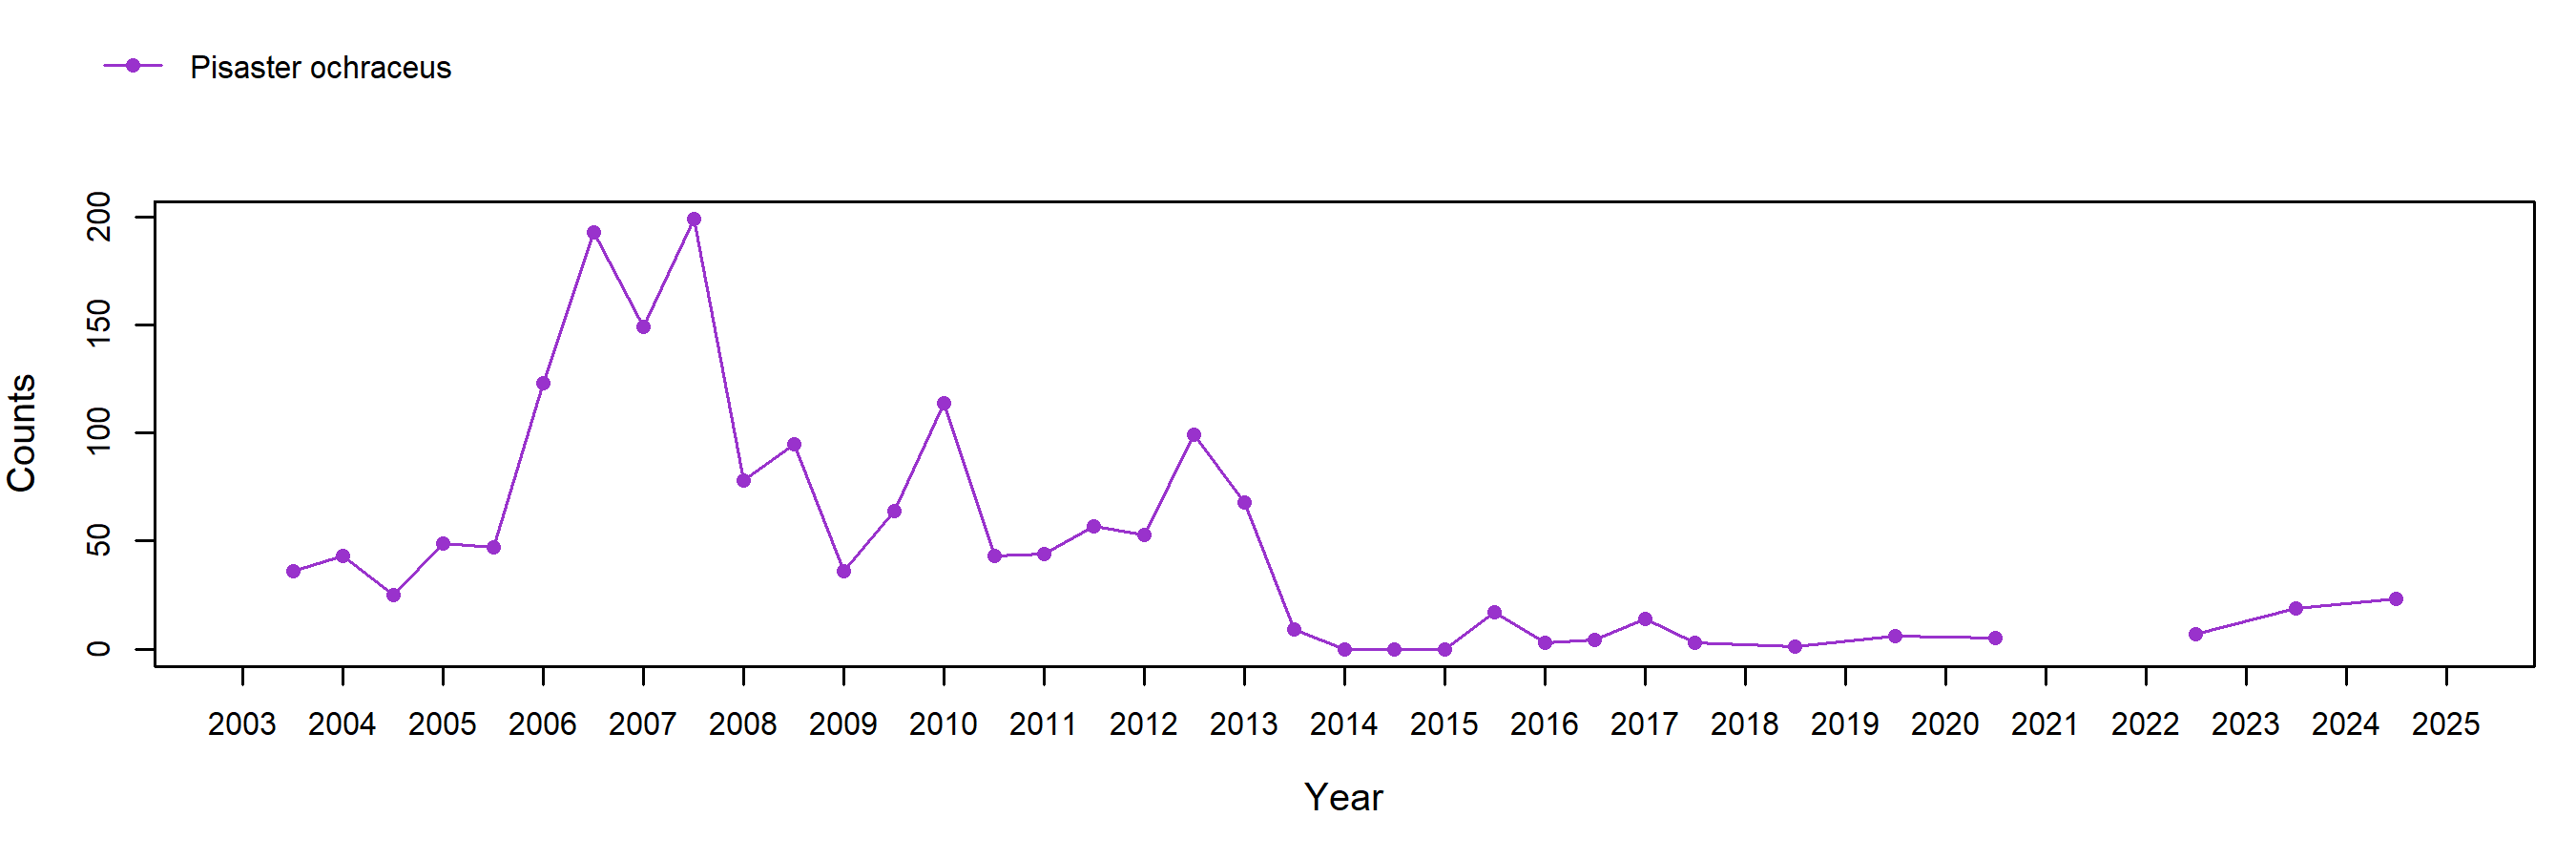
Sea star (Pisaster ochraceus) plots were added to this site in the fall of 2003 and consist of three large irregular plots surrounding an area of medium relief rock, which includes several large cracks and ledges. Initial sampling yielded just under 50 individuals for several years, with abundances increasing considerably in 2006 and 2007 to a high of ~200 seastars. This was followed by a drop to basal levels in 2009, with peaks of around 100 seastars in spring 2010 and fall 2012. Seastar wasting disease impacted this site prior to fall 2013 sampling, with only a couple of seastars found, each with heavy lesions or missing arms. From 2015 to 2018, only a few seastars have been found in plots. Recruitment has been common at this site with seastars in the 50 mm or less range found in most seasons through spring 2013. Seastars in the larger size classes (>100 mm) are generally rare at White Point, possibly due to high and largely unregulated human visitation, resulting in harvesting and/or damage through handling and manipulation by visitors.
Photo Plots
Below are the trends observed for each Photo Plot target species at this site. Long-Term percent cover trend graphs also include any species that reached a minimum of 25% cover during any single point in time within a given target species assemblage. Breaks in trend lines represent missed sampling events. For additional species observed that did not meet this 25% threshold, please use the Interactive Map.
For motile invertebrate Species Counts, a mean across all plots was calculated, and only those species with a value of at least 5 individuals for at least one sample are shown. Due to time constraints, motile invertebrate counts have not been done at most sites since 2012. For motile invertebrate size trend graphs by site, please use the Interactive Map.
Chthamalus/Balanus (Acorn Barnacles) - percent cover
Chthamalus/Balanus (Acorn Barnacles) - motile invertebrate counts
Mytilus (California Mussel) - percent cover
Mytilus (California Mussel) - motile invertebrate counts
Endocladia (Turfweed) - percent cover
Endocladia (Turfweed) - motile invertebrate counts
Species Counts and Sizes
Species Counts and Sizes (where recorded) for Pisaster are shown below for this site. At some sites, other sea star species and Katharina are counted in addition to Pisaster. The sum of all individuals across all plots is displayed. Note that data gaps are represented by breaks in long-term count trend lines, but are not shown in size plots.
Pisaster (Ochre Star) - counts
Pisaster (Ochre Star) - sizes