Long-Term Monitoring Trend Graphs
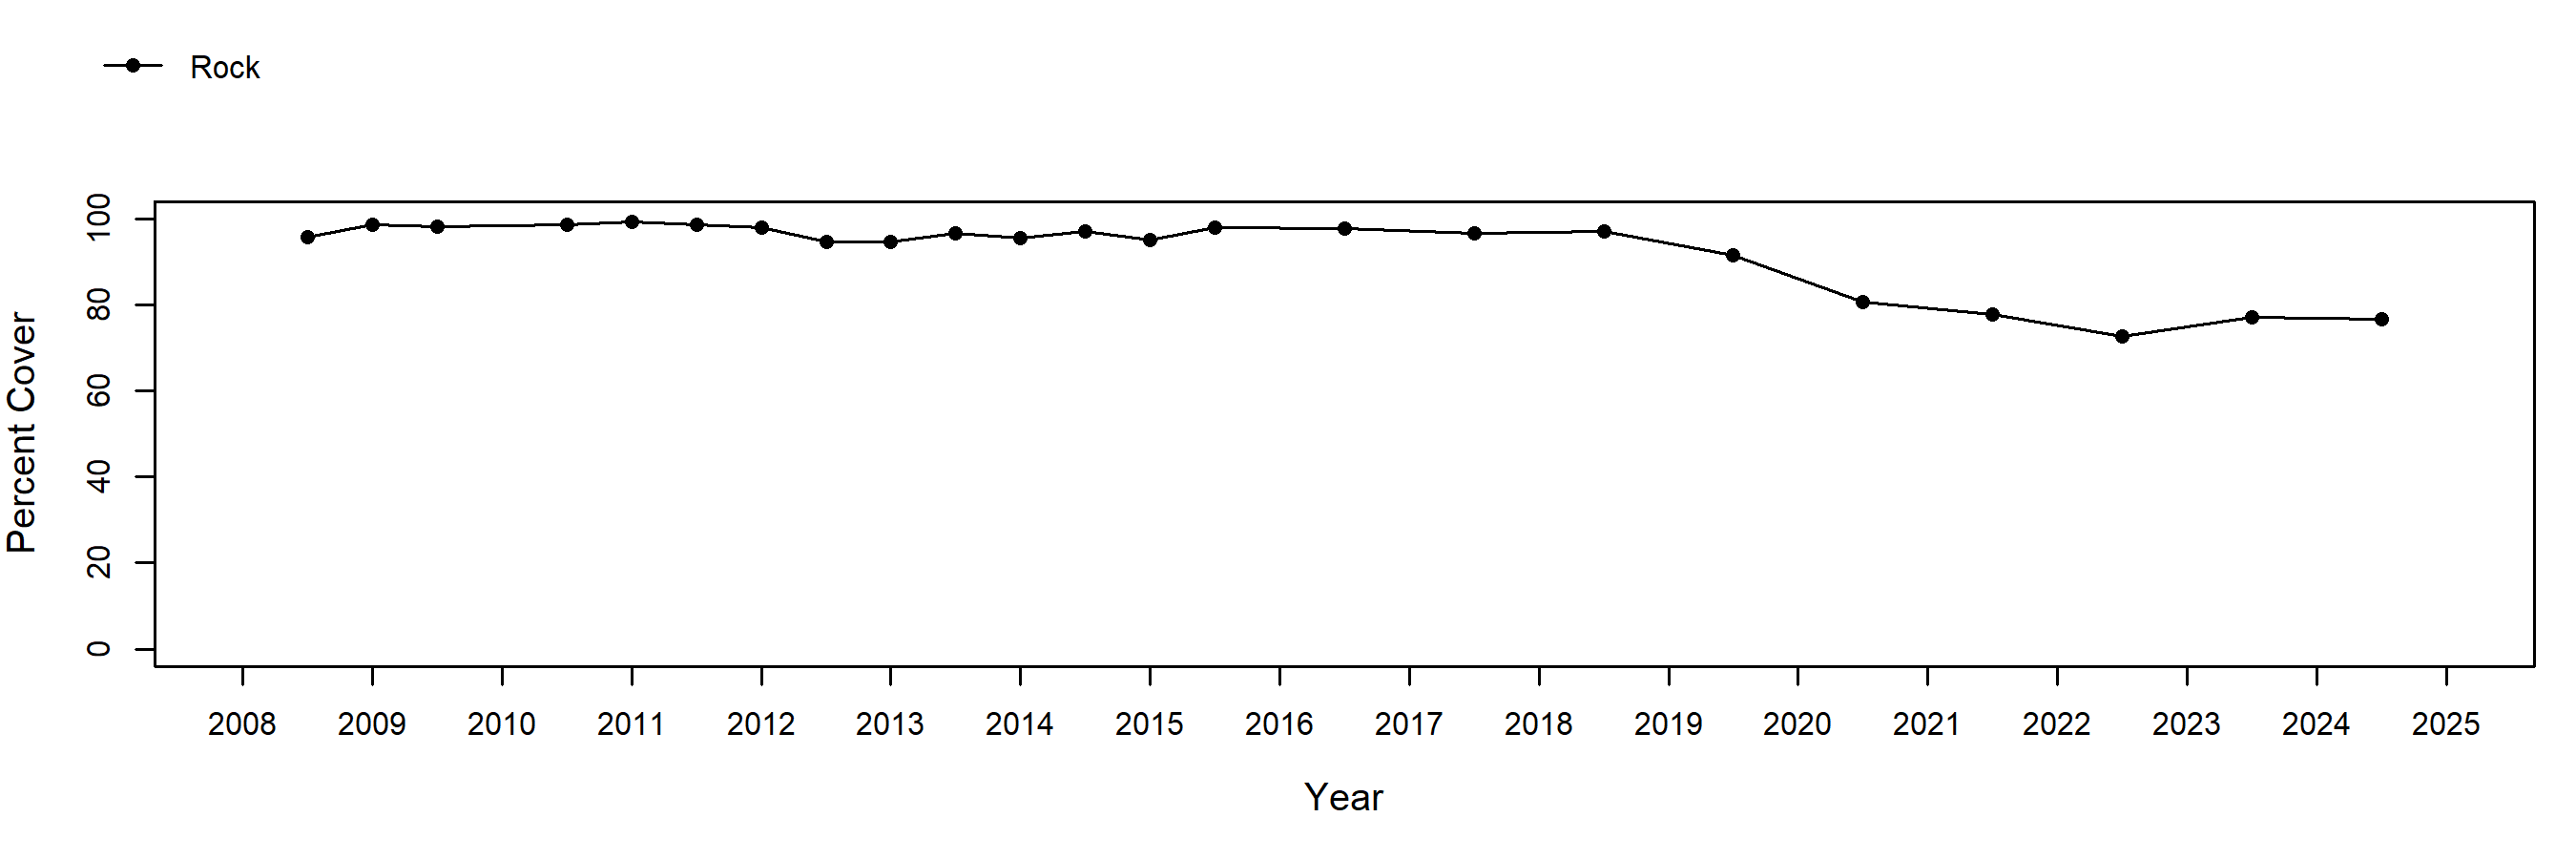
Anthopleura anemone plots at Old Stairs consist primarily of the colonial anemone, Anthopleura elegantissima, rather than the solitary anemone, Anthopleura sola (note that these were considered a single species for the first ~decade of sampling and they are not distinguished in sampling methods). The cover of anemones has declined over time, falling below 20% in the fall 2024 survey. Conversely, mussel cover began increasing in anemone plots in 2016, reaching ~50% cover by fall 2020. Chthamalus/Balanus barnacle plots consist of a mixture of Chthamalus dalli/fissus (note that species were not distinguished until 2001) and Balanus glandula, with the former being the dominant component of all plots. Percent cover of barnacles has been variable, but has exhibited a steady decline over time, reaching the lowest observed cover in fall 2024. Percent cover of Mytilus in mussel plots was variable over time, with occasional steep declines due to heavy winter storms. Consistent recruitment of young mussels to this site has allowed these mussel beds to regenerate before other opportunistic species become established in the plots. Endocladia turfweed plots consisted of a diverse mixture of turfweed, barnacles, mussels, and bare rock with no clear patterns developing throughout most of the monitoring period. However, starting in 2014, plots became dominated by bare rock while Endocladia practically disappeared. Rock (“Above Barnacles”) plots were added to this site in the fall of 2008 to document any upward spread of intertidal species as a result of sea level rise or other factors. Barnacles have been observed within plots since plot establishment, though cover remains low.
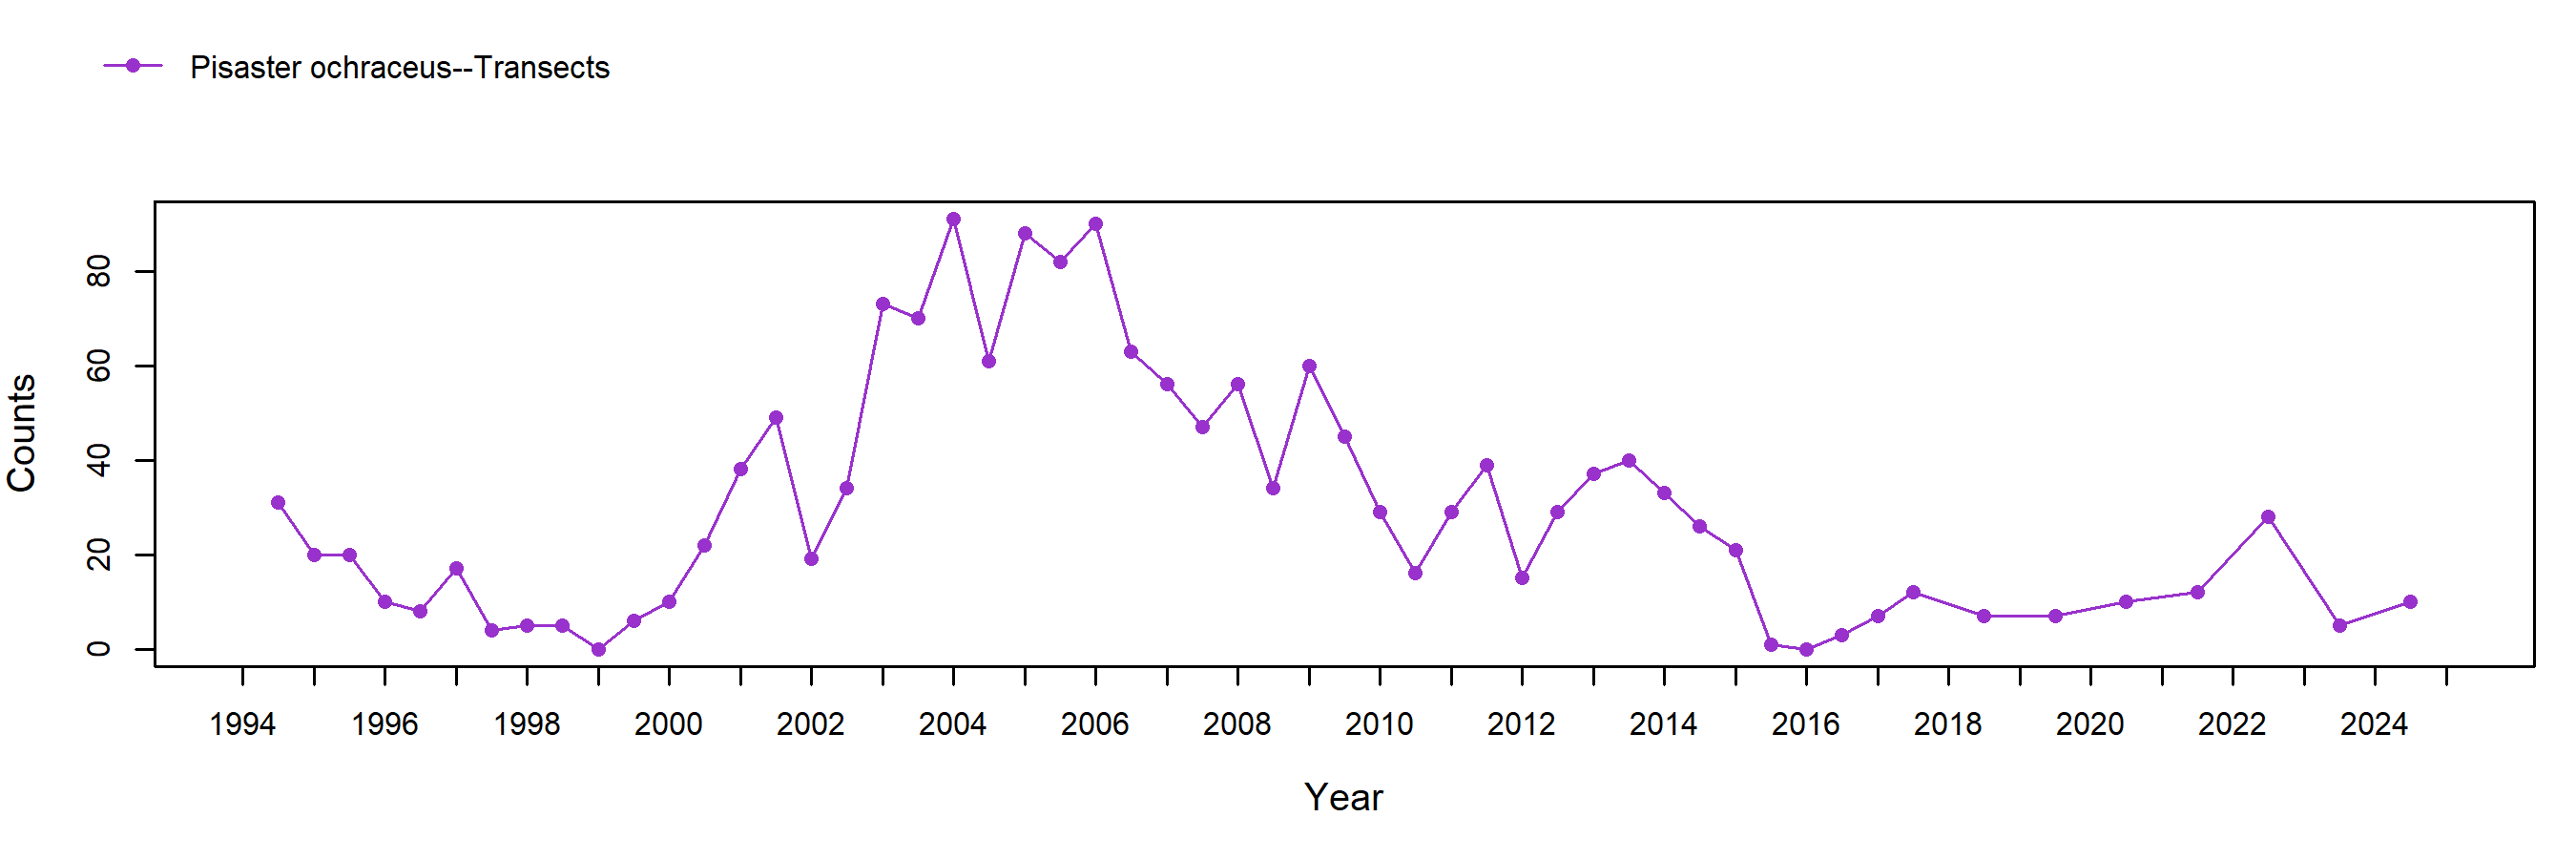
Sea star (Pisaster ochraceus) abundance at Old Stairs has been variable over time. In spring 2004, three large irregular plots were established and sampled concurrently with transects. Plot sampling counted a high number of sea stars (over 200) during the first several seasons of sampling, followed by declines to less than 50 stars by 2012. Abundances then increased slightly between 2012 and 2013 before dropping back to 50 individuals in spring 2014. Transect sampling showed a steady increase in Pisaster numbers until 2006, followed by a steady decline through 2012. While other sites in southern California were affected by Sea Star Wasting Syndrome as early as the summer of 2013, including documented disease related declines at sites upcoast and downcoast of this site, rapid declines likely attributable to wasting disease were not observed at Old Stairs until fall 2014. During fall 2014, most of the larger individuals were absent but a large number of young recruits were present. However, most of these sea stars were not found during sampling in fall 2015, with low abundances remaining through spring 2017. Size measurements of sea stars suggest the site was comprised primarily of mid to large sized individuals (50-100 mm) from 2000 to 2014, with a low frequency of very large sea stars (>150 mm). Recruitment, as indicated by sea stars less than 50 mm, was somewhat low but consistent over this time. The sea star population at Old Stairs prior to Sea Star Wasting Syndrome was likely maintained both through recruitment and through migration to and from the subtidal zone. Recruitment was relatively high during the period impacted by Sea Star Wasting Syndrome in spring 2014-2015, as compared to before the outbreak.
In order to standardize species resolution across all MARINe groups and over time, some species (typically rare) were lumped for graphical presentation of Long-Term monitoring data. See lumped categories for definitions (some variation occurs between methods and over time).
If you experience any barriers accessing the trend graphs below, please contact (pacificr@ucsc.edu) for help.
Photo Plots

Below are the trends observed for each Photo Plot target species at this site. Long-Term percent cover trend graphs also include any species that reached a minimum of 25% cover during any single point in time within a given target species assemblage. Breaks in trend lines represent missed sampling events. For additional species observed that did not meet this 25% threshold, please use the Graphing Tool.
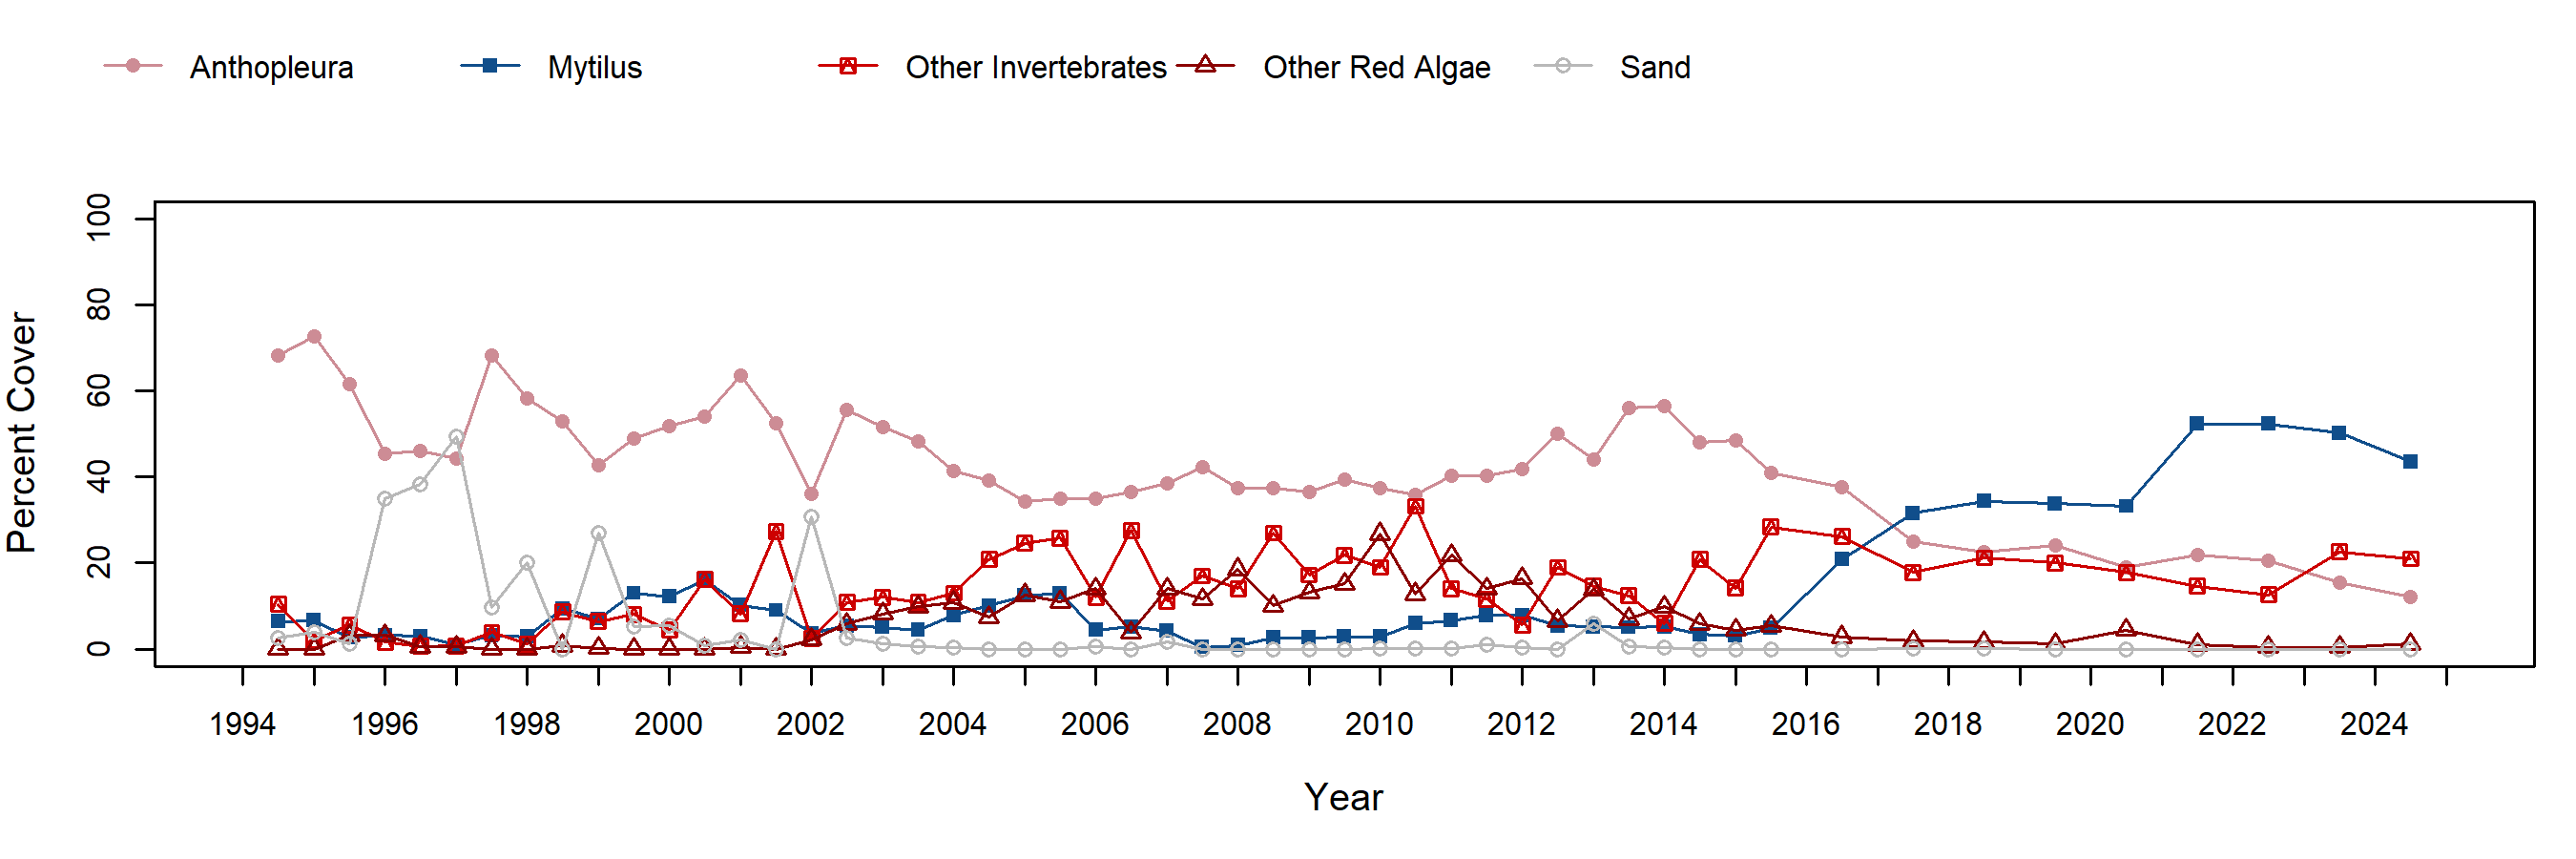
Anthopleura (Anemones) – percent cover
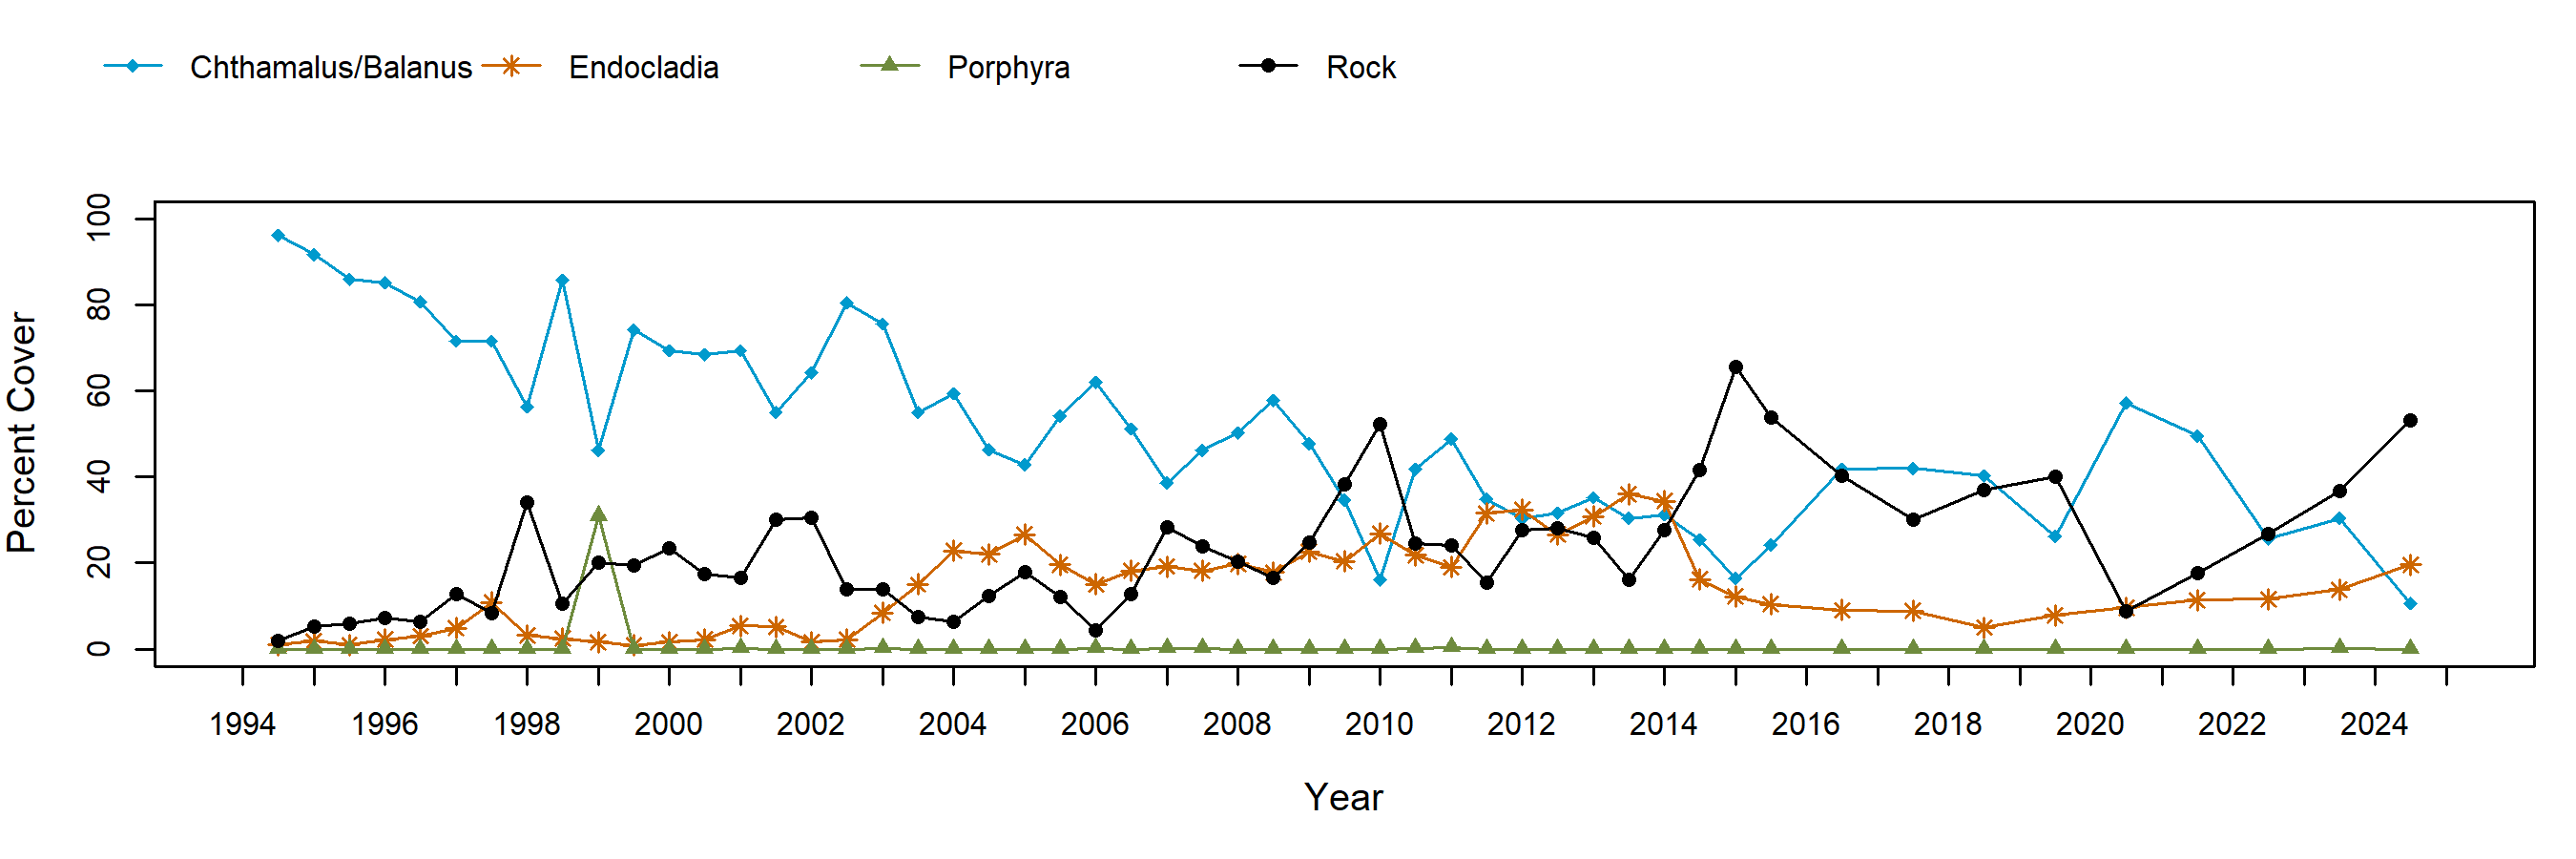
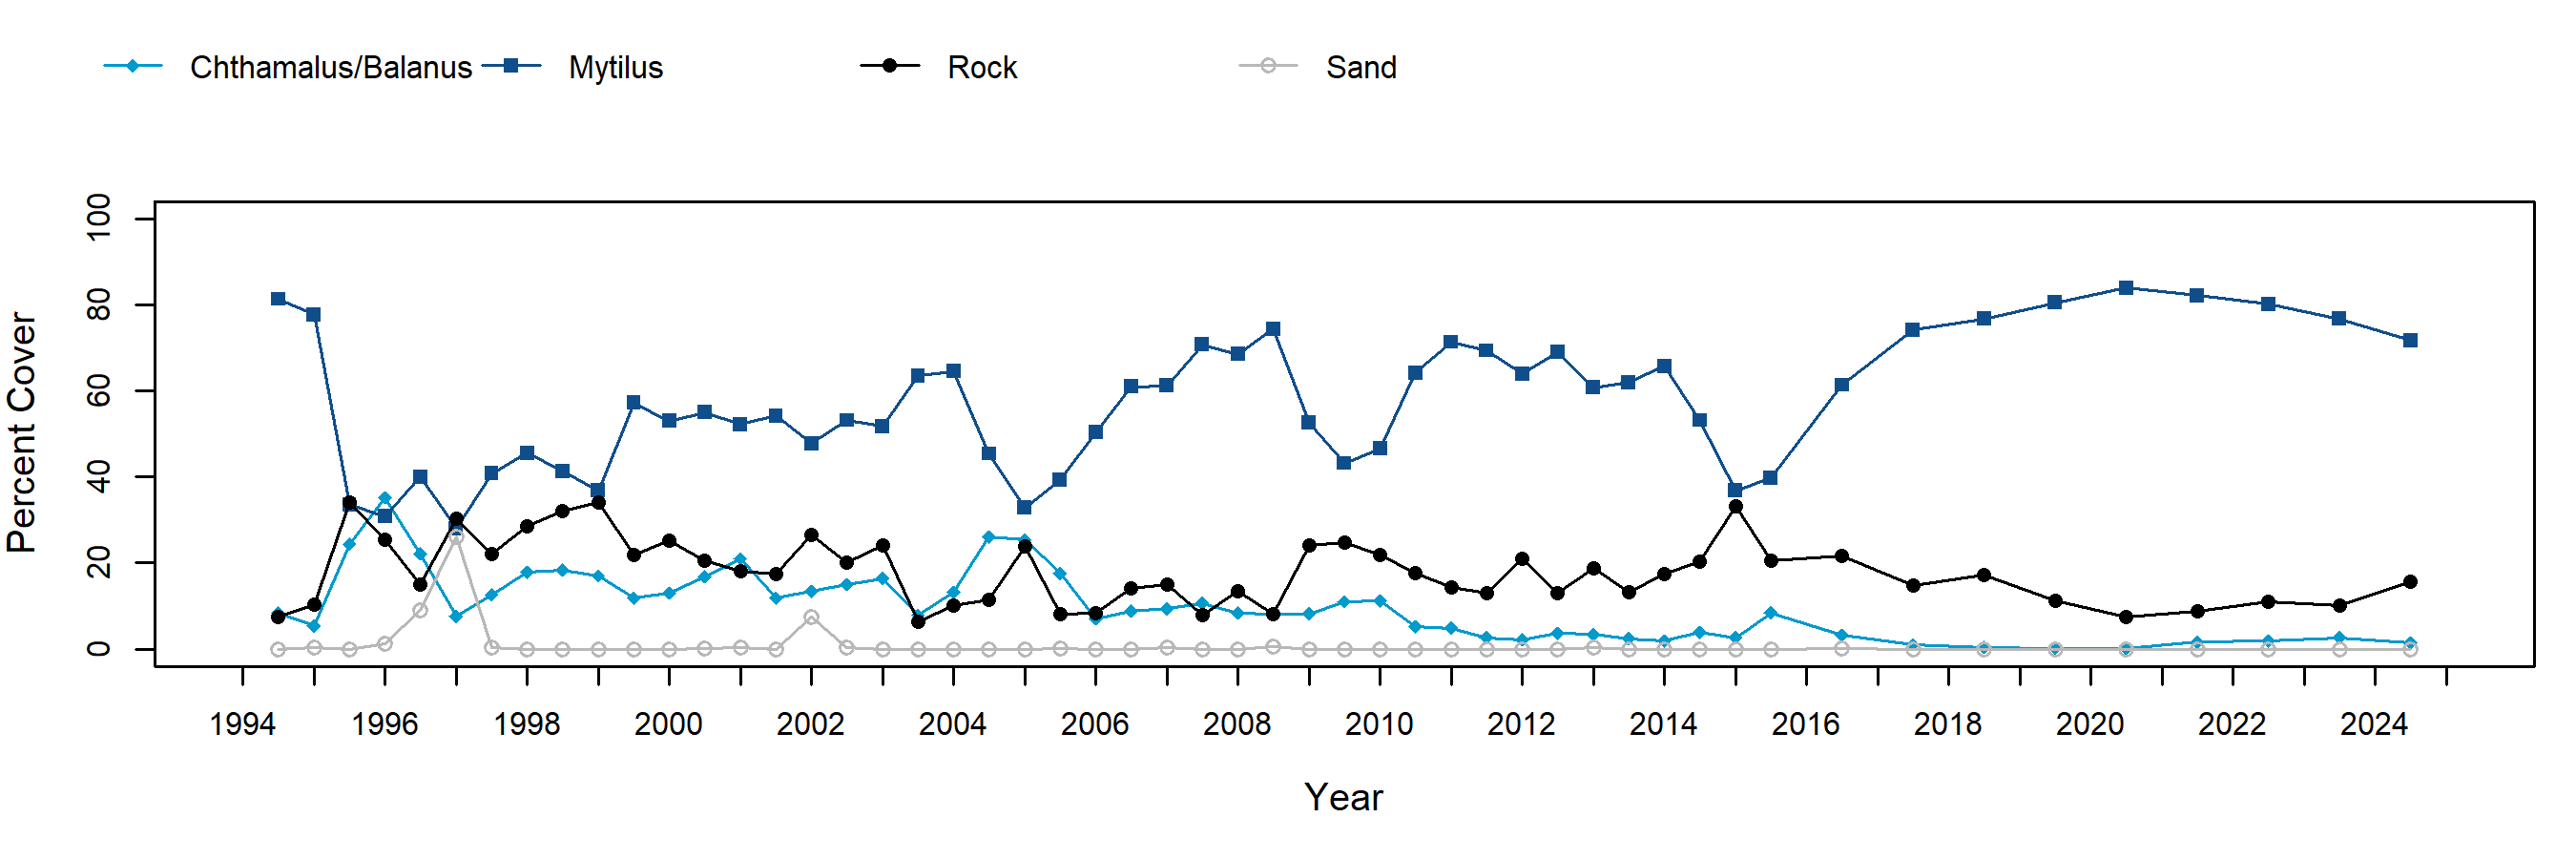
Chthamalus/Balanus (Acorn Barnacles) – percent cover
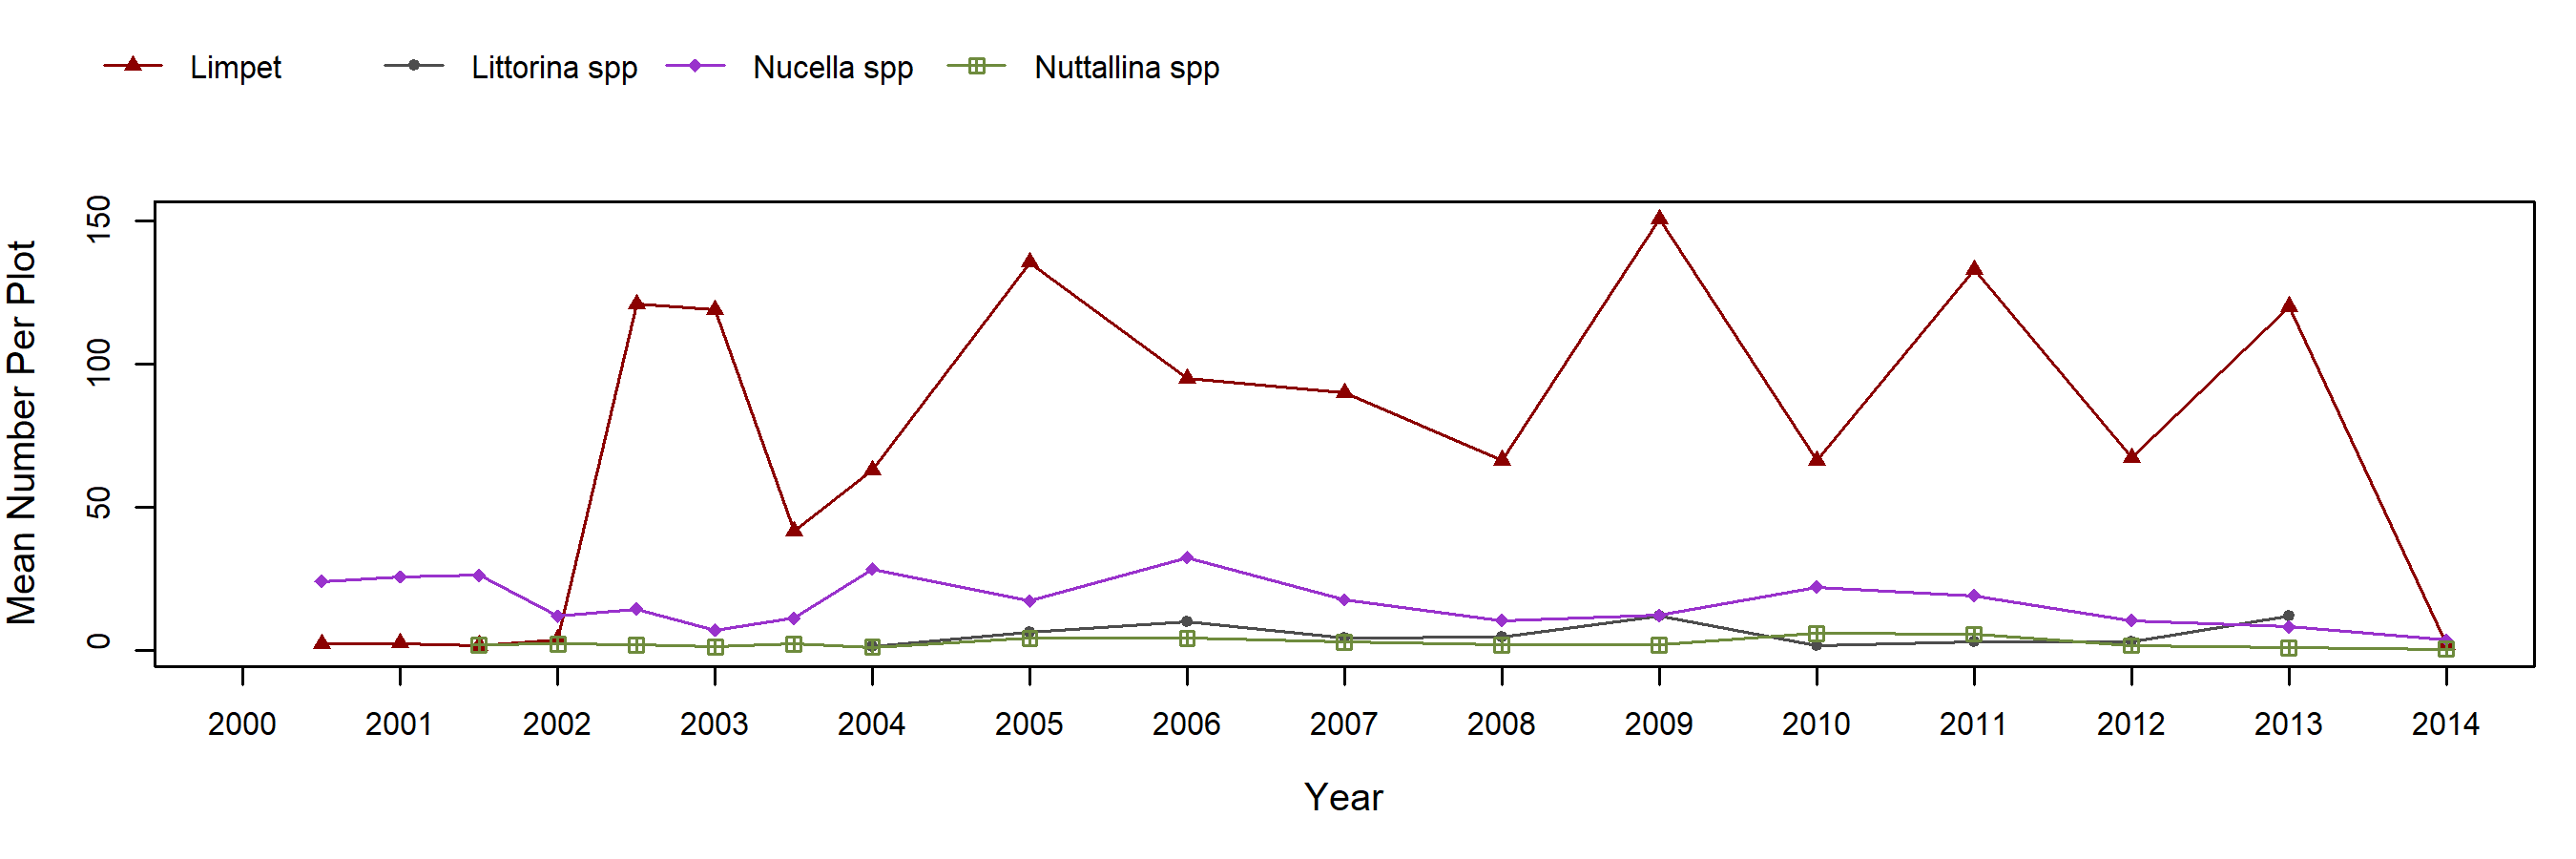
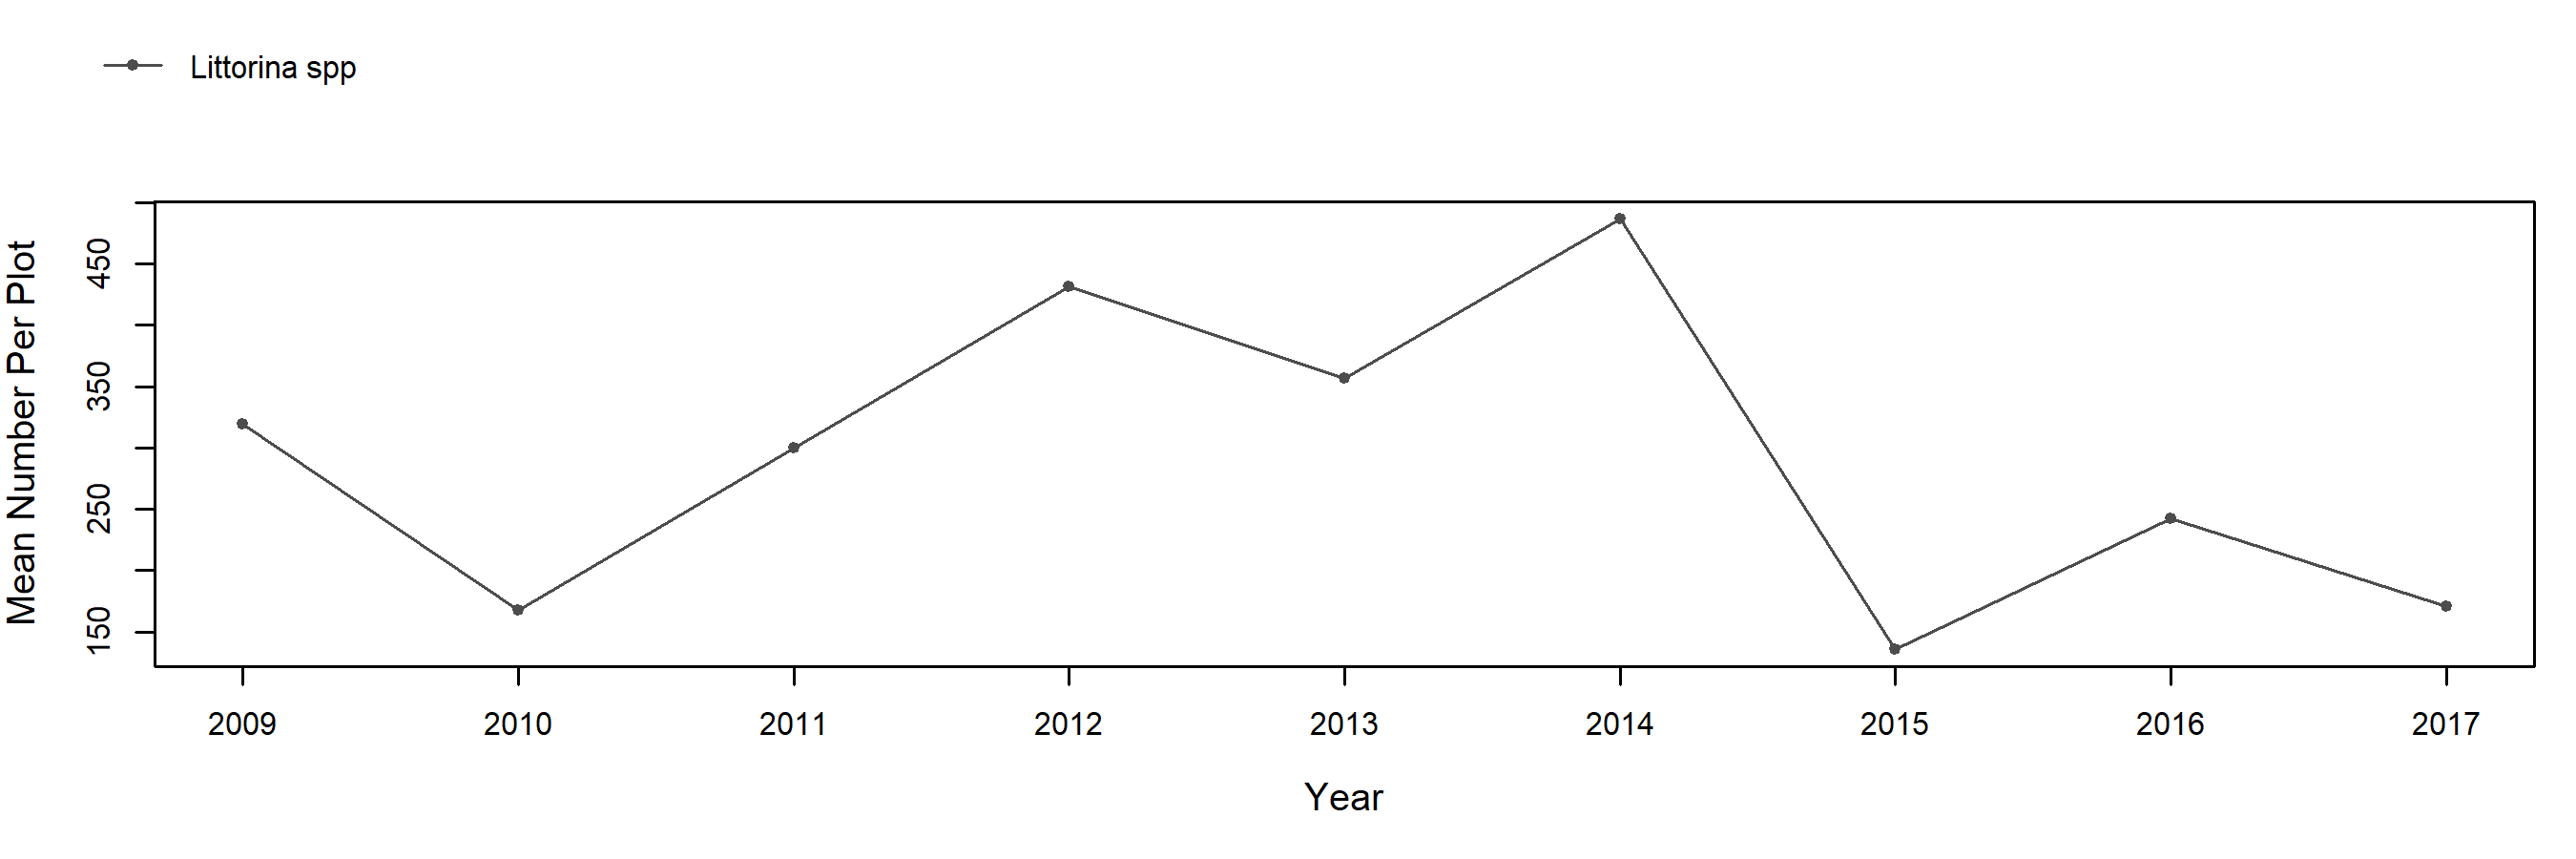
Chthamalus/Balanus (Acorn Barnacles) – motile invertebrate counts
Mytilus (California Mussel) – percent cover
Mytilus (California Mussel) – motile invertebrate counts
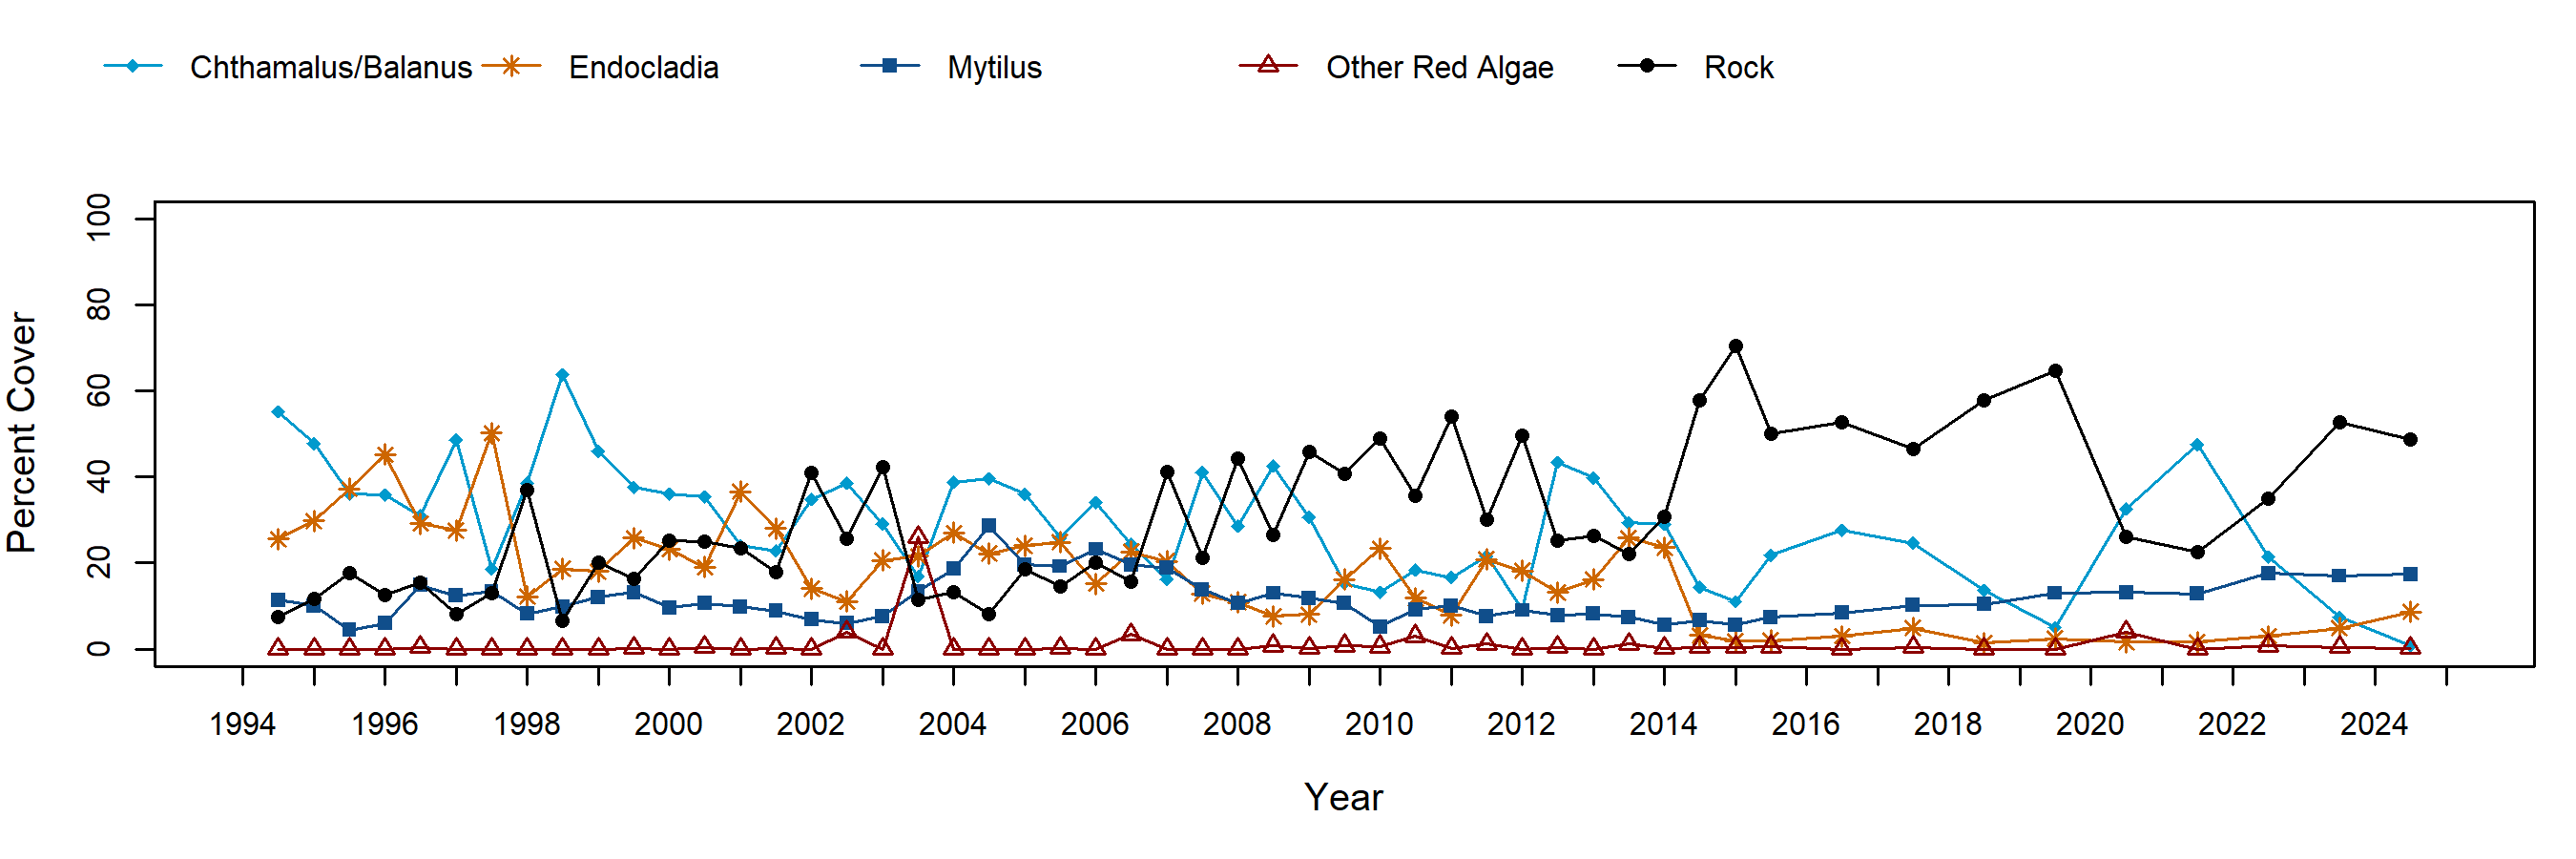
Endocladia (Turfweed) – percent cover
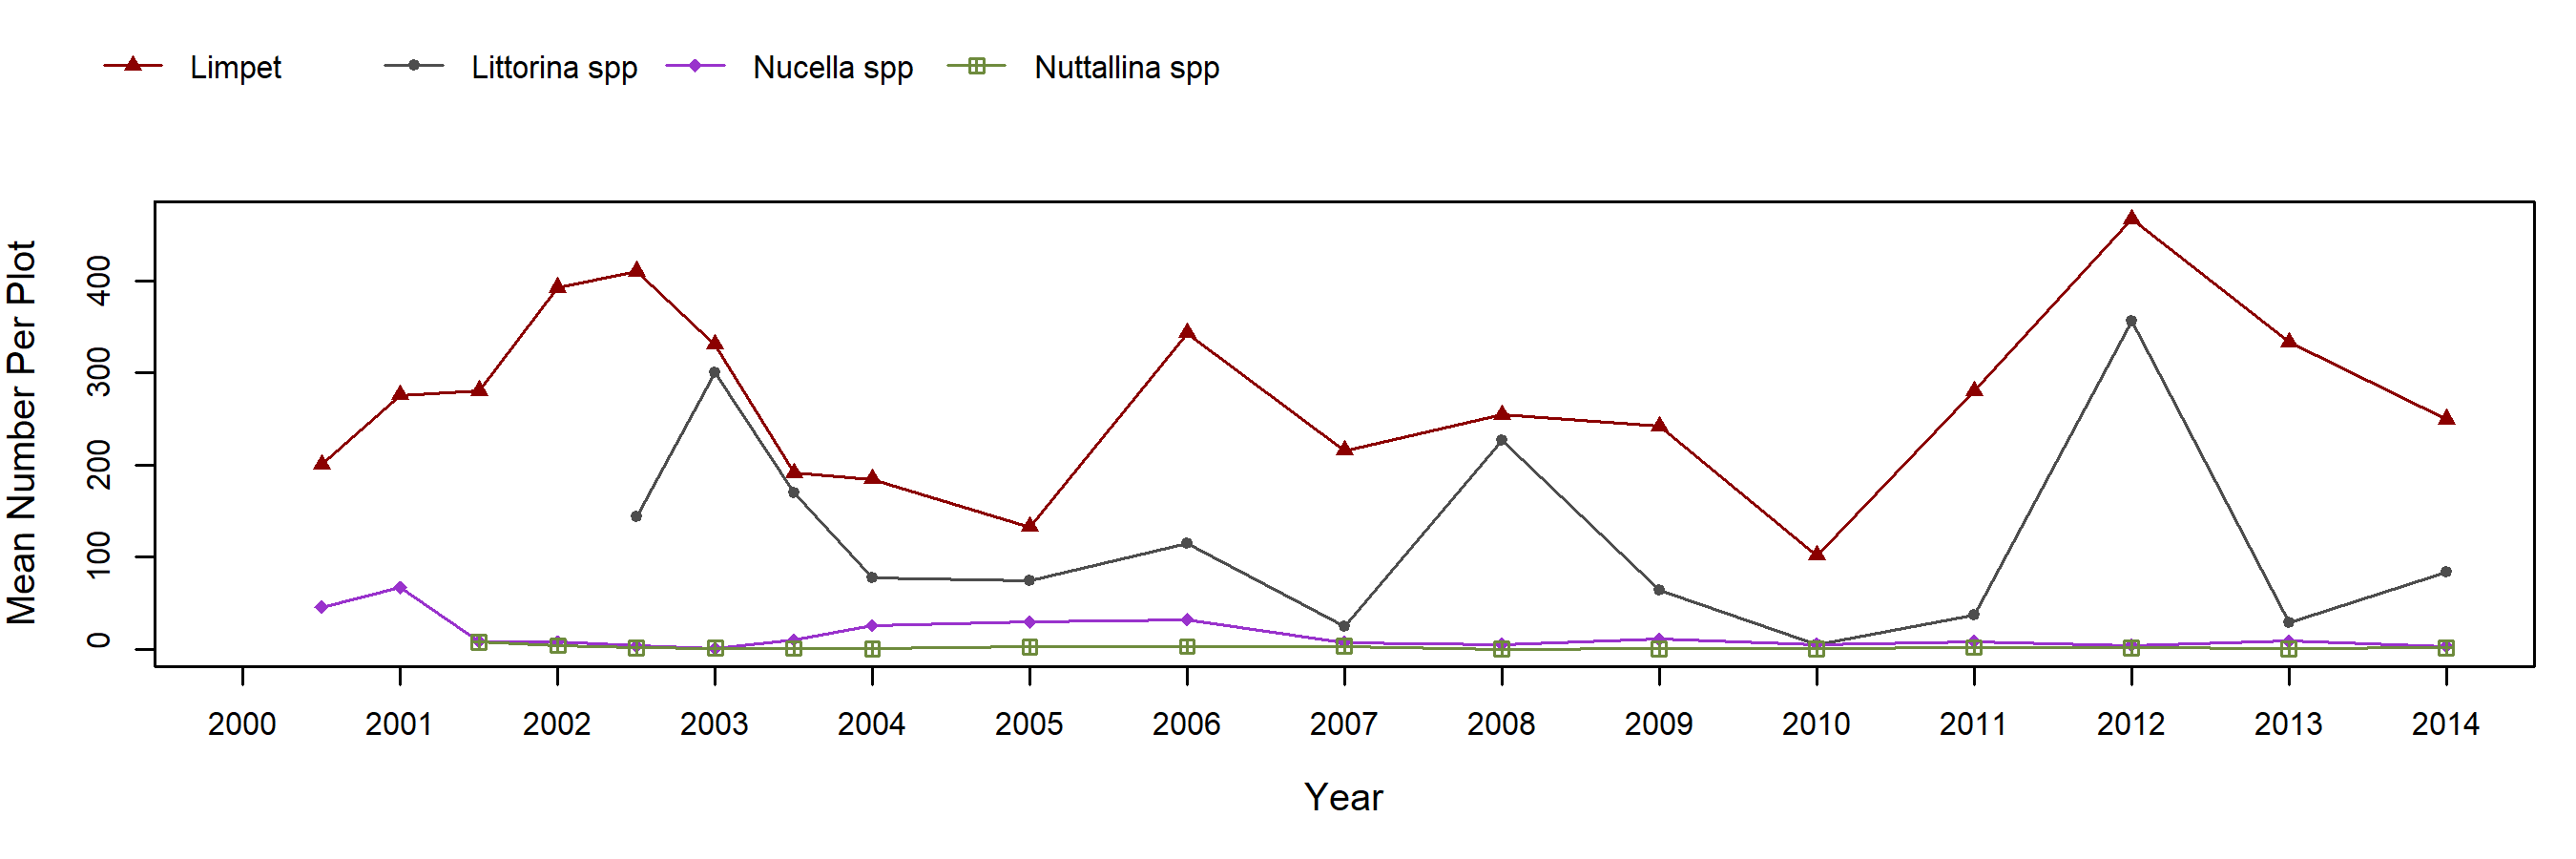
Endocladia (Turfweed) – motile invertebrate counts
Rock (Above Barnacles) – percent cover
Rock (Above Barnacles) – motile invertebrate counts
Species Counts and Sizes

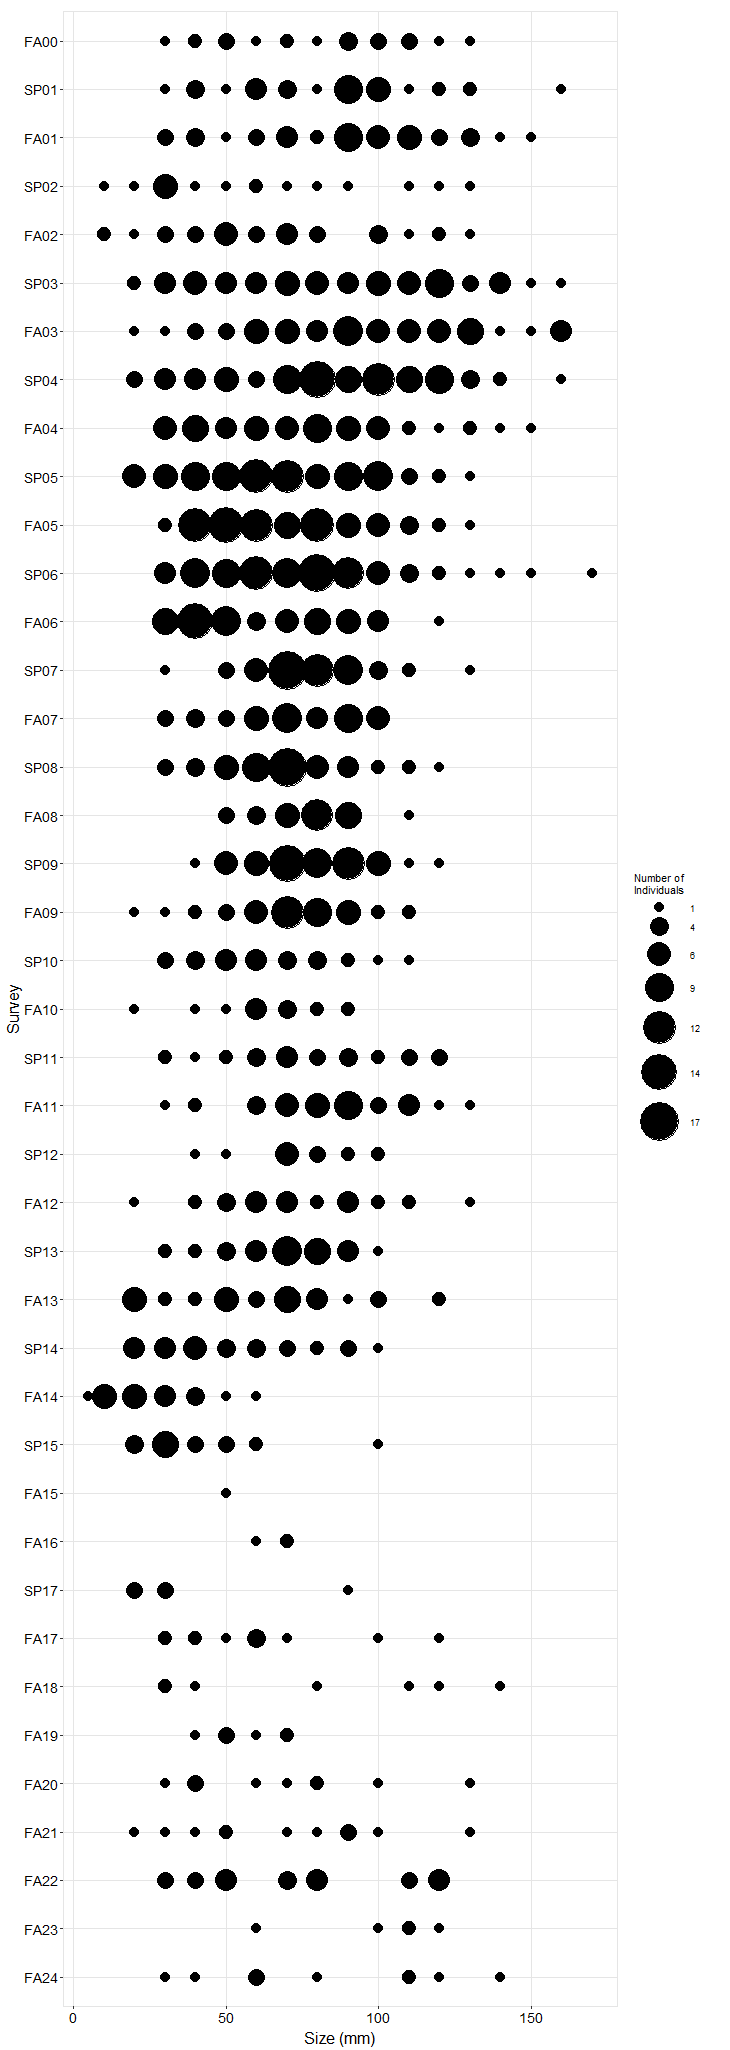
Species Counts and Sizes (where recorded) for Pisaster are shown below for this site. At some sites, other sea star species and Katharina are counted in addition to Pisaster. The sum of all individuals across all plots is displayed. Note that data gaps are represented by breaks in long-term count trend lines, but are not shown in size plots.
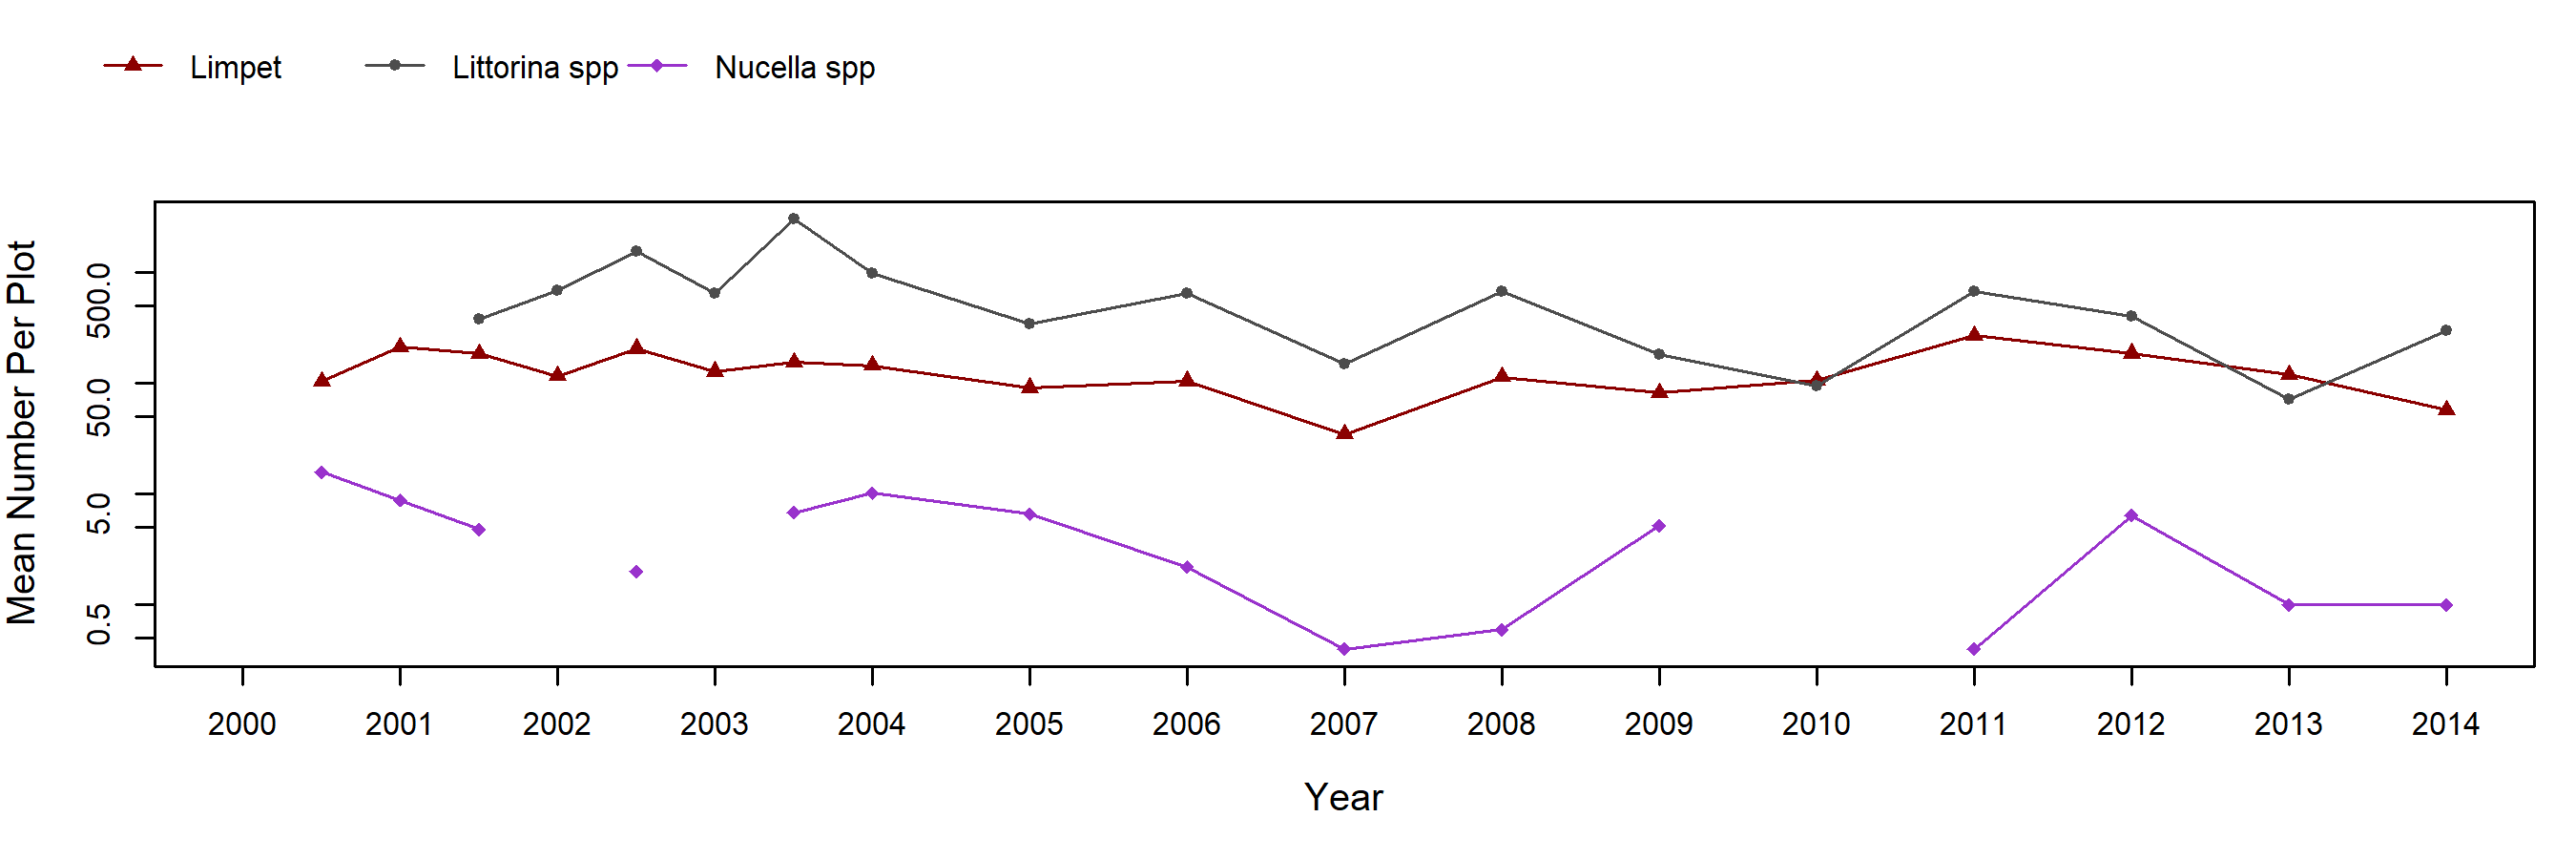
Pisaster ochraceus (Ochre Star) – counts
Pisaster ochraceus (Ochre Star) – sizes