Long-Term Monitoring Trend Graphs
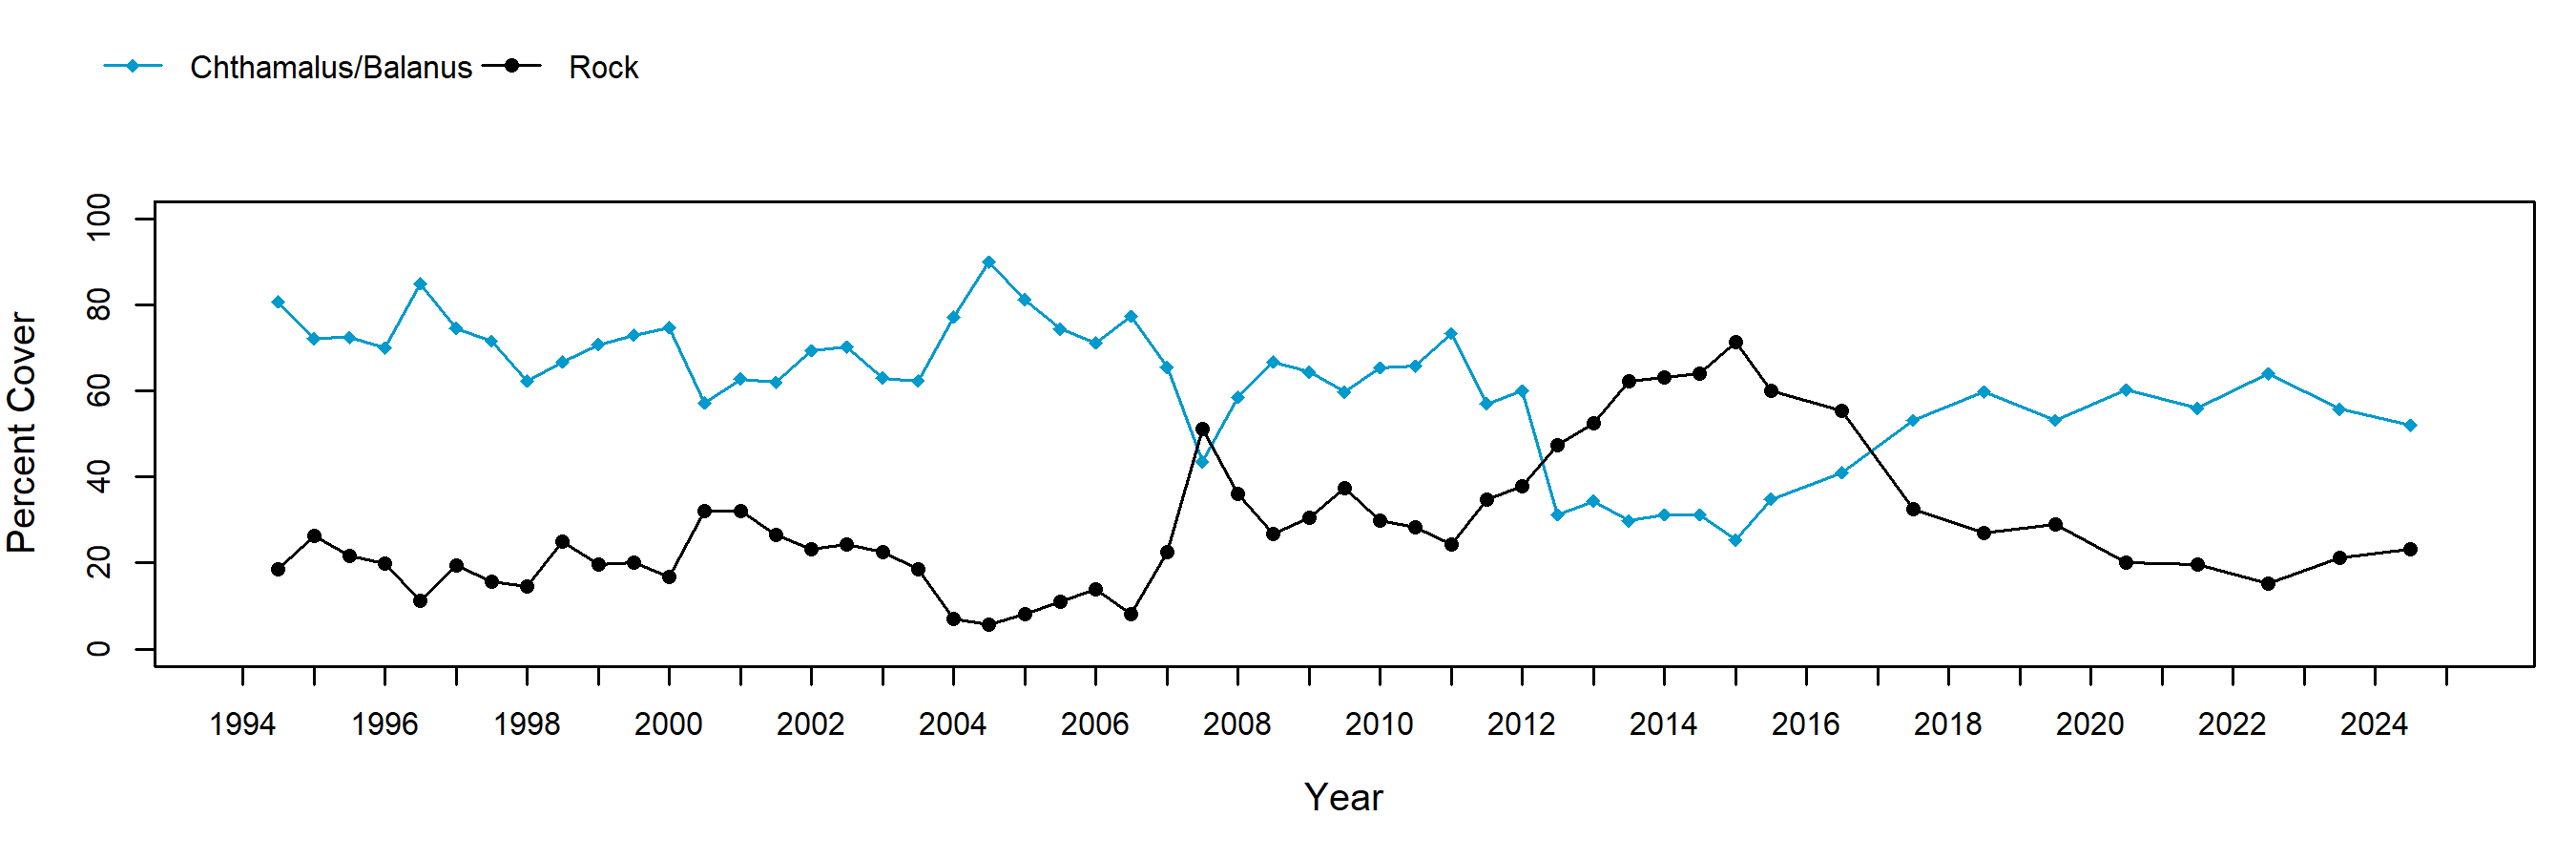
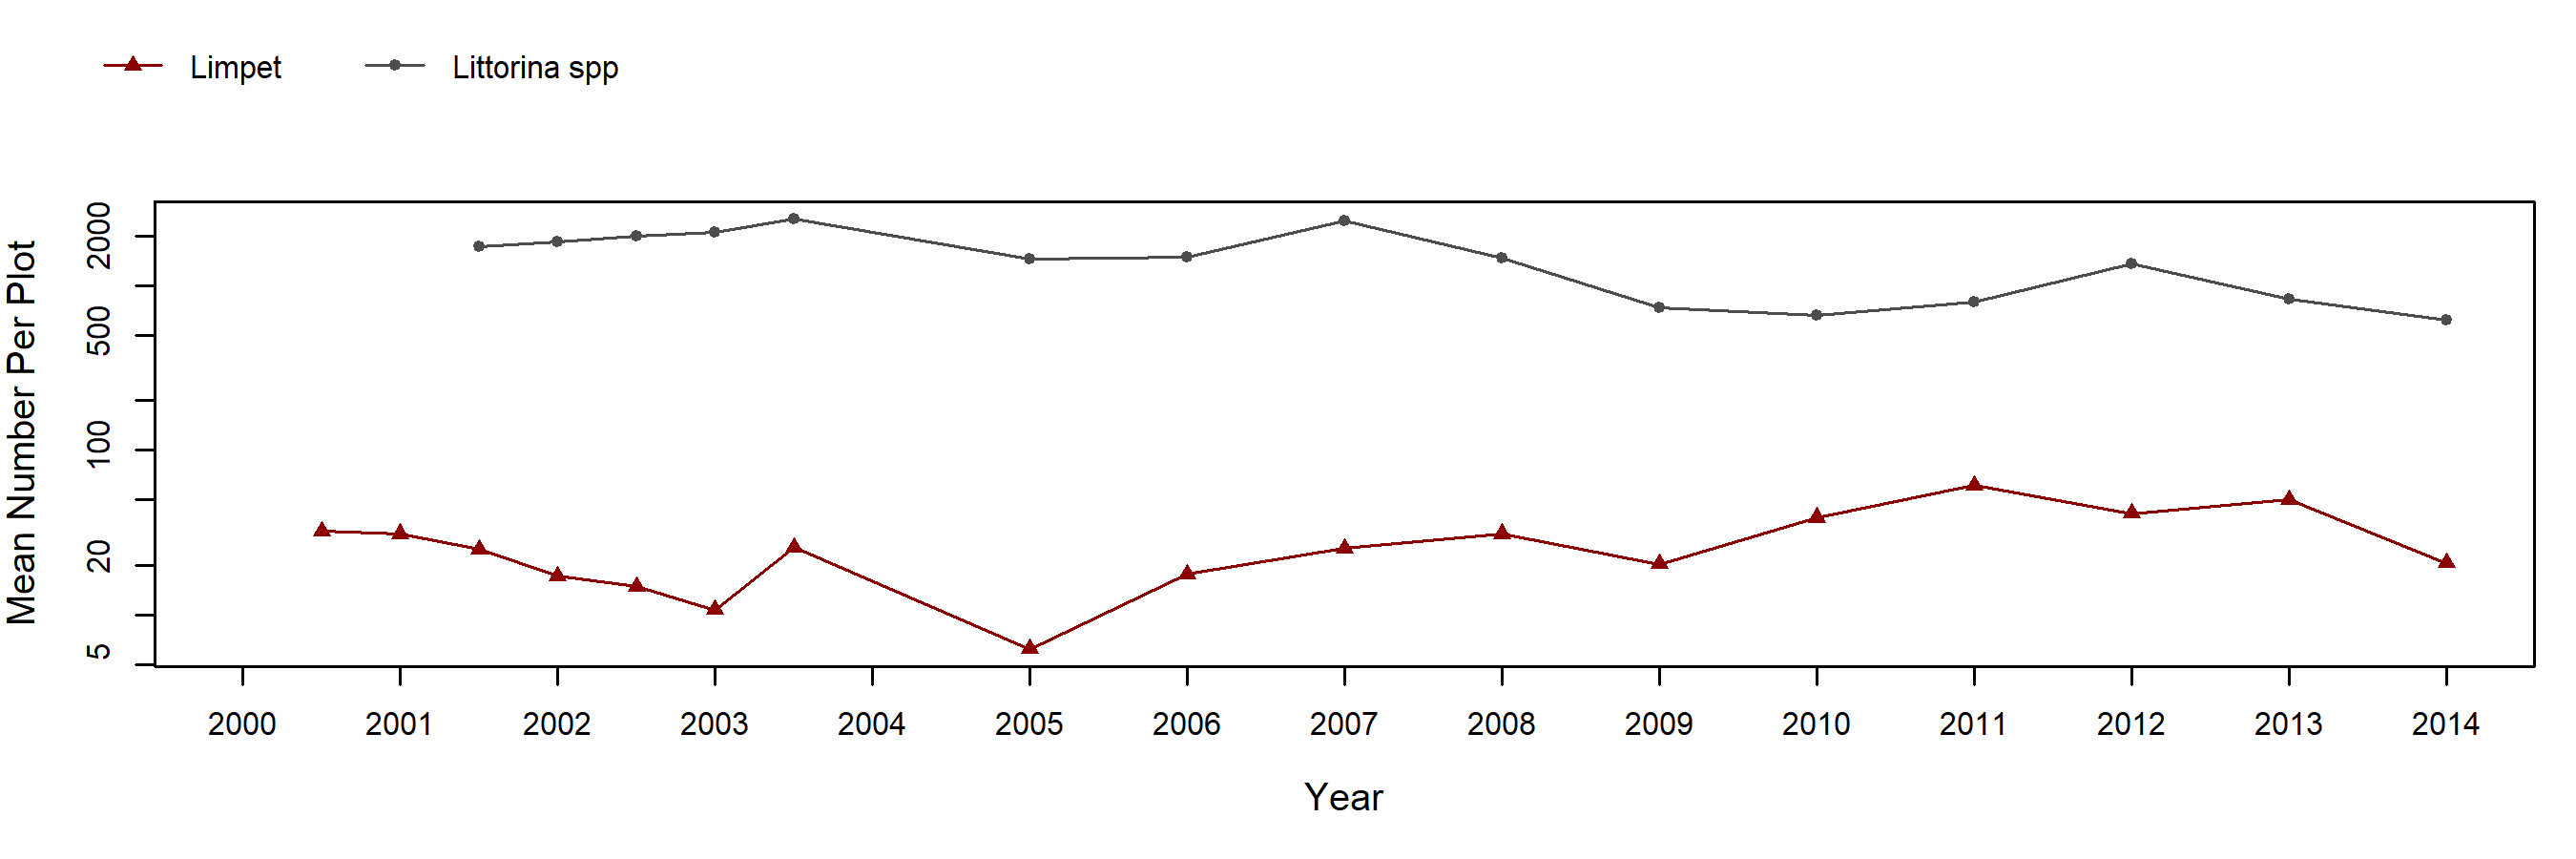
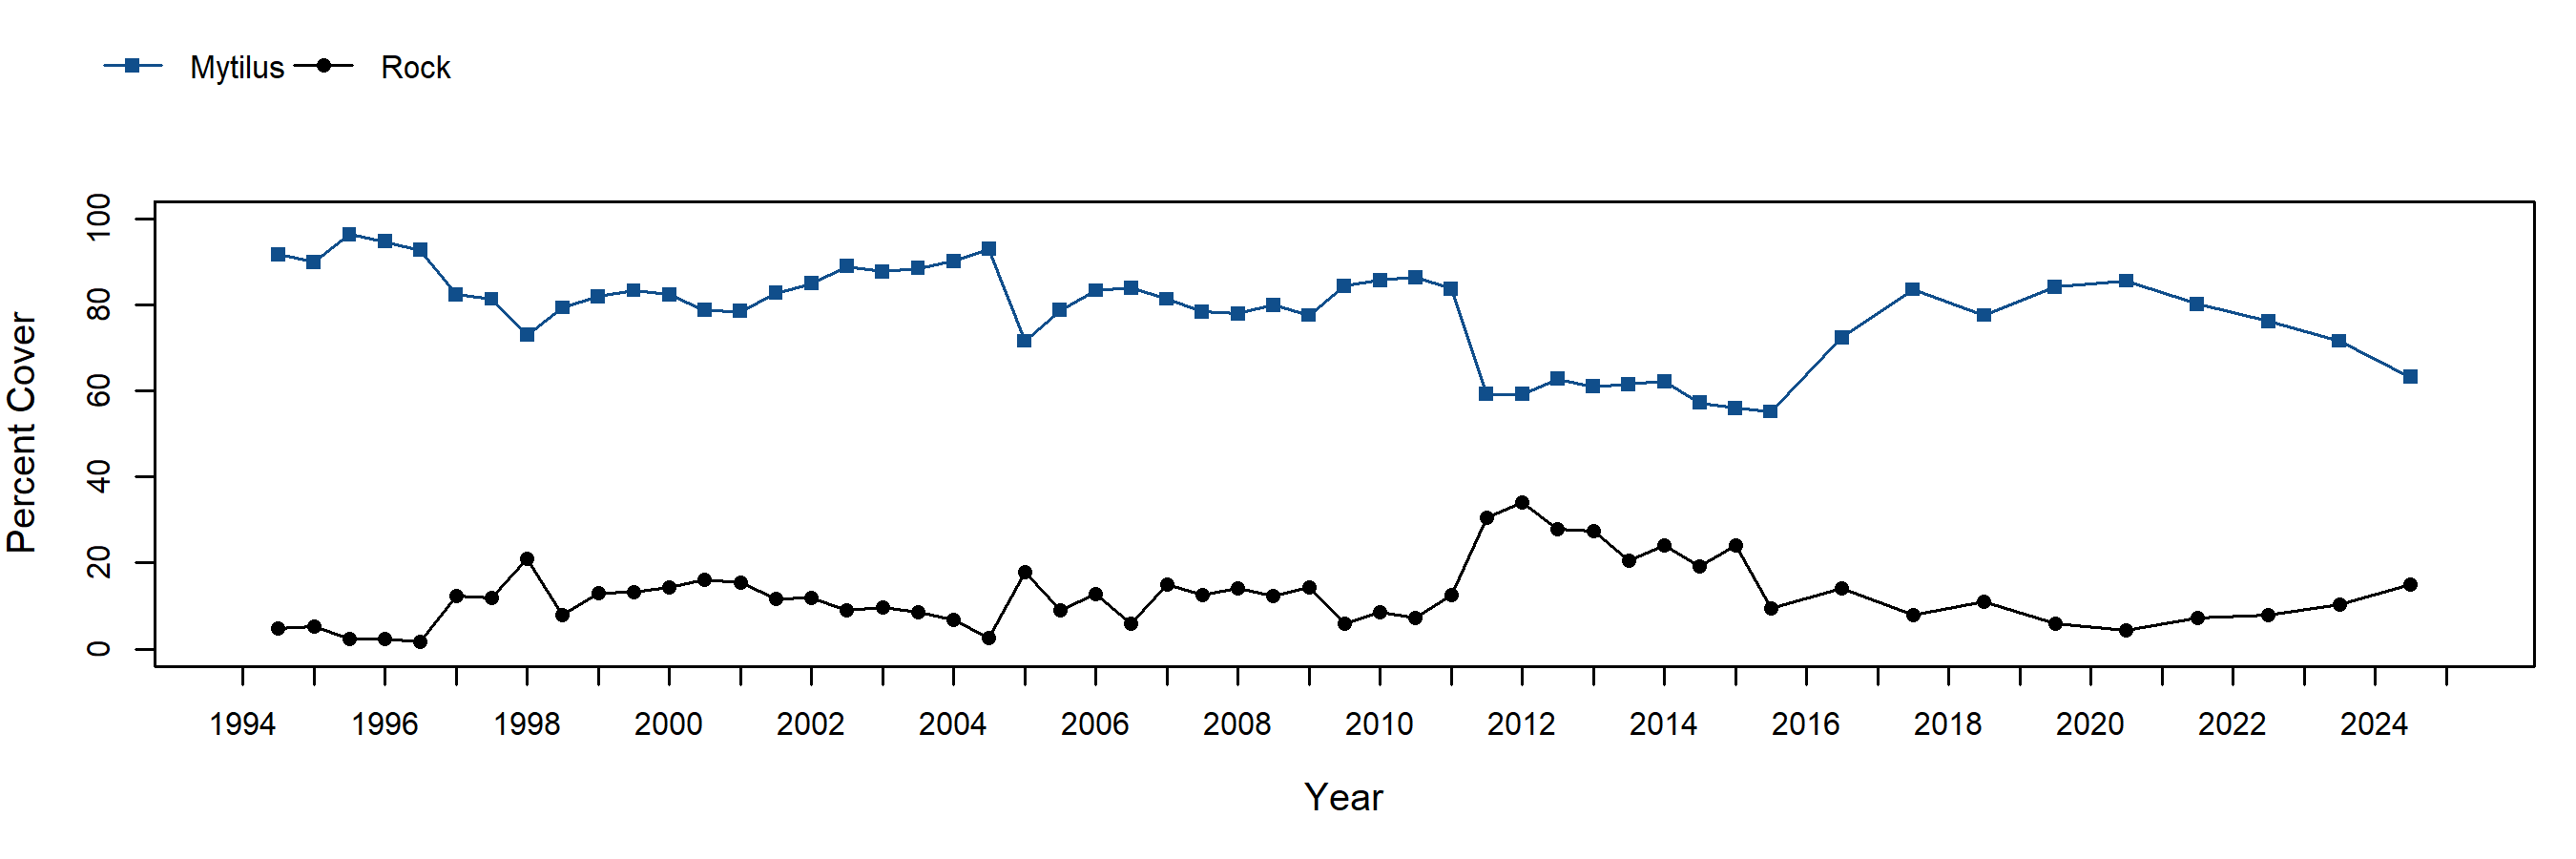
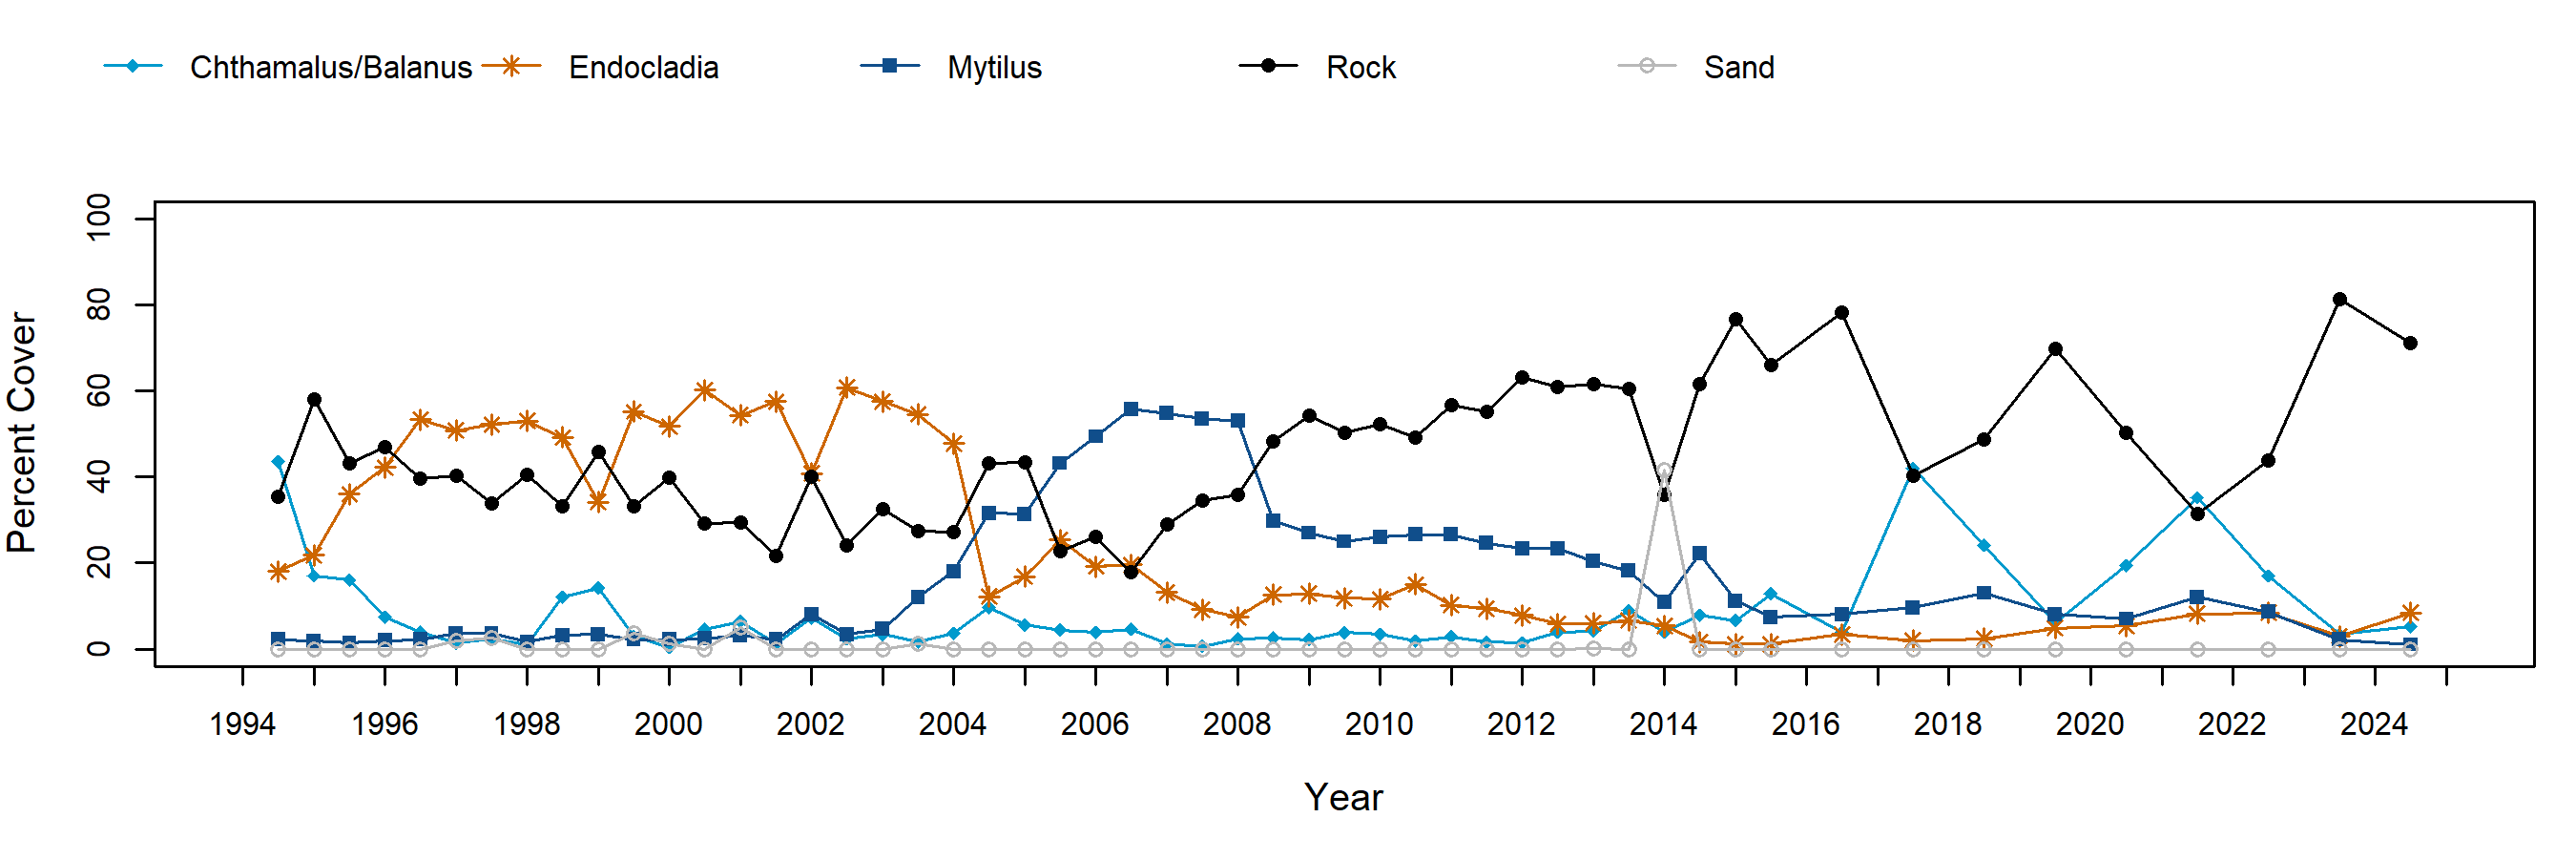
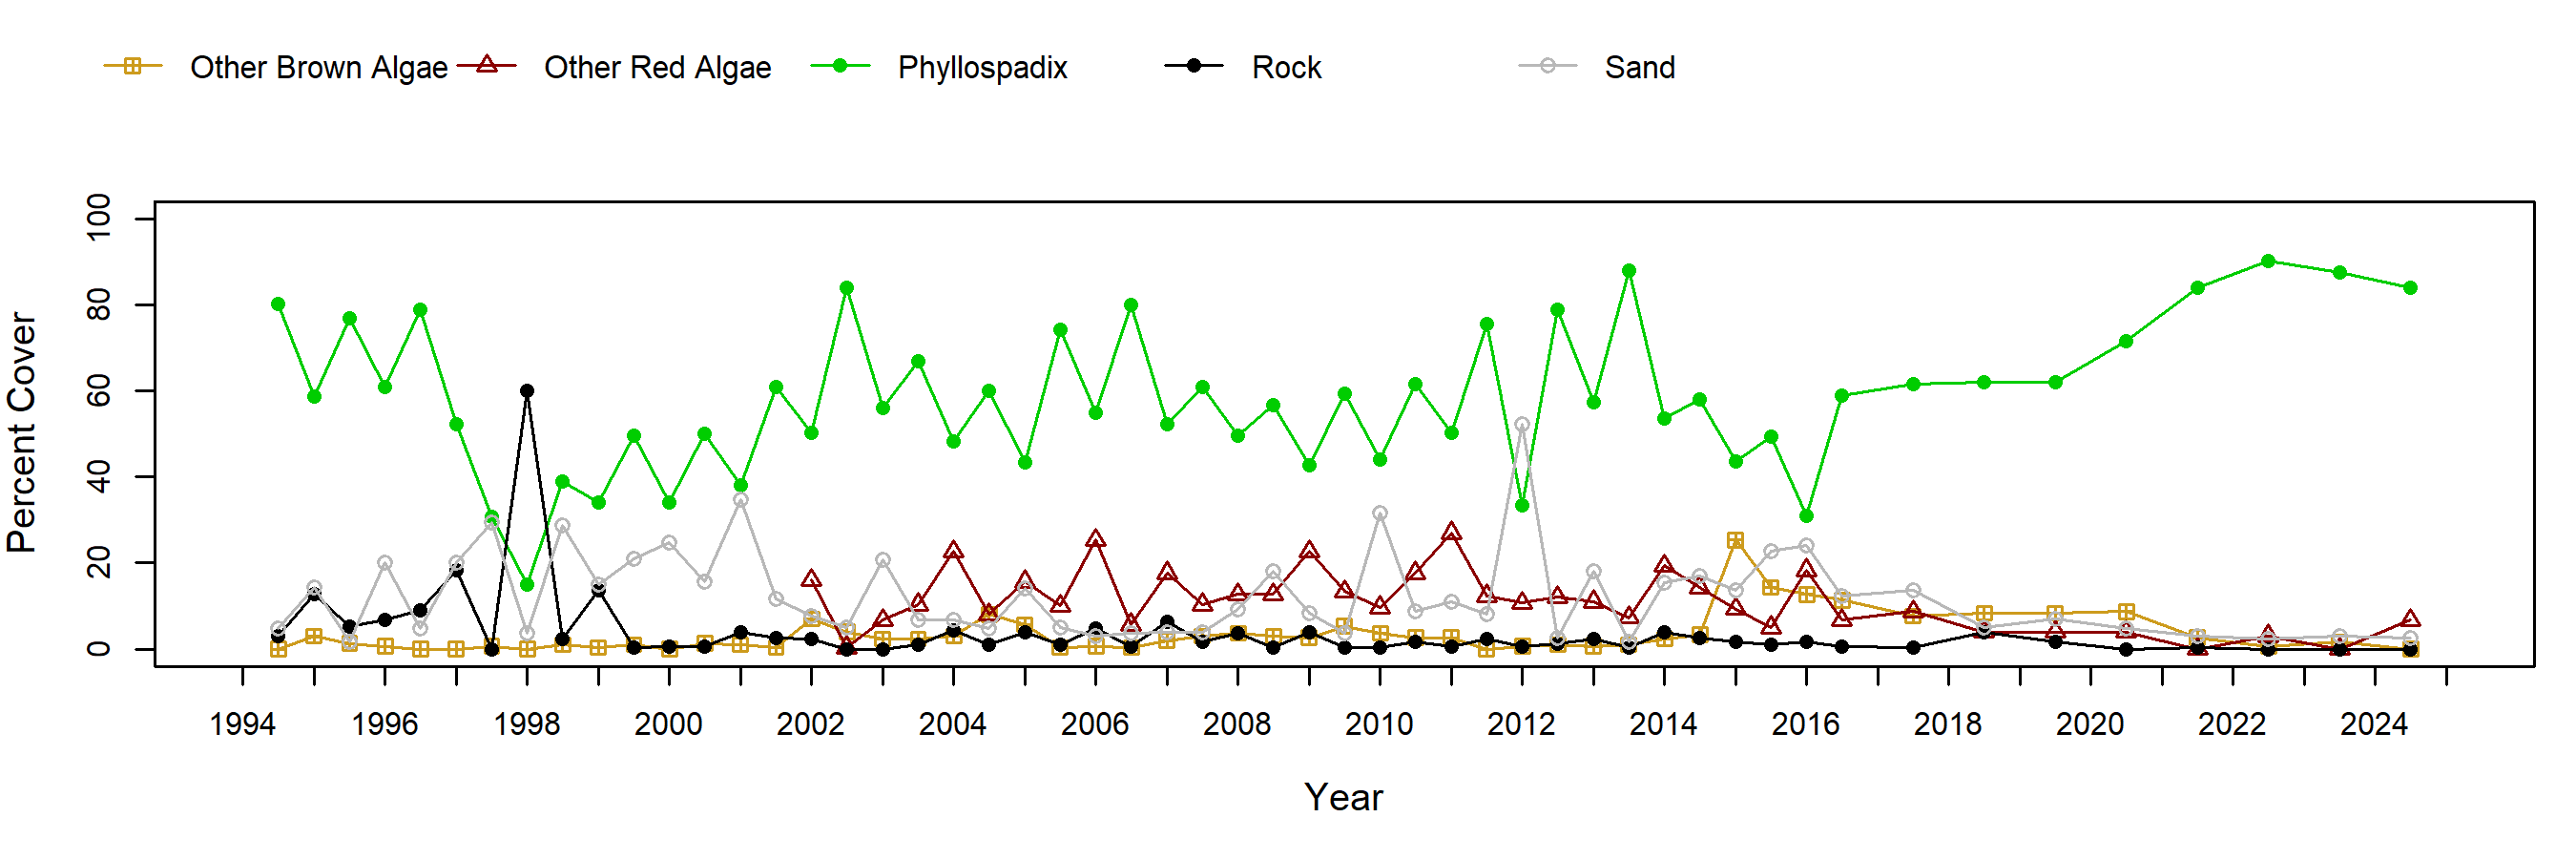
Chthamalus/Balanus barnacle plots at Paradise Cove consist of a mixture of Chthamalus dalli/fissus (note that species were not distinguished until 2001) and Balanus glandula, with the former being the overwhelming dominant component. Barnacle cover has varied widely over time, and has generally varied inversely with bare rock cover. Within the barnacle plots, littorine snails were highly abundant, varying among seasons from approximately 1,000 to 2,000 individuals per plot. Percent cover of Mytilus in mussel plots has been fairly stable throughout the years. Not evident in the trend graph are changes in the size and depth of the mussel bed that have occurred throughout the years. For example, in 2006, a line of advancing sea stars just below photoplots caused the mussels to move and pile up on one another, changing a tight monolayer to a loose multi-layered bed. As sea star numbers declined, the mussel bed returned to a dense monolayer. Endocladia turfweed plots have been dynamic with Endocladia, barnacles, mussels, and bare rock being dominant during certain periods. Littorine snails were abundant initially in these plots (~140 individuals per plot), but declined afterward in the range of 20-50 individuals per plot, except a short increase in spring 2008. Phyllospadix surfgrass transect sampling revealed relatively consistent seasonal variation, with higher cover in fall than in spring (note that spring sampling ended in 2016). Sand cover was variable over time, with a peak of 50% in spring 2012, concurrent with a notable decline in Phyllospadix. The surfgrass decline may be attributed to burial by sand. Red algae cover exhibited a weak pattern of inverse seasonal trends to that observed for Phyllospadix.
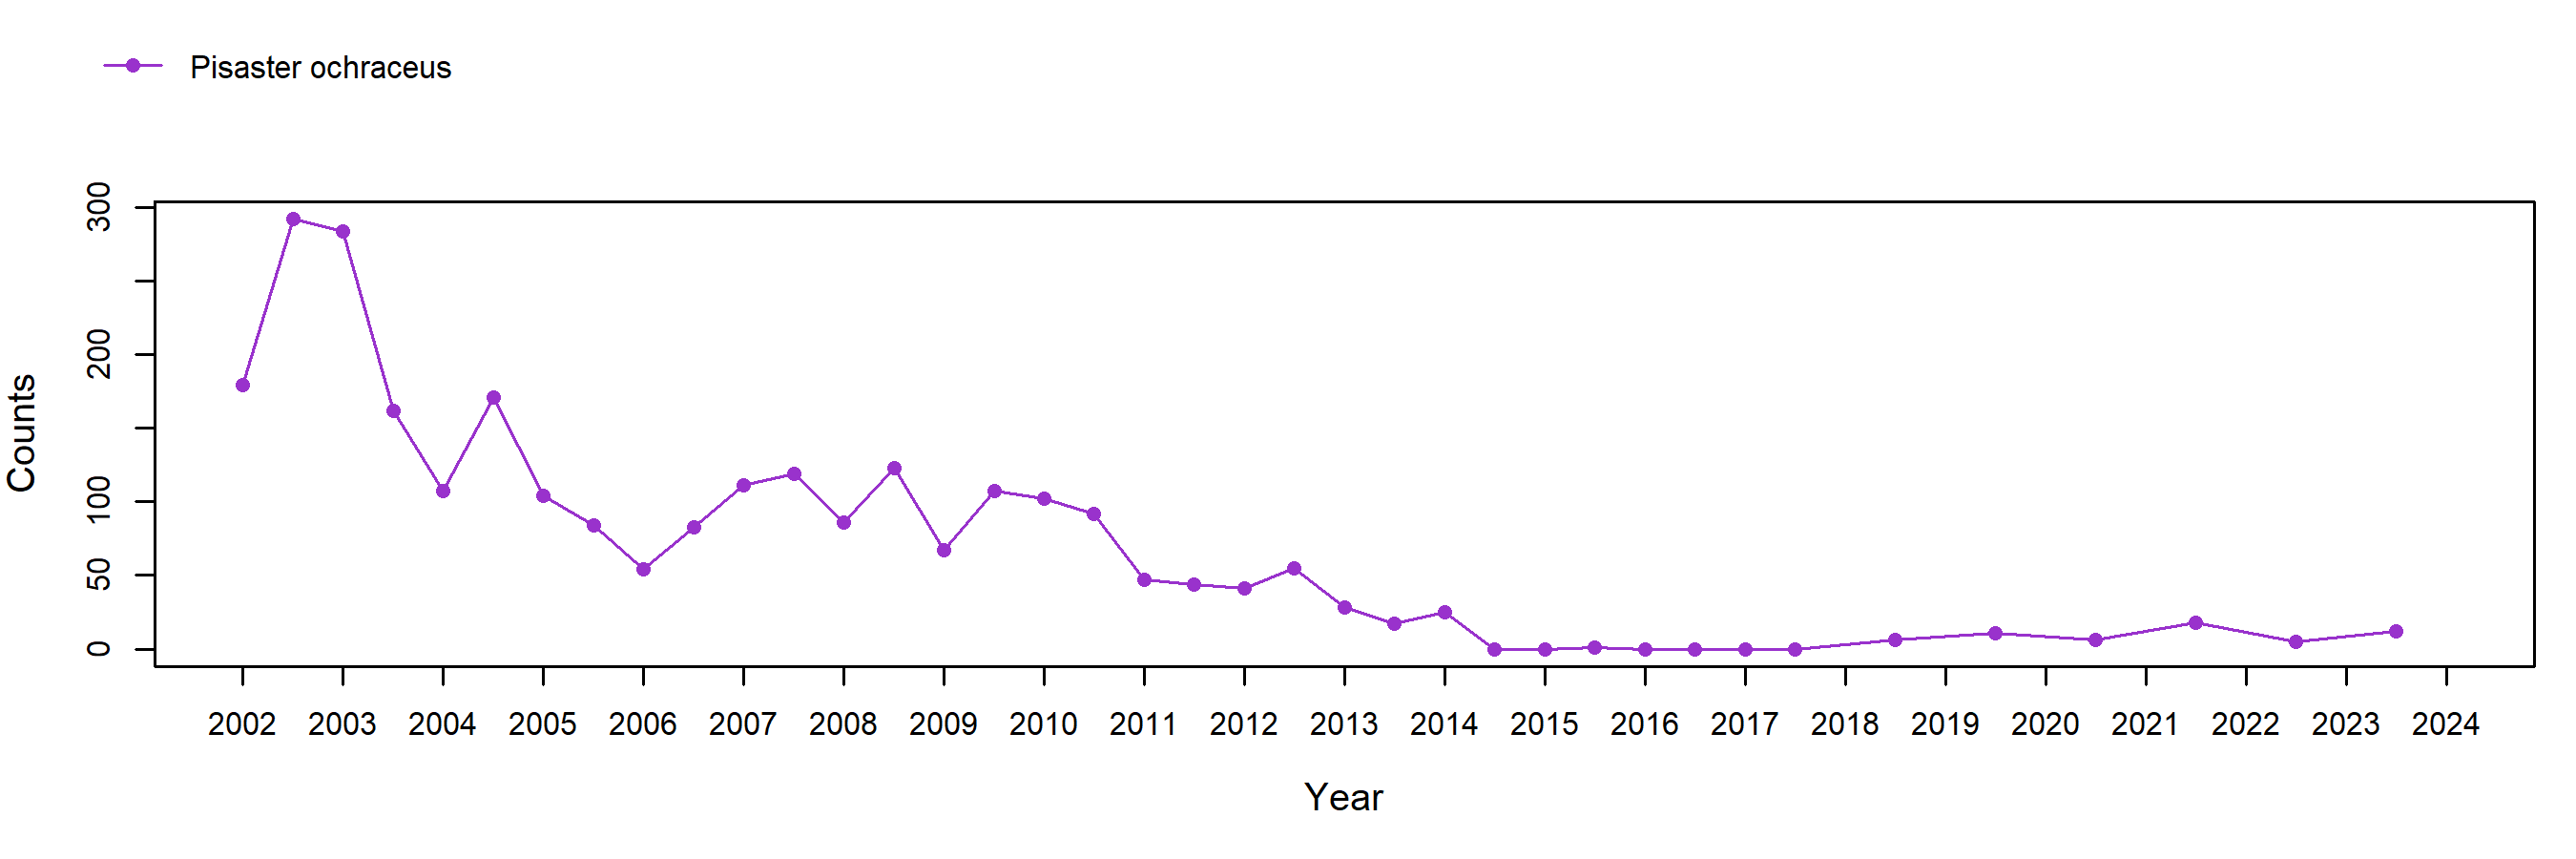
Sea star (Pisaster ochraceus) plots were added to this site in spring 2002 and consist of three large irregular plots surrounding an area of medium relief rock and shallow tidepools. Initially, sea stars were abundant, but then experienced a decline. While Sea Star Wasting Syndrome had devastated sea star populations south of the Santa Monica Bay by the fall of 2013, this site in the northern bay had remained disease free until spring 2014. During regular sampling in early March of spring 2014, sea star numbers were similar to the previous season. However, two diseased sea stars were found, including one with missing arms. Sea star plots were resampled in late March, and no sea stars were found in plots or at the site, likely succumbing to a sitewide disease outbreak. Sea stars were absent from fall 2014 to spring 2018, with exception of one individual in fall 2015. A few individuals were found in fall 2018, all of small size (<50 mm). While smaller (<50mm radius) stars were common at this site throughout the years, most individuals counted prior to Sea Star Wasting Syndrome were larger than 70mm. Numbers of sea stars at Paradise Cove remain low as of fall 2024.
In order to standardize species resolution across all MARINe groups and over time, some species (typically rare) were lumped for graphical presentation of Long-Term monitoring data. See lumped categories for definitions (some variation occurs between methods and over time).
If you experience any barriers accessing the trend graphs below, please contact (pacificr@ucsc.edu) for help.
Photo Plots

Below are the trends observed for each Photo Plot target species at this site. Long-Term percent cover trend graphs also include any species that reached a minimum of 25% cover during any single point in time within a given target species assemblage. Breaks in trend lines represent missed sampling events. For additional species observed that did not meet this 25% threshold, please use the Graphing Tool.
Chthamalus/Balanus (Acorn Barnacles) – percent cover
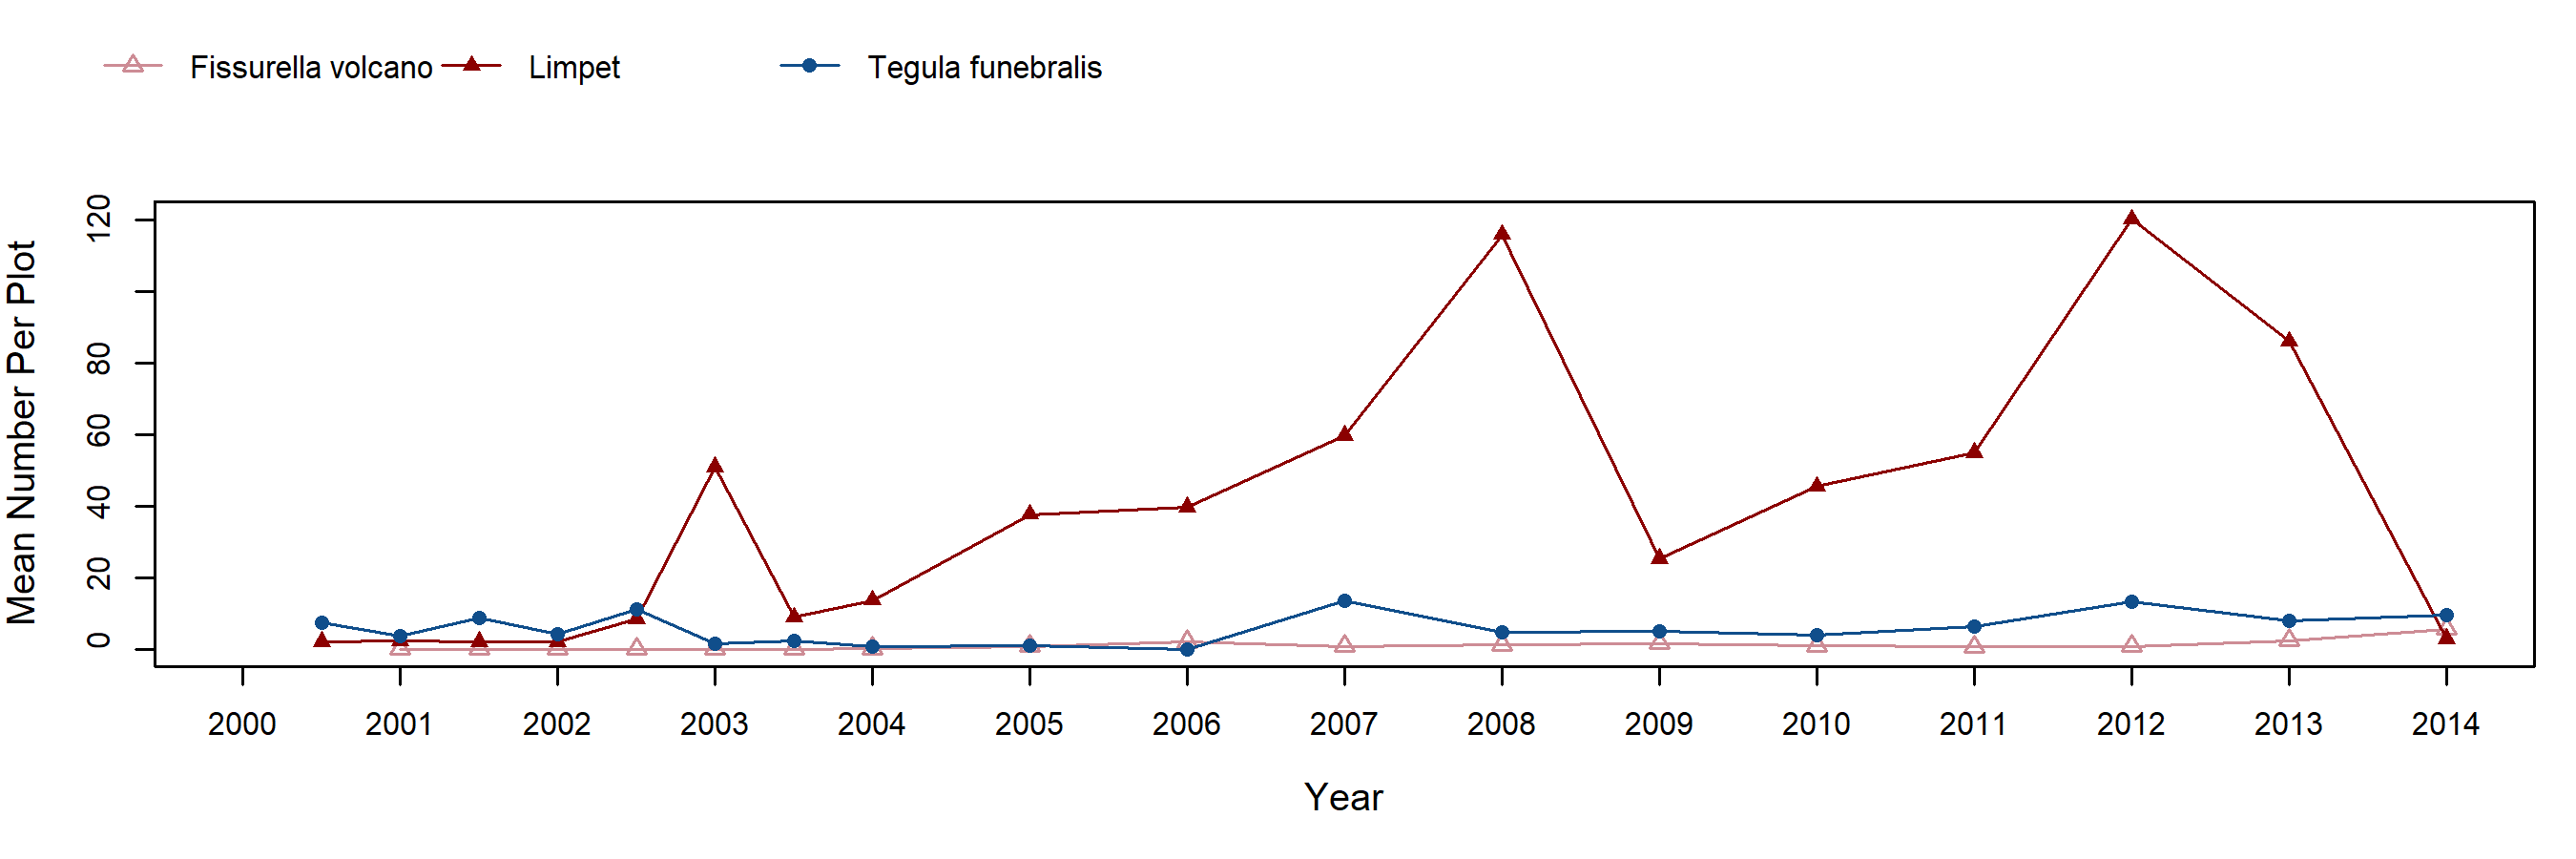
Chthamalus/Balanus (Acorn Barnacles) – motile invertebrate counts
Mytilus (California Mussel) – percent cover
Mytilus (California Mussel) – motile invertebrate counts
Endocladia (Turfweed) – percent cover
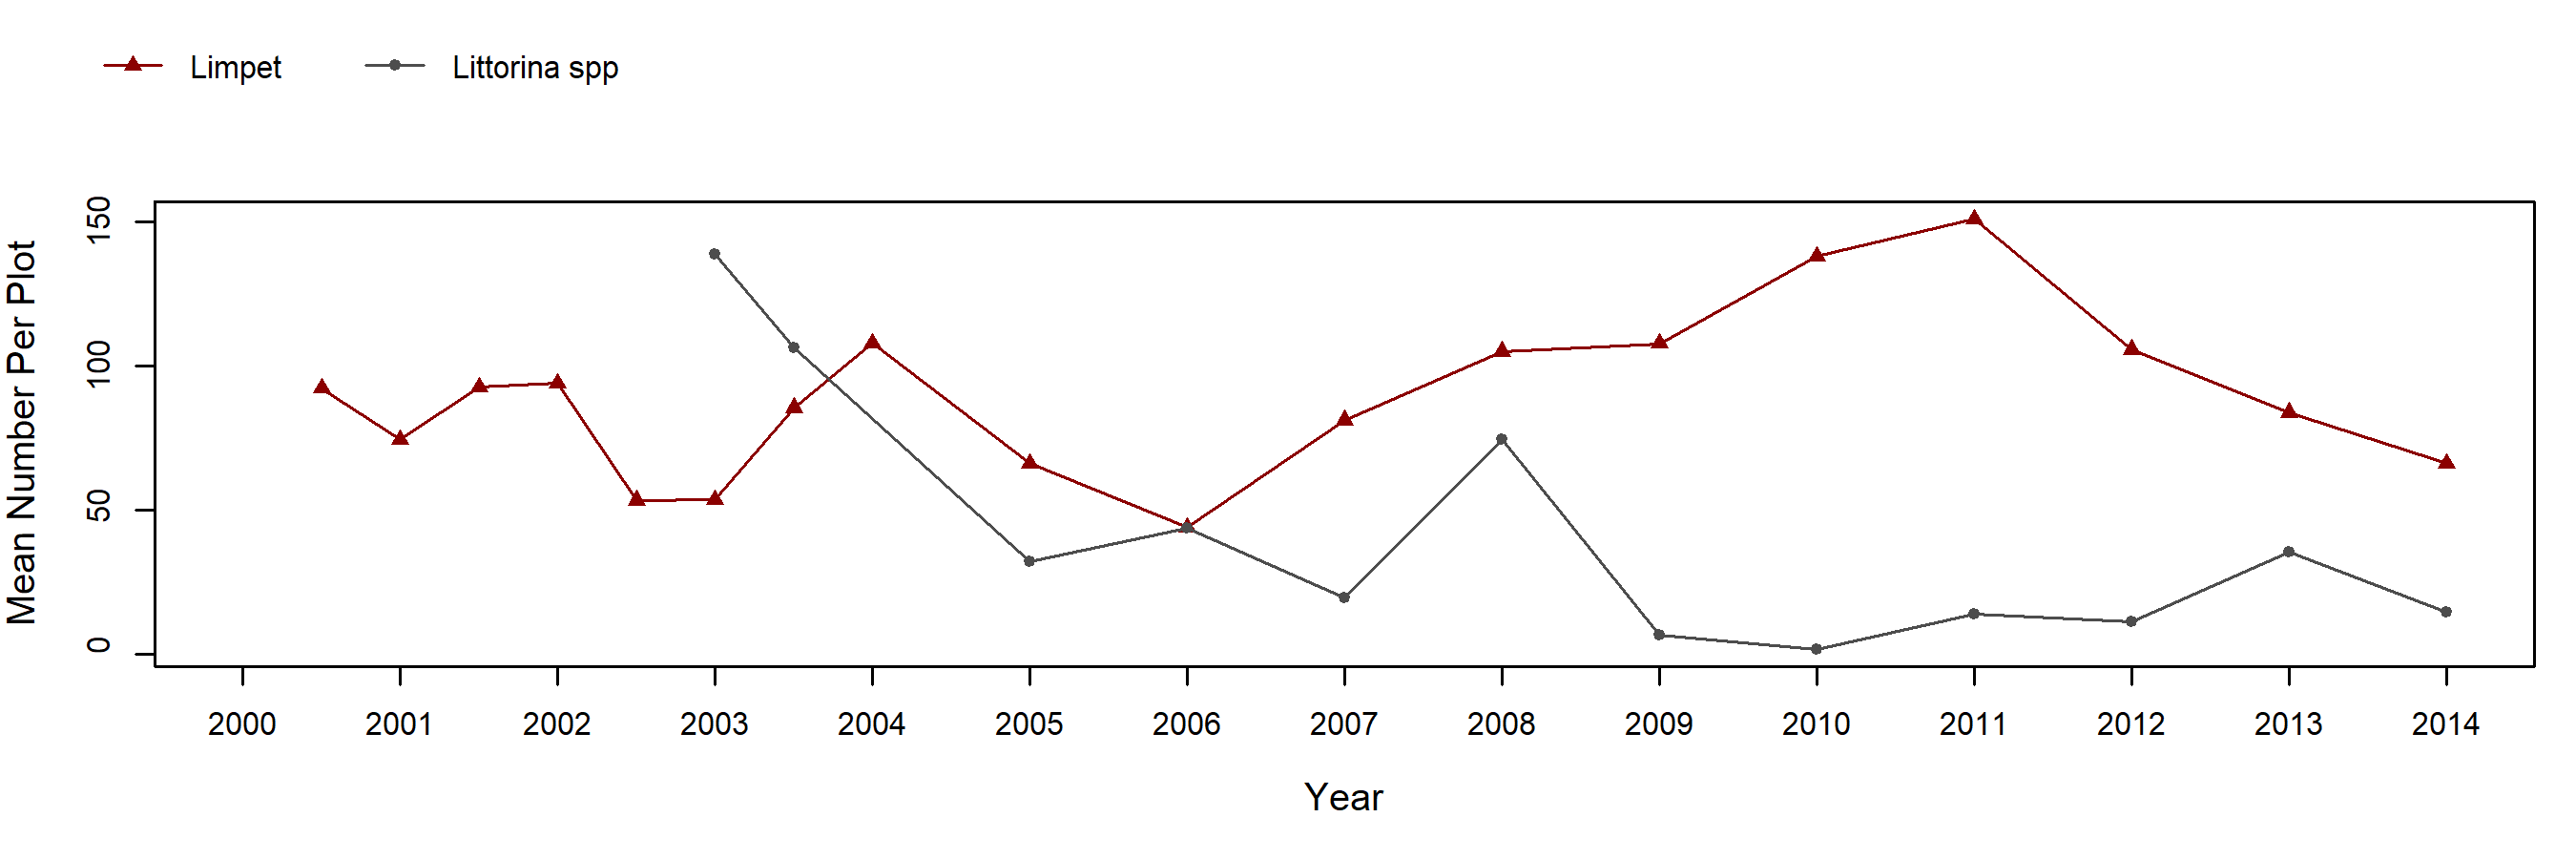
Endocladia (Turfweed) – motile invertebrate counts
Transects

Below are the trends observed for each Transect target species at this site. Long-Term trend graphs also include any species that reached a minimum of 25% cover during any single point in time within a given target species assemblage. Breaks in trend lines represent missed sampling events.
Phyllospadix (Surfgrass)
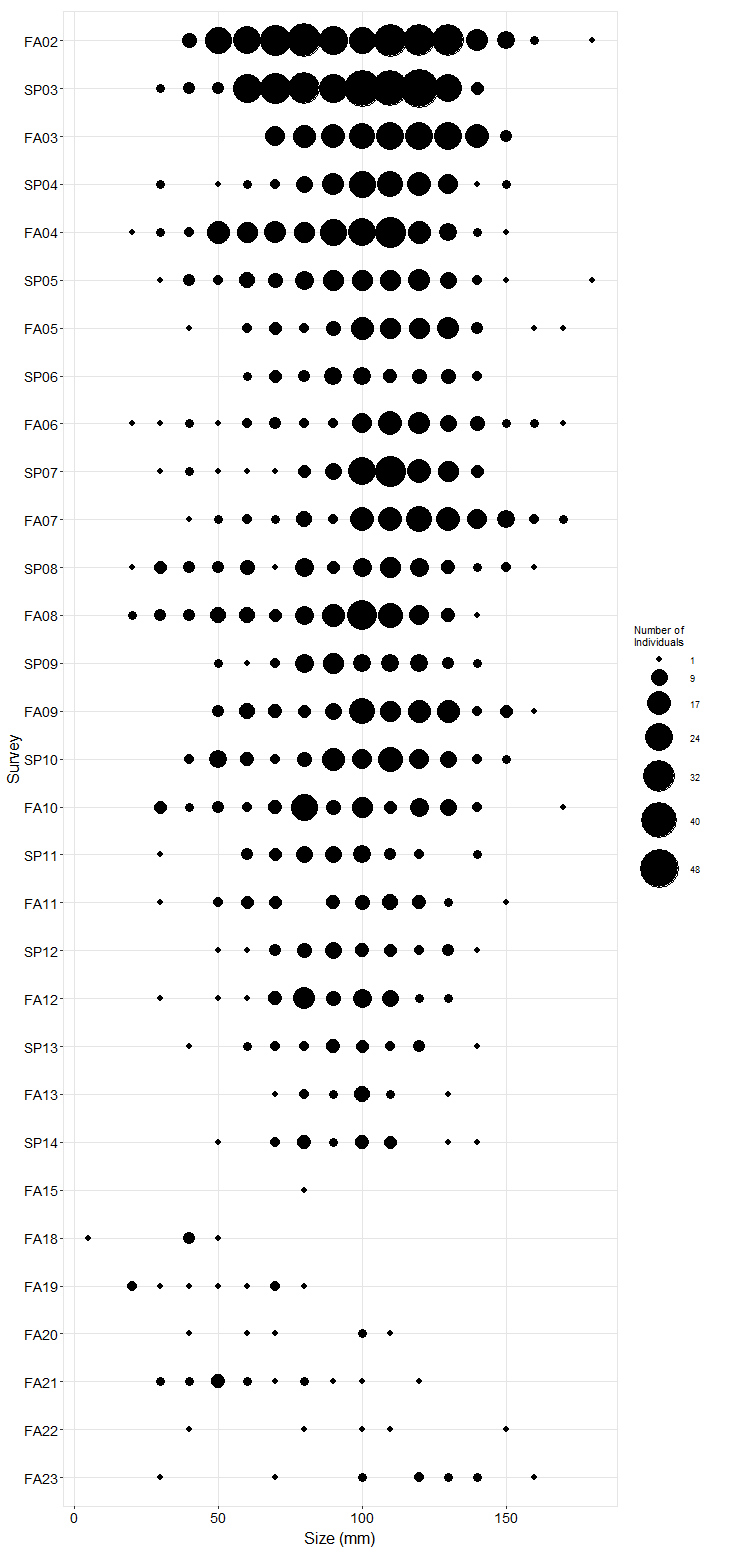
Species Counts and Sizes

Species Counts and Sizes (where recorded) for Pisaster are shown below for this site. At some sites, other sea star species and Katharina are counted in addition to Pisaster. The sum of all individuals across all plots is displayed. Note that data gaps are represented by breaks in long-term count trend lines, but are not shown in size plots.
Pisaster ochraceus (Ochre Star) – counts
Pisaster ochraceus (Ochre Star) – sizes