Complete species lookup table (including general taxonomic group name and common name, if available) of ALL species observed during the Biodiversity Surveys (at all sites).
If you experience any barriers accessing the trend graphs below, please contact (pacificr@ucsc.edu) for help.
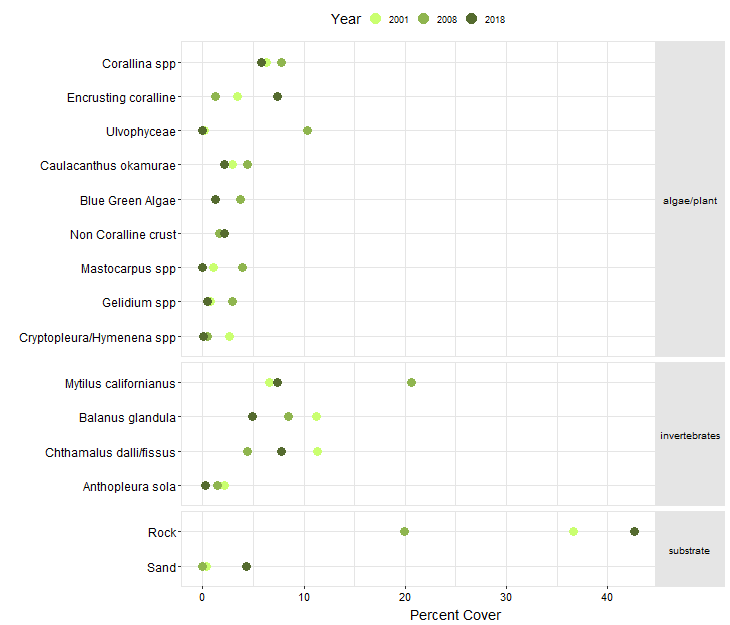
Point Contact Surveys

The graph below shows the percent cover of the most common species (>2% cover, first points only, for at least one sample) observed during the Point Contact Surveys at this site. Note that at sites where a modified protocol was done for 1 or more survey events, the data were not included unless a modified protocol was the only survey type ever done at the site.
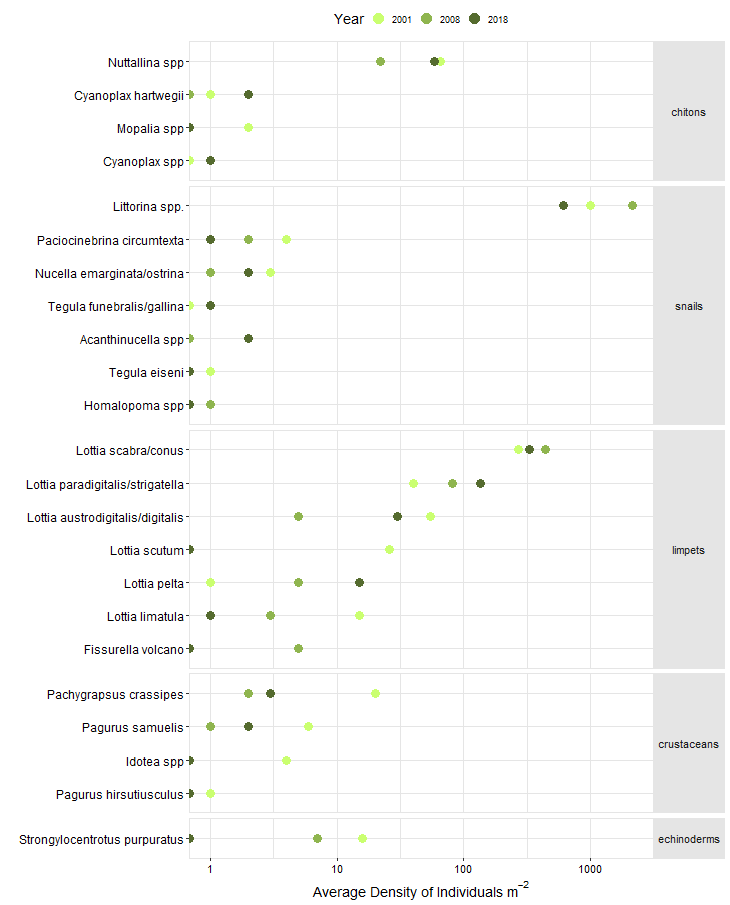
Quadrat Surveys

The graph below shows densities of common mobile species observed (>0.1 per m2 for at least one sample; note logarithmic scale) during the Quadrat Surveys at this site.
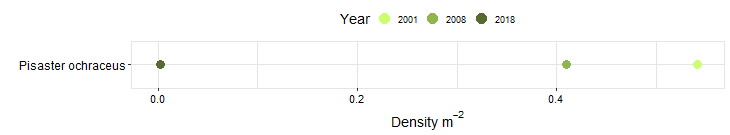
Swath Surveys

The graph below shows densities of larger mobile invertebrate species (sea stars, Cryptochiton, lobsters, etc.) observed during the Swath Surveys at this site.
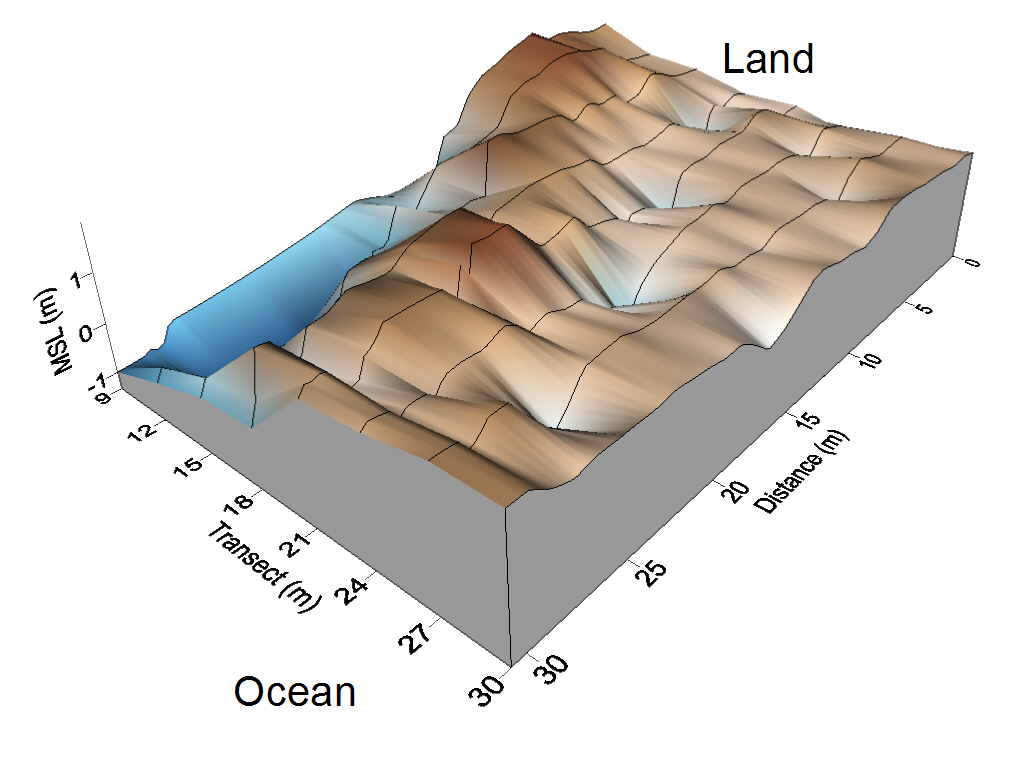
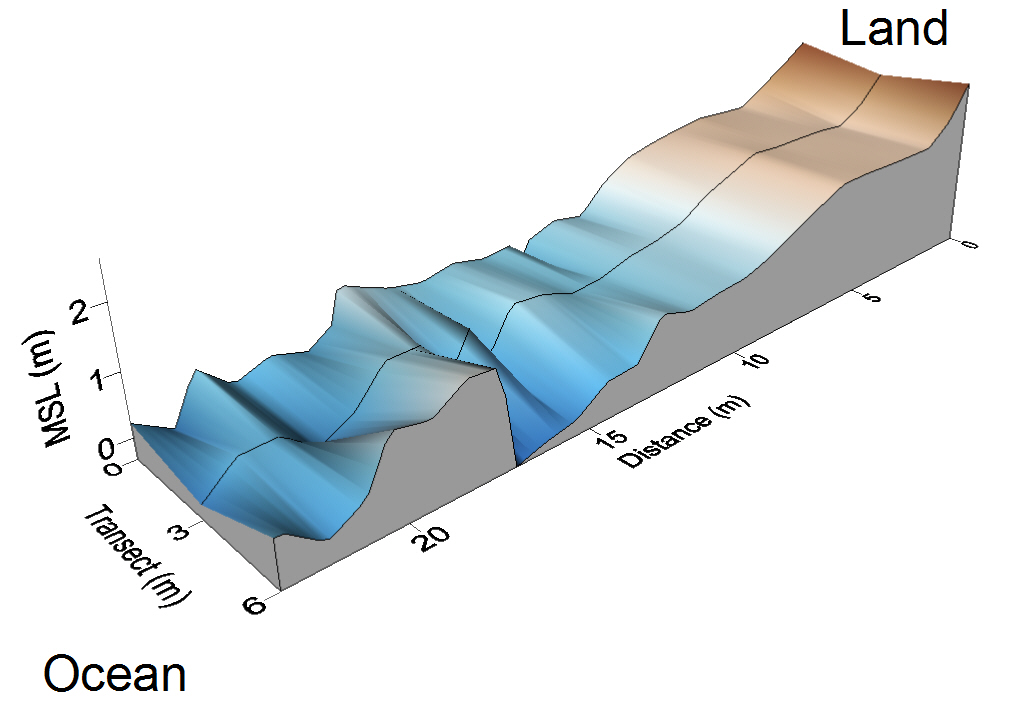
Topography Surveys

The map below displays the topography of the site in meters above mean lower low water (MLLW). It was created from data collected during the Topography Surveys at this site.
Section 1
Section 2