Long-Term Monitoring Trend Graphs
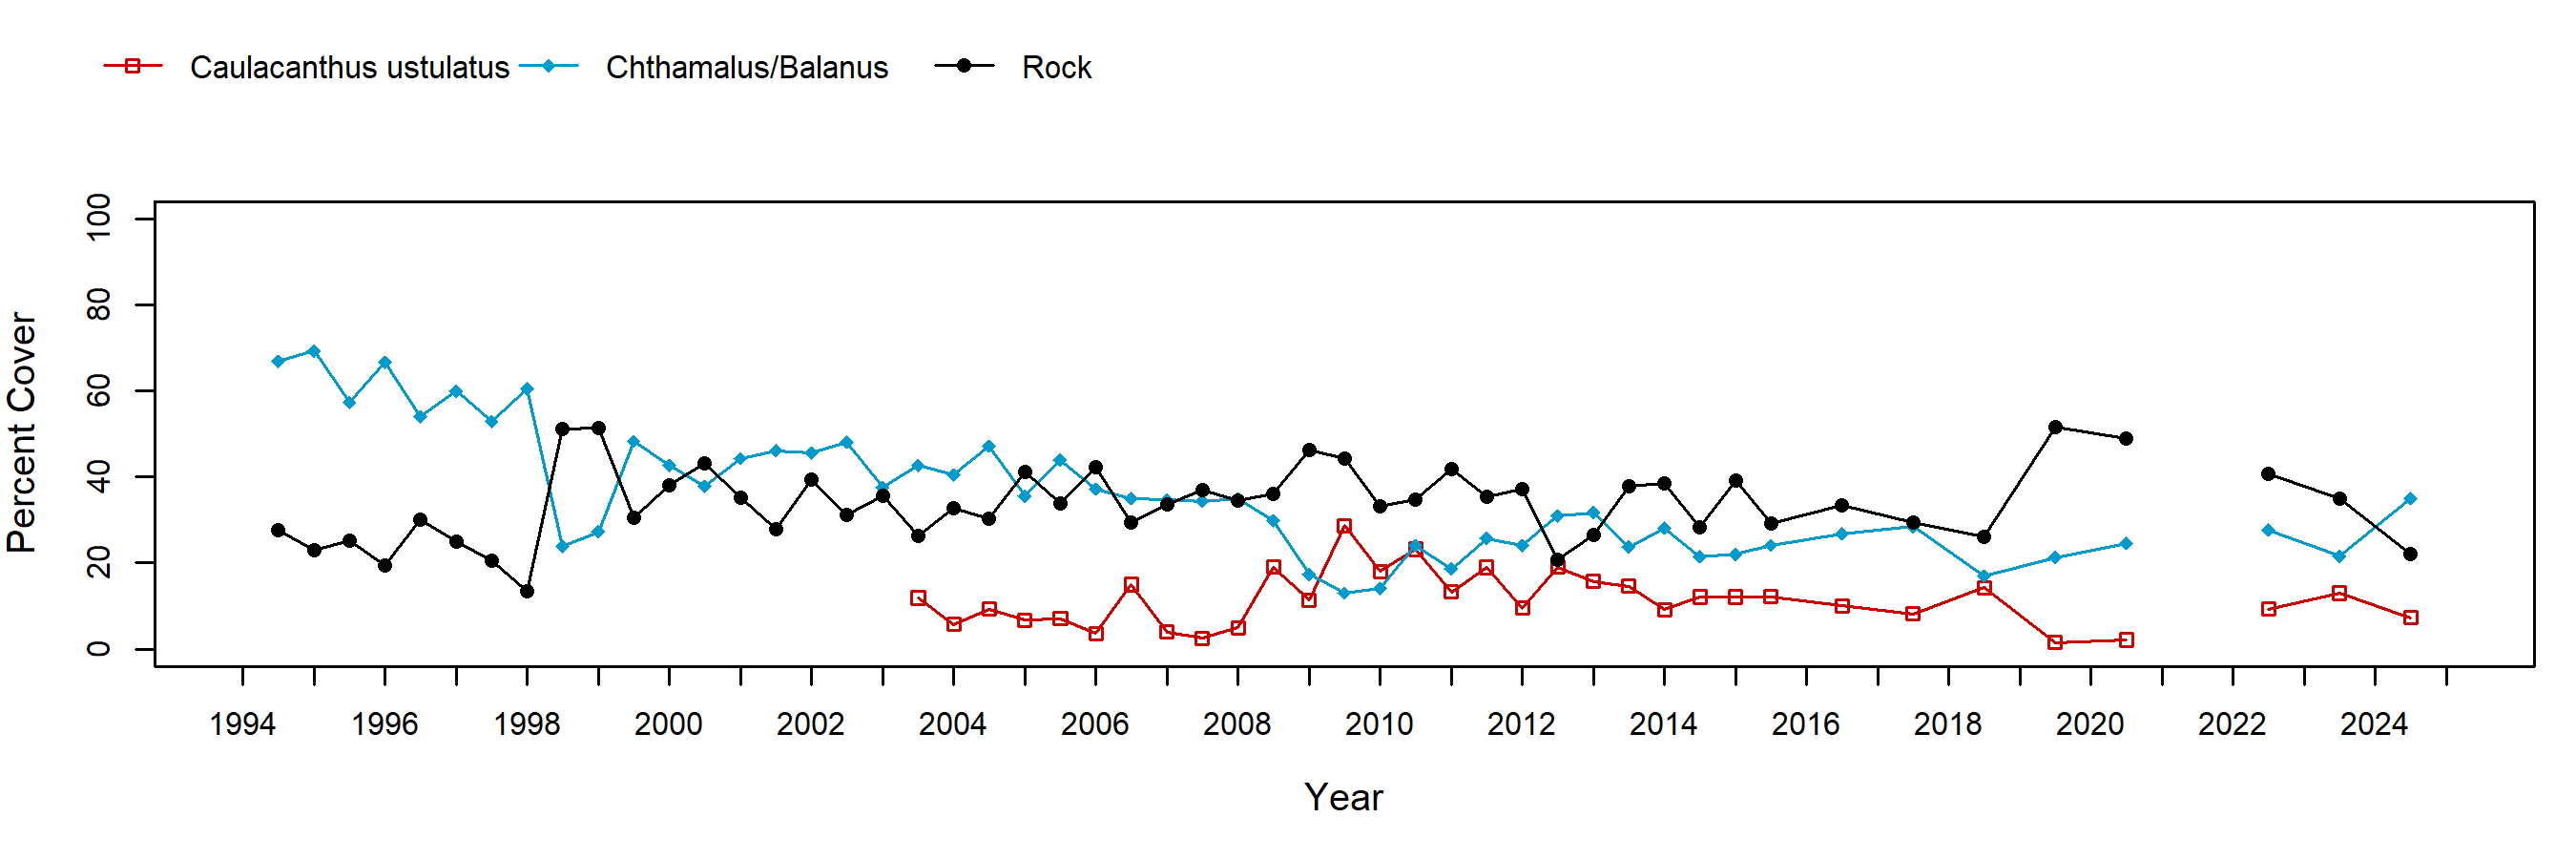
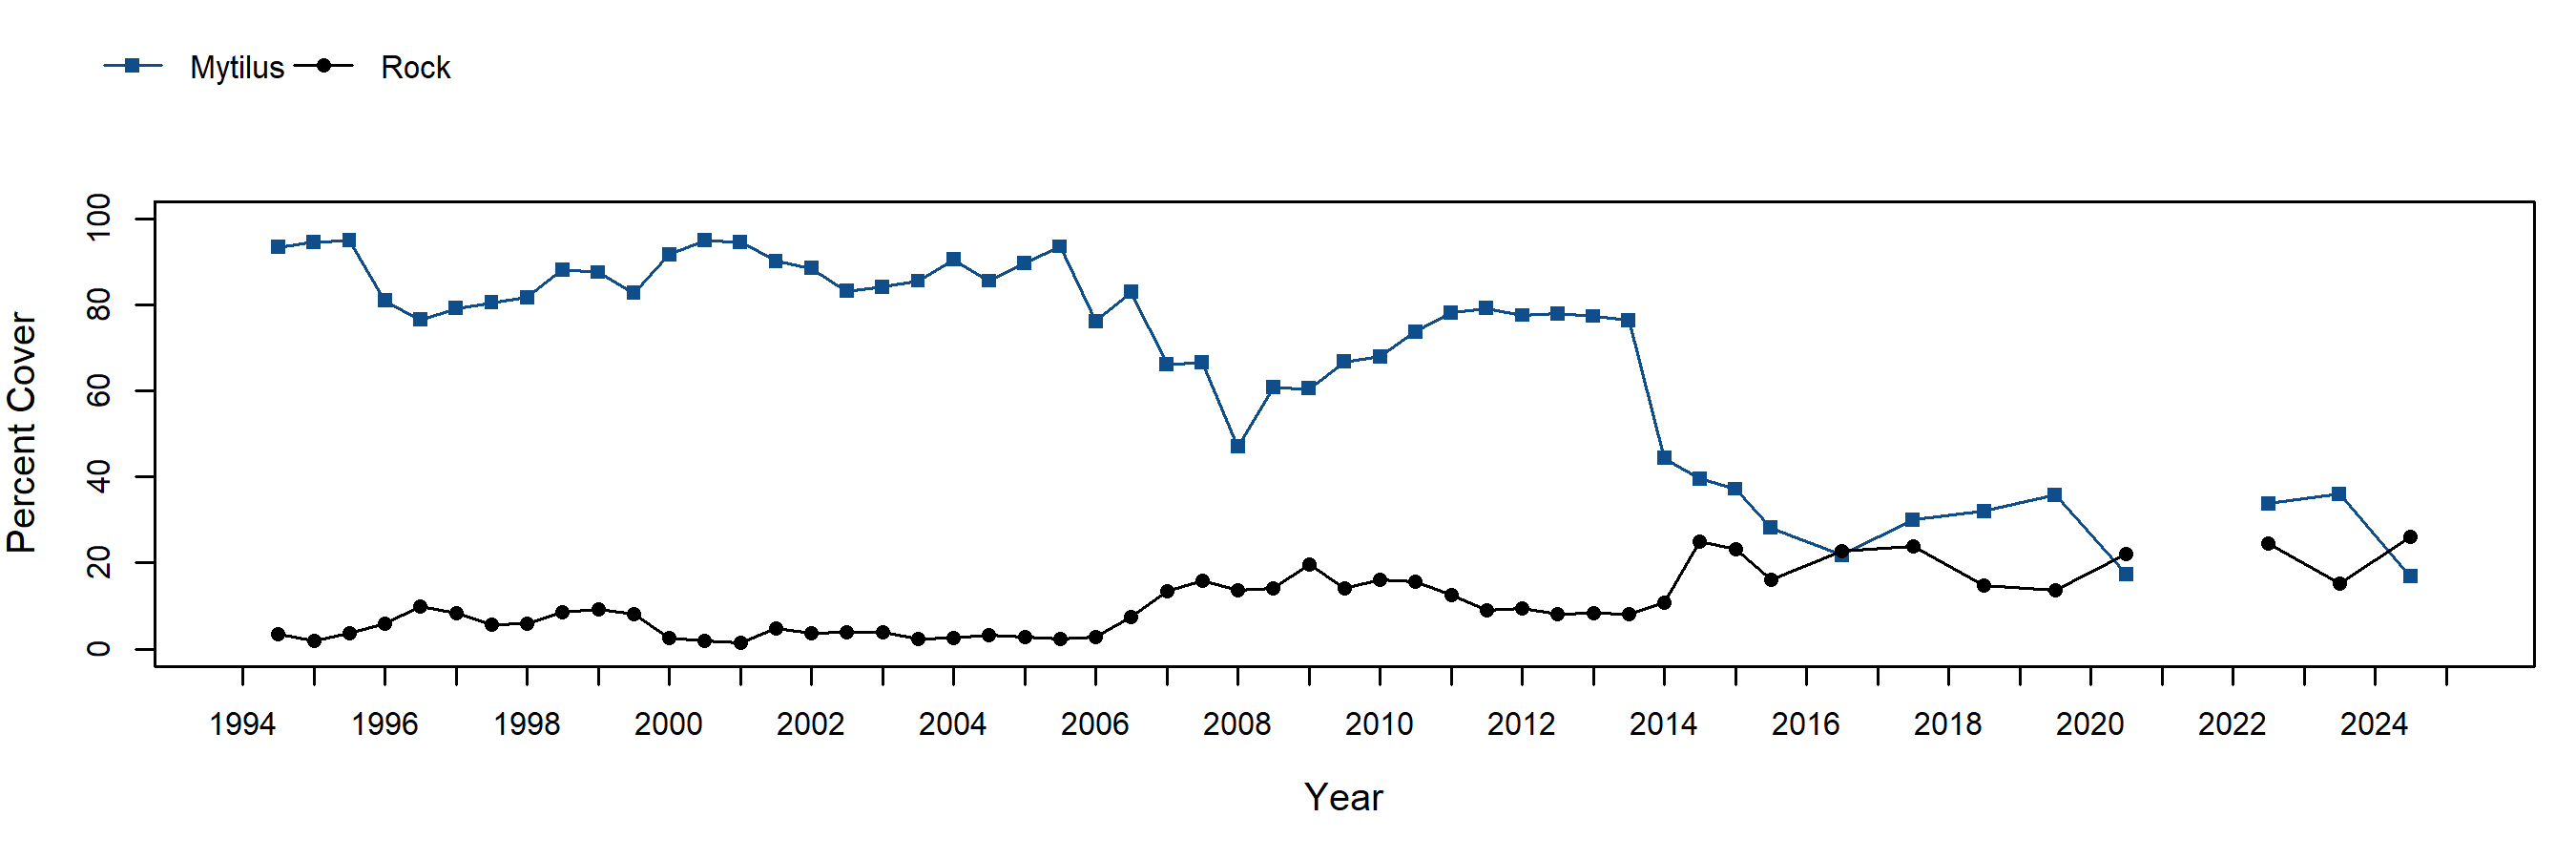
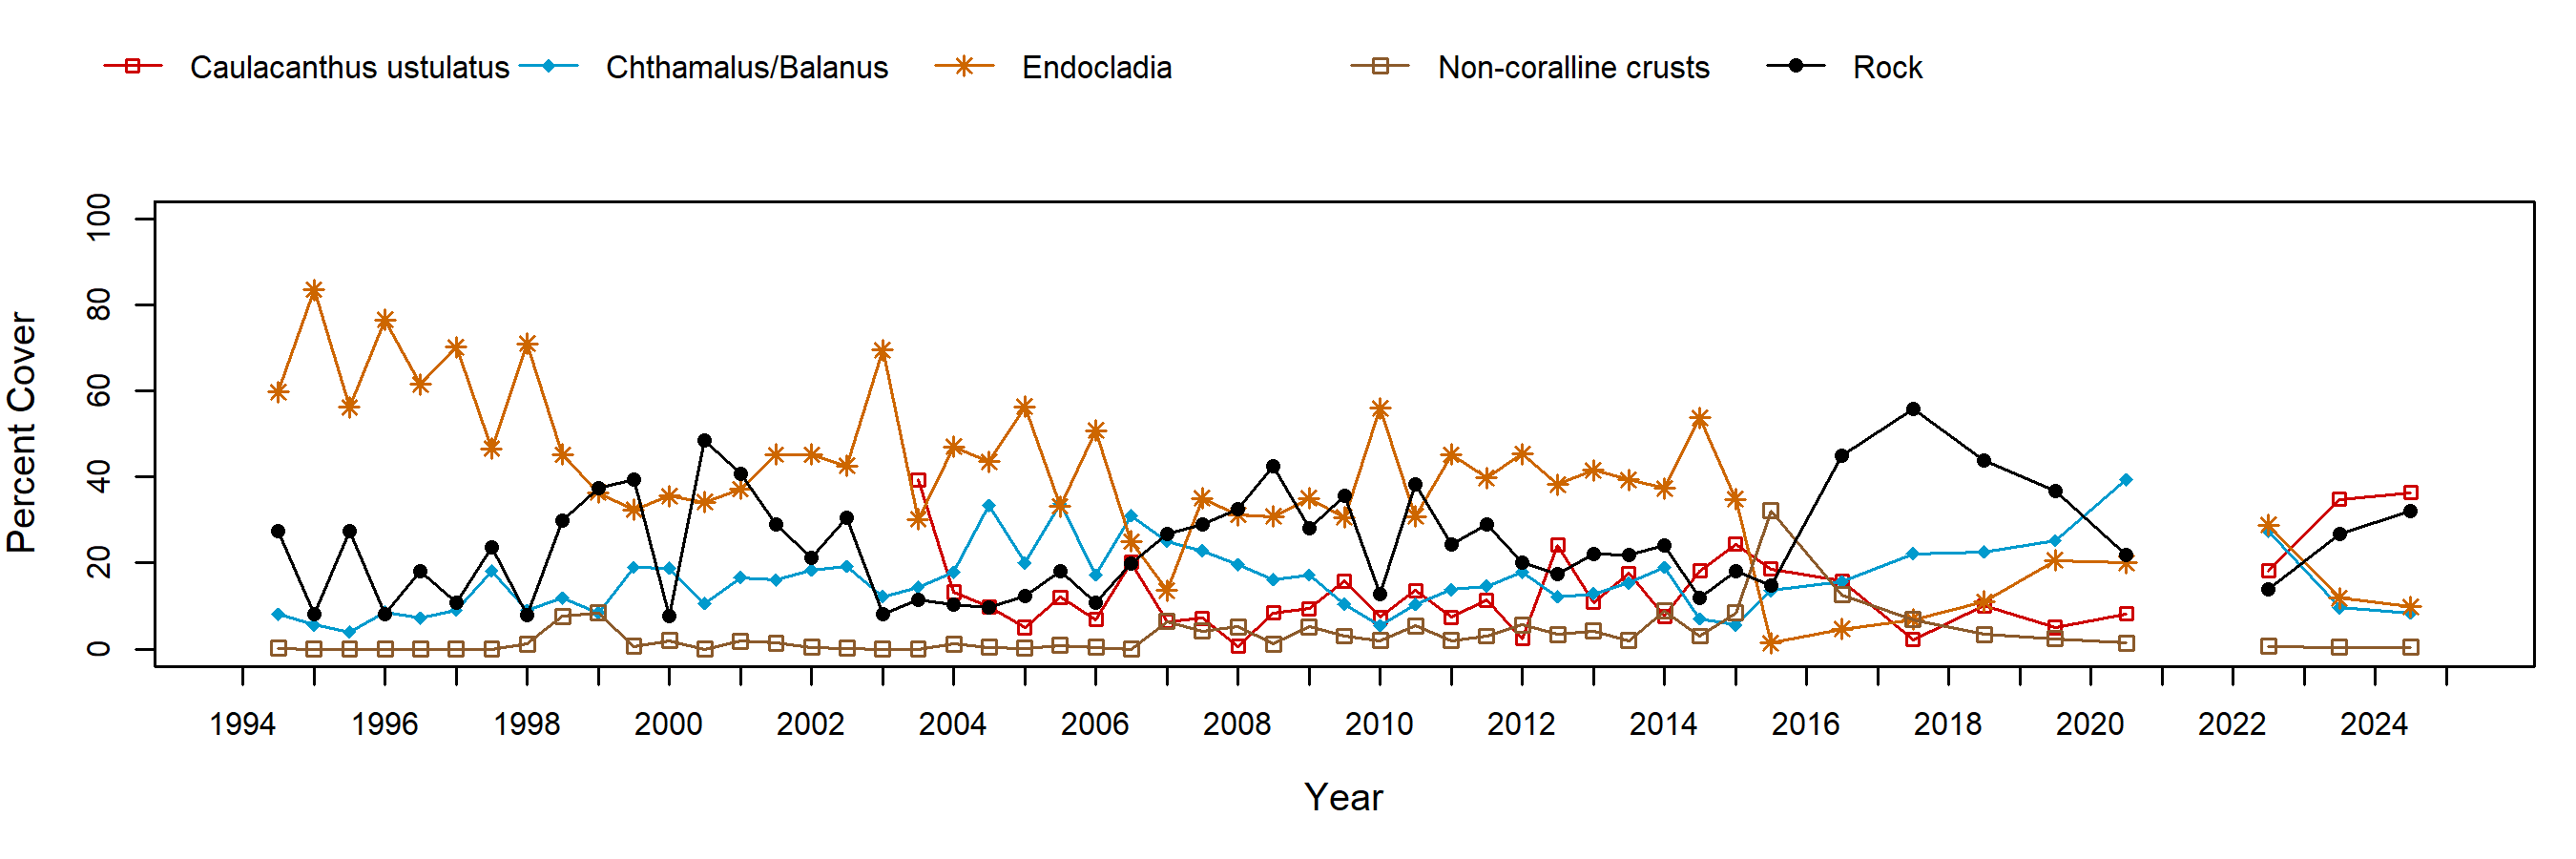
Chthamalus/Balanus barnacle plots at White Point consist of 5 plots initially dominated by Chthamalus dalli/fissus (note that species were not distinguished until 2001) and 5 plots initially dominated by Balanus glandula. While the original approach was to analyze these as separate assemblages, all ten plots were combined collectively as “barnacle plots” since the two genera were lumped during data collection. Within these ten barnacle plots, barnacle cover has declined gradually throughout the monitoring period. The non-native red alga Caulacanthus invaded barnacle plots in 2003. Mytilus cover in mussel plots has declined over time. The marked loss in mussels in 2014 is attributed to two plots which exhibited partial to complete mussel collapse, presumably as a result of unusually strong winter storms. Over time, Endocladia cover in turfweed plots, although seasonally and interannually variable, slowly declined. Barnacle and bare rock cover have generally, but inconsistently, exhibited an inverse seasonal pattern to Endocladia. The non-native red alga Caulacanthus was first recorded in turfweed plots in 2003 with relatively high cover (~40%) and has remained common in plots, ranging between 10-30%.
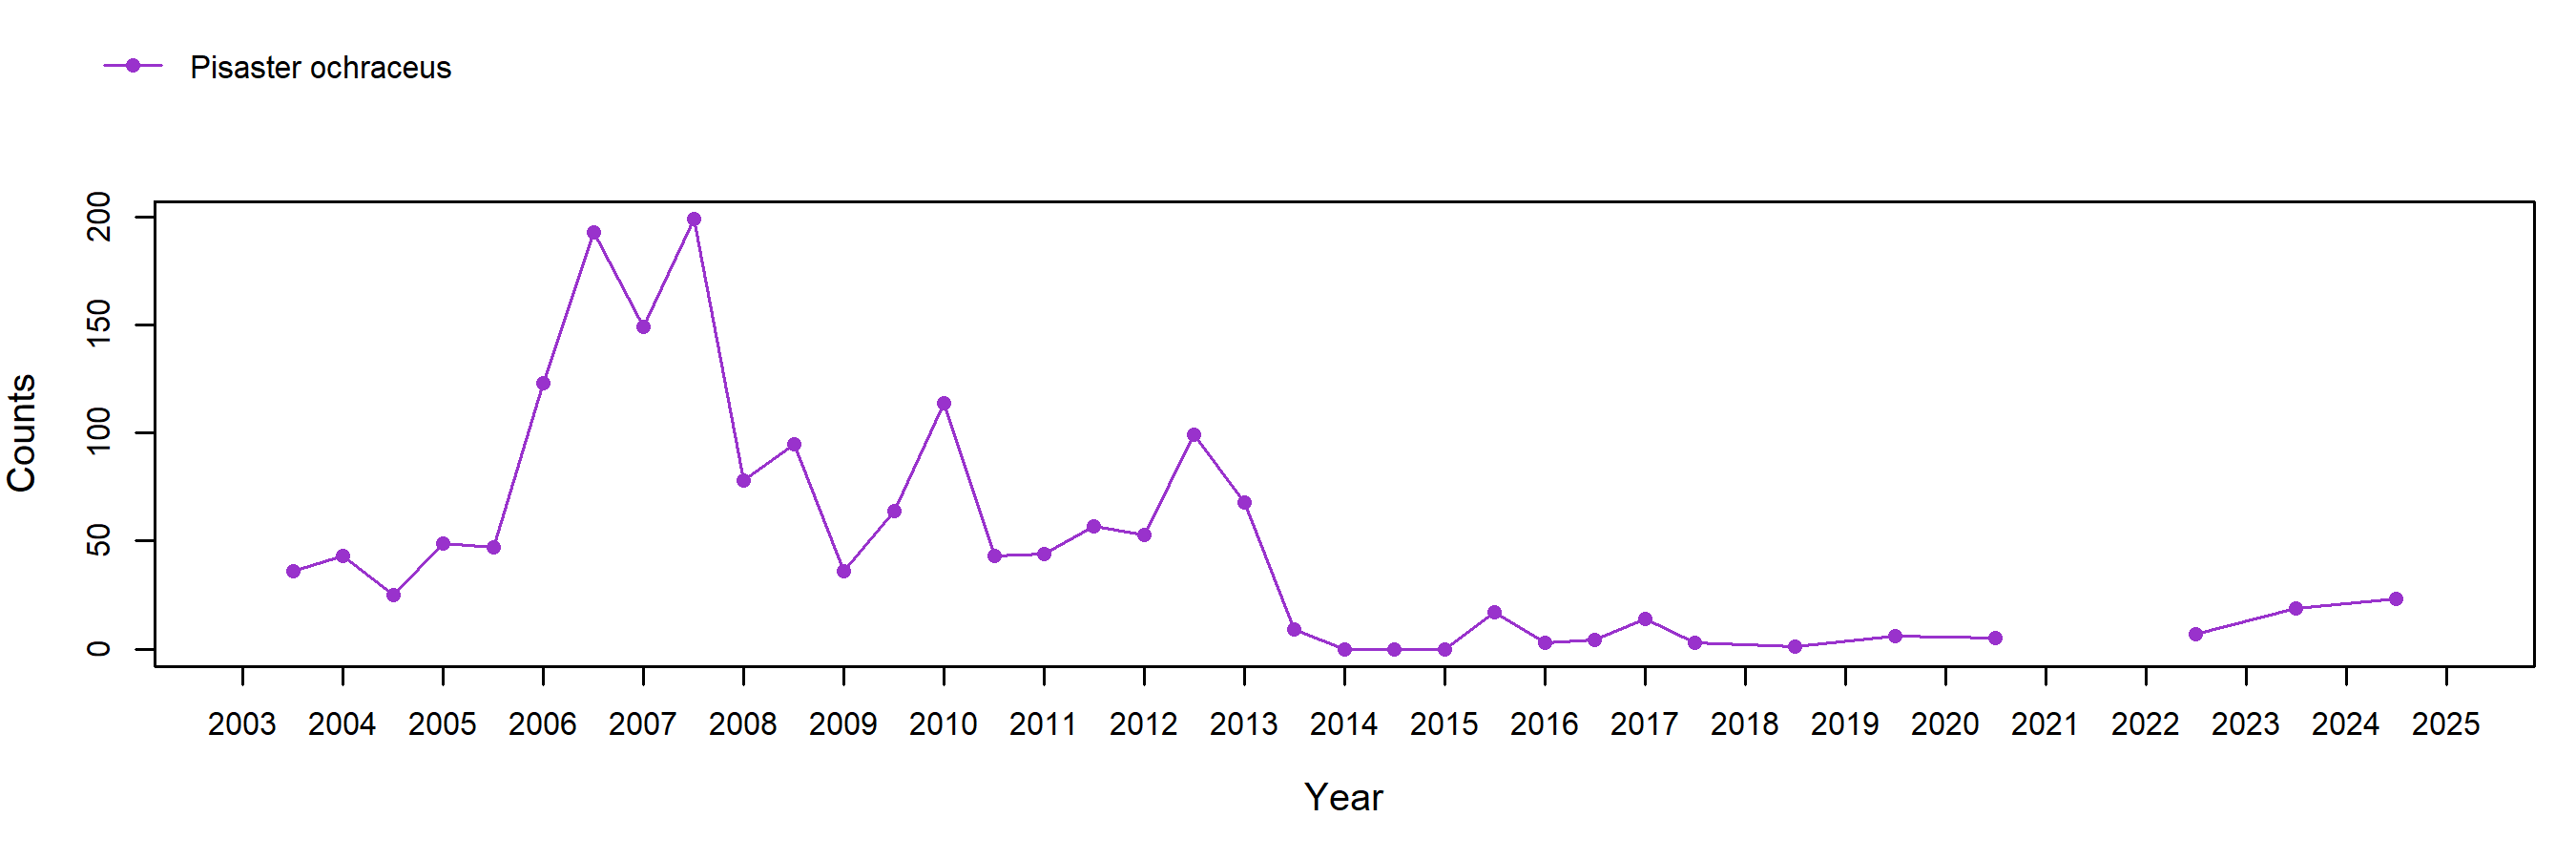
Sea star (Pisaster ochraceus) plots were added to this site in the fall of 2003 and consist of three large irregular plots surrounding an area of medium relief rock, which includes several large cracks and ledges. Sea star numbers fluctuated widely up until 2013. Sea Star Wasting Syndrome impacted this site prior to fall 2013 sampling, with only a couple of sea stars found, each with heavy lesions or missing arms. From 2015 to 2022, only a few individuals were found in plots, but a slight increase in numbers has been observed in recent surveys. Recruitment has been common at this site with sea stars in the 50 mm or less range found in most seasons through spring 2013. Sea stars in the larger size classes (>100 mm) are generally rare at White Point, possibly due to high and largely unregulated human visitation, resulting in harvesting and/or damage through handling and manipulation by visitors. However, increasing numbers of larger (>100 mm) individuals have been found in recent surveys.
In order to standardize species resolution across all MARINe groups and over time, some species (typically rare) were lumped for graphical presentation of Long-Term monitoring data. See lumped categories for definitions (some variation occurs between methods and over time).
If you experience any barriers accessing the trend graphs below, please contact (pacificr@ucsc.edu) for help.
Photo Plots

Below are the trends observed for each Photo Plot target species at this site. Long-Term percent cover trend graphs also include any species that reached a minimum of 25% cover during any single point in time within a given target species assemblage. Breaks in trend lines represent missed sampling events. For additional species observed that did not meet this 25% threshold, please use the Graphing Tool.
Chthamalus/Balanus (Acorn Barnacles) – percent cover
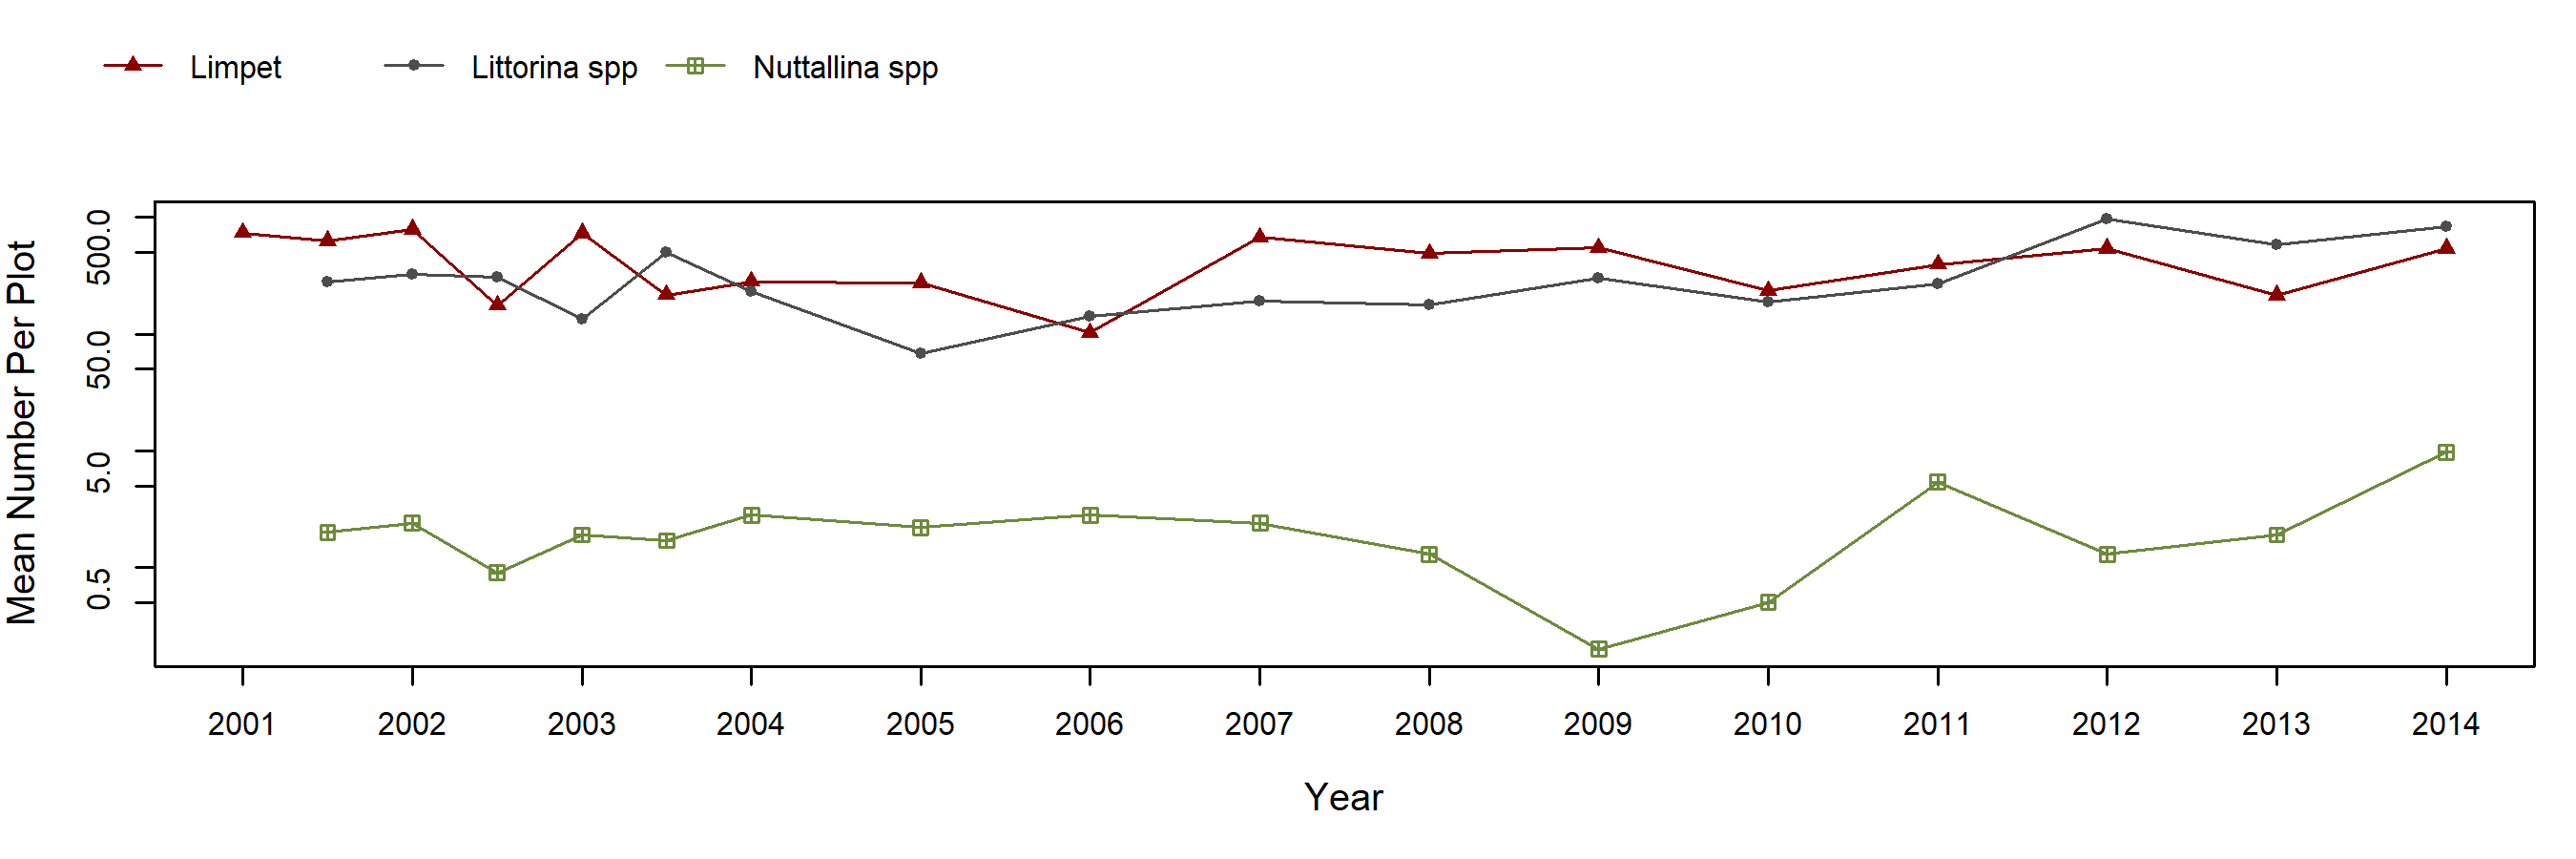
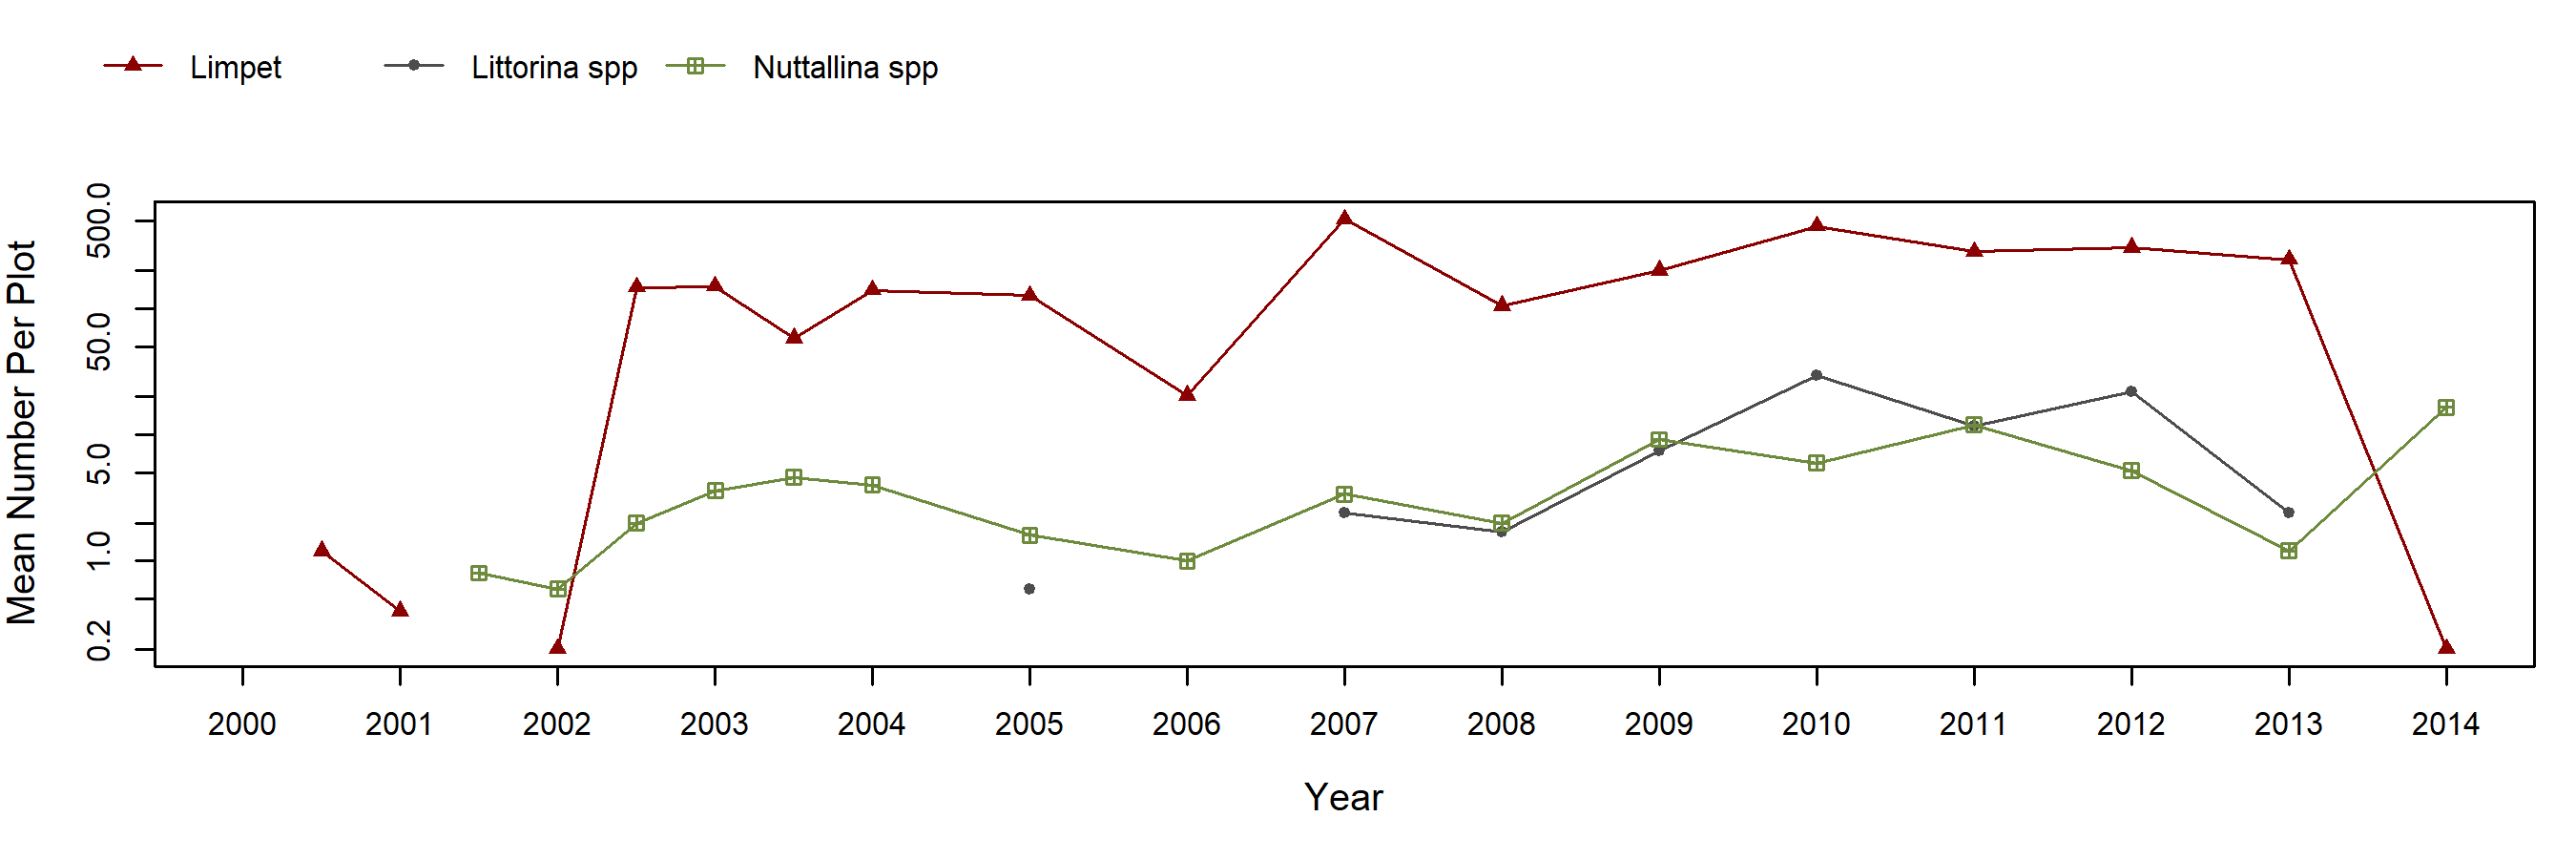
Chthamalus/Balanus (Acorn Barnacles) – motile invertebrate counts
Mytilus (California Mussel) – percent cover
Mytilus (California Mussel) – motile invertebrate counts
Endocladia (Turfweed) – percent cover
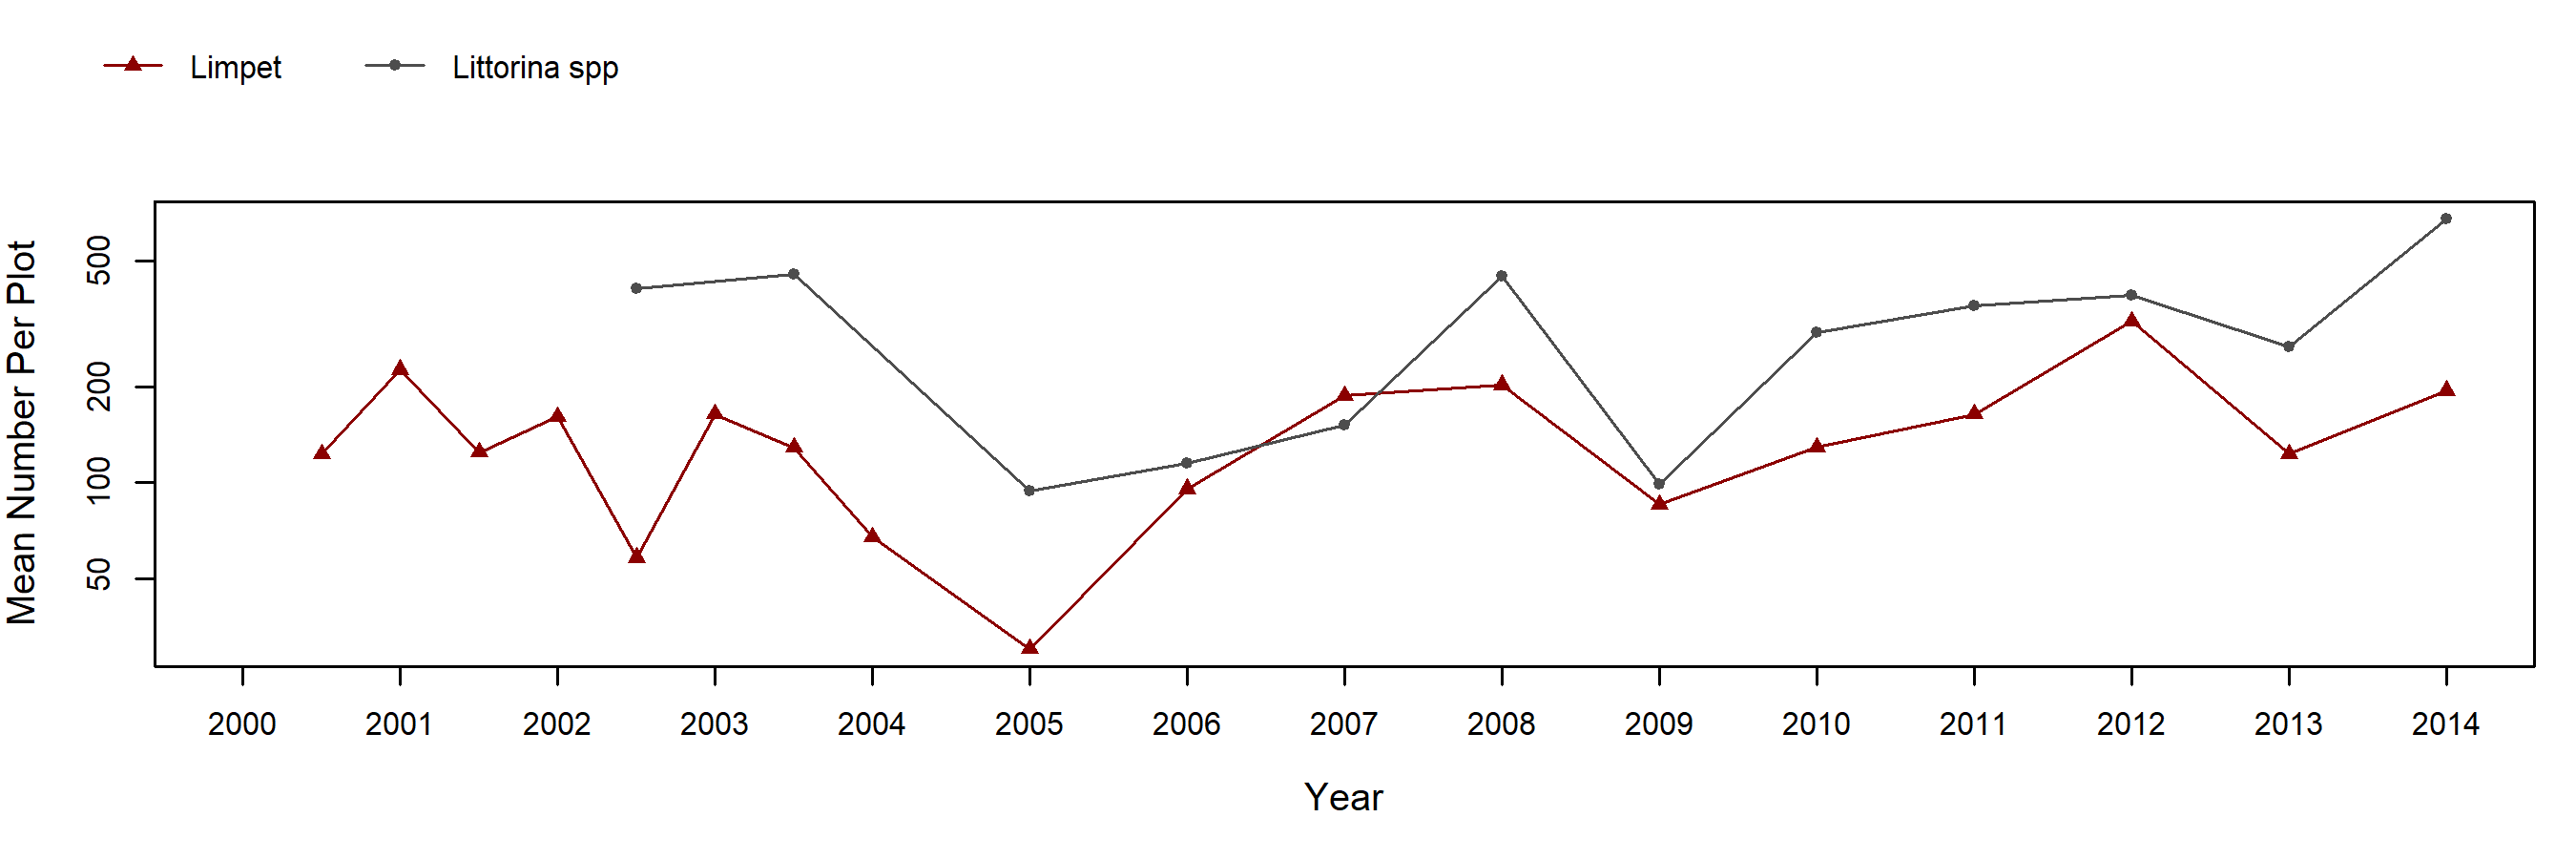
Endocladia (Turfweed) – motile invertebrate counts
Species Counts and Sizes

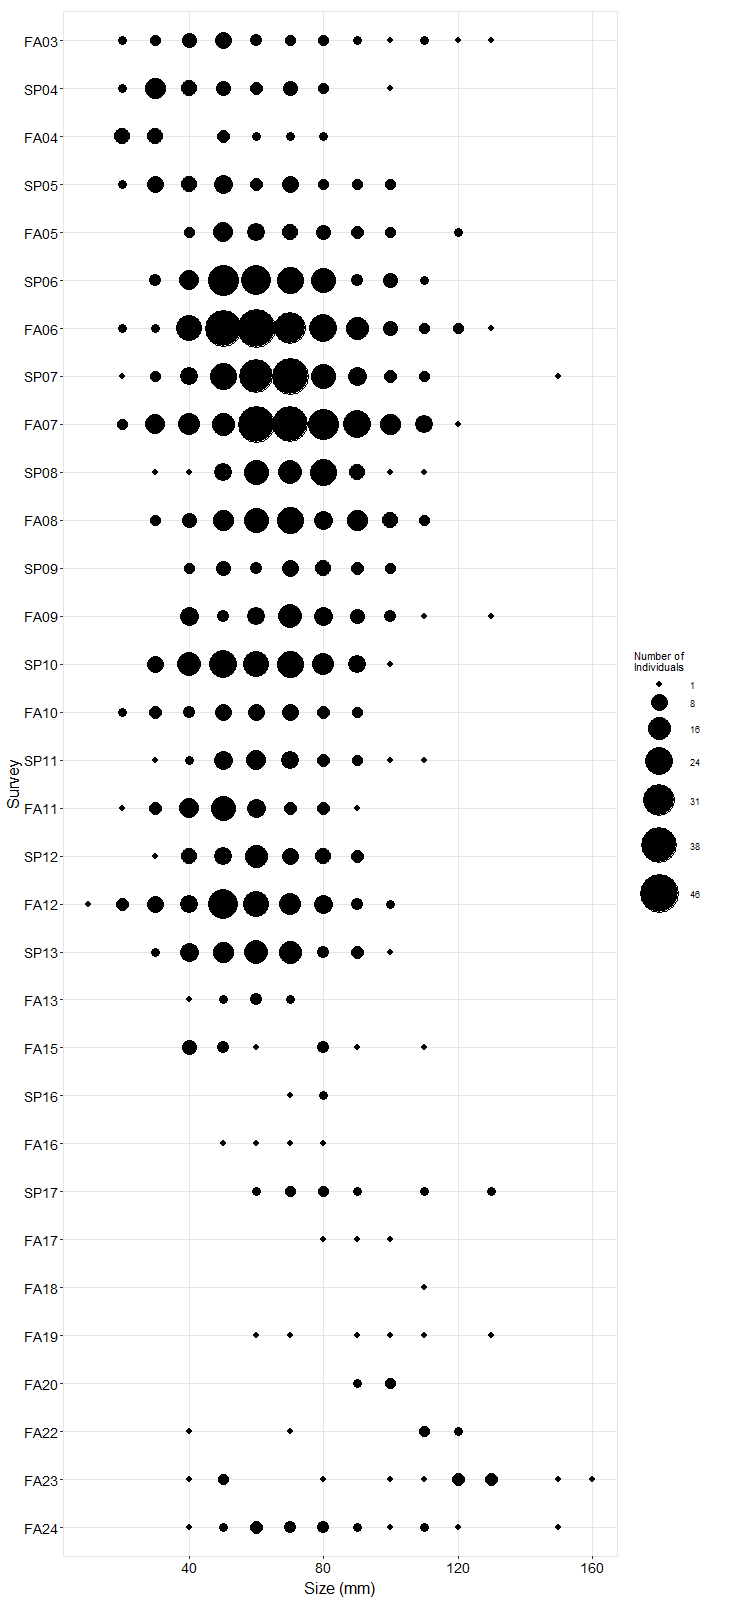
Species Counts and Sizes (where recorded) for Pisaster are shown below for this site. At some sites, other sea star species and Katharina are counted in addition to Pisaster. The sum of all individuals across all plots is displayed. Note that data gaps are represented by breaks in long-term count trend lines, but are not shown in size plots.
Pisaster ochraceus (Ochre Star) – counts
Pisaster ochraceus (Ochre Star) – sizes