
Navy South Long-Term trends | MARINe
Navy South Long-Term trends
See below for trend graphs
In order to standardize species resolution across all MARINe groups, and over time, some species (typically rare) were lumped for graphical presentation of Long-Term monitoring data. See lumped categories for definitions (some variation occurs between methods and over time).
Since 2005/2006 Navy South has been monitored largely through volunteer efforts; field data have been collected, but not scored nor entered into database.
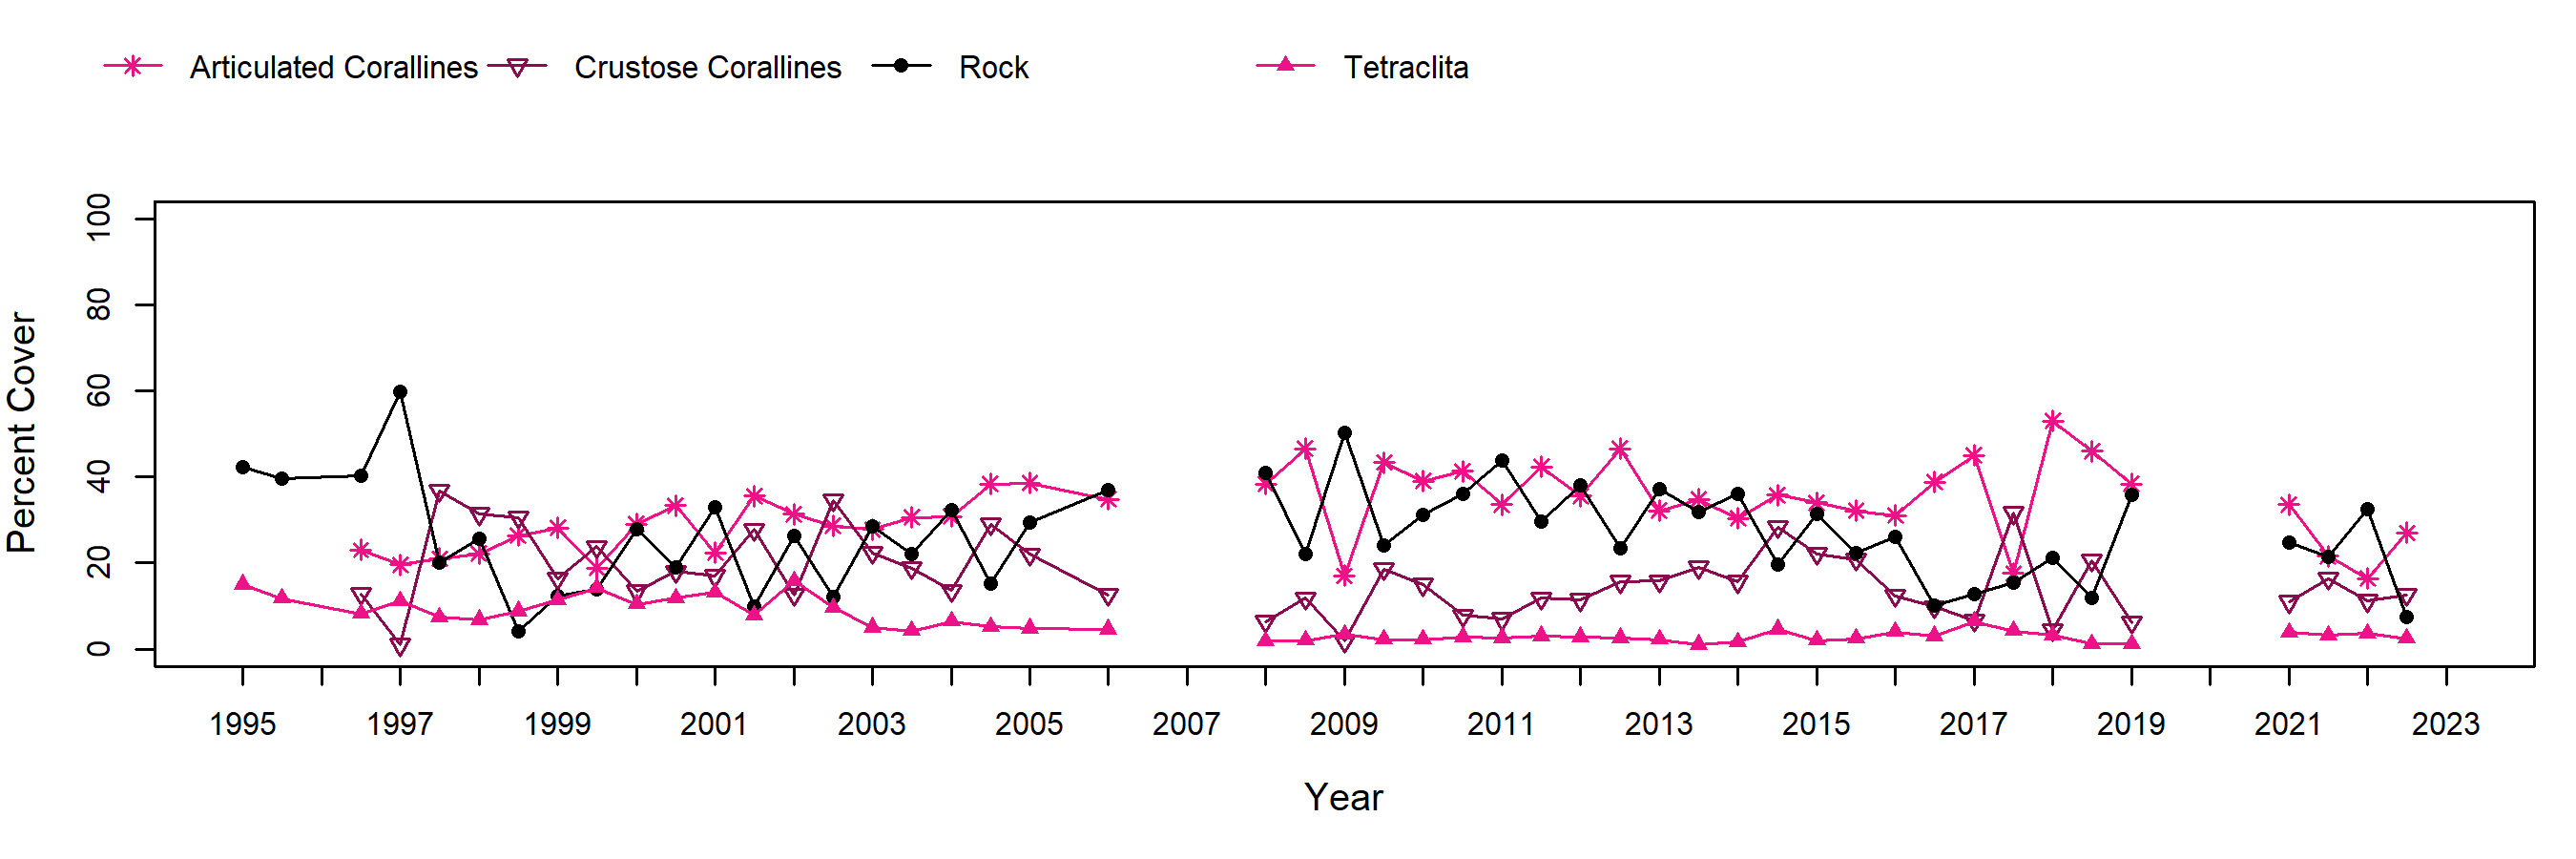
Tetraclita plots at Navy South consist of relatively low cover (<20%) of pink barnacles (Tetraclita), along with articulated corallines, crustose corallines, and rock. Tetraclita varied little, though declined to 10% or less cover by 2003-2006 concomitant with increased articulated coralline cover. Bare rock cover tended to be more common in spring compared to fall, apparently due to winter storms and midday low tides seasonally reducing algal cover in the plots.
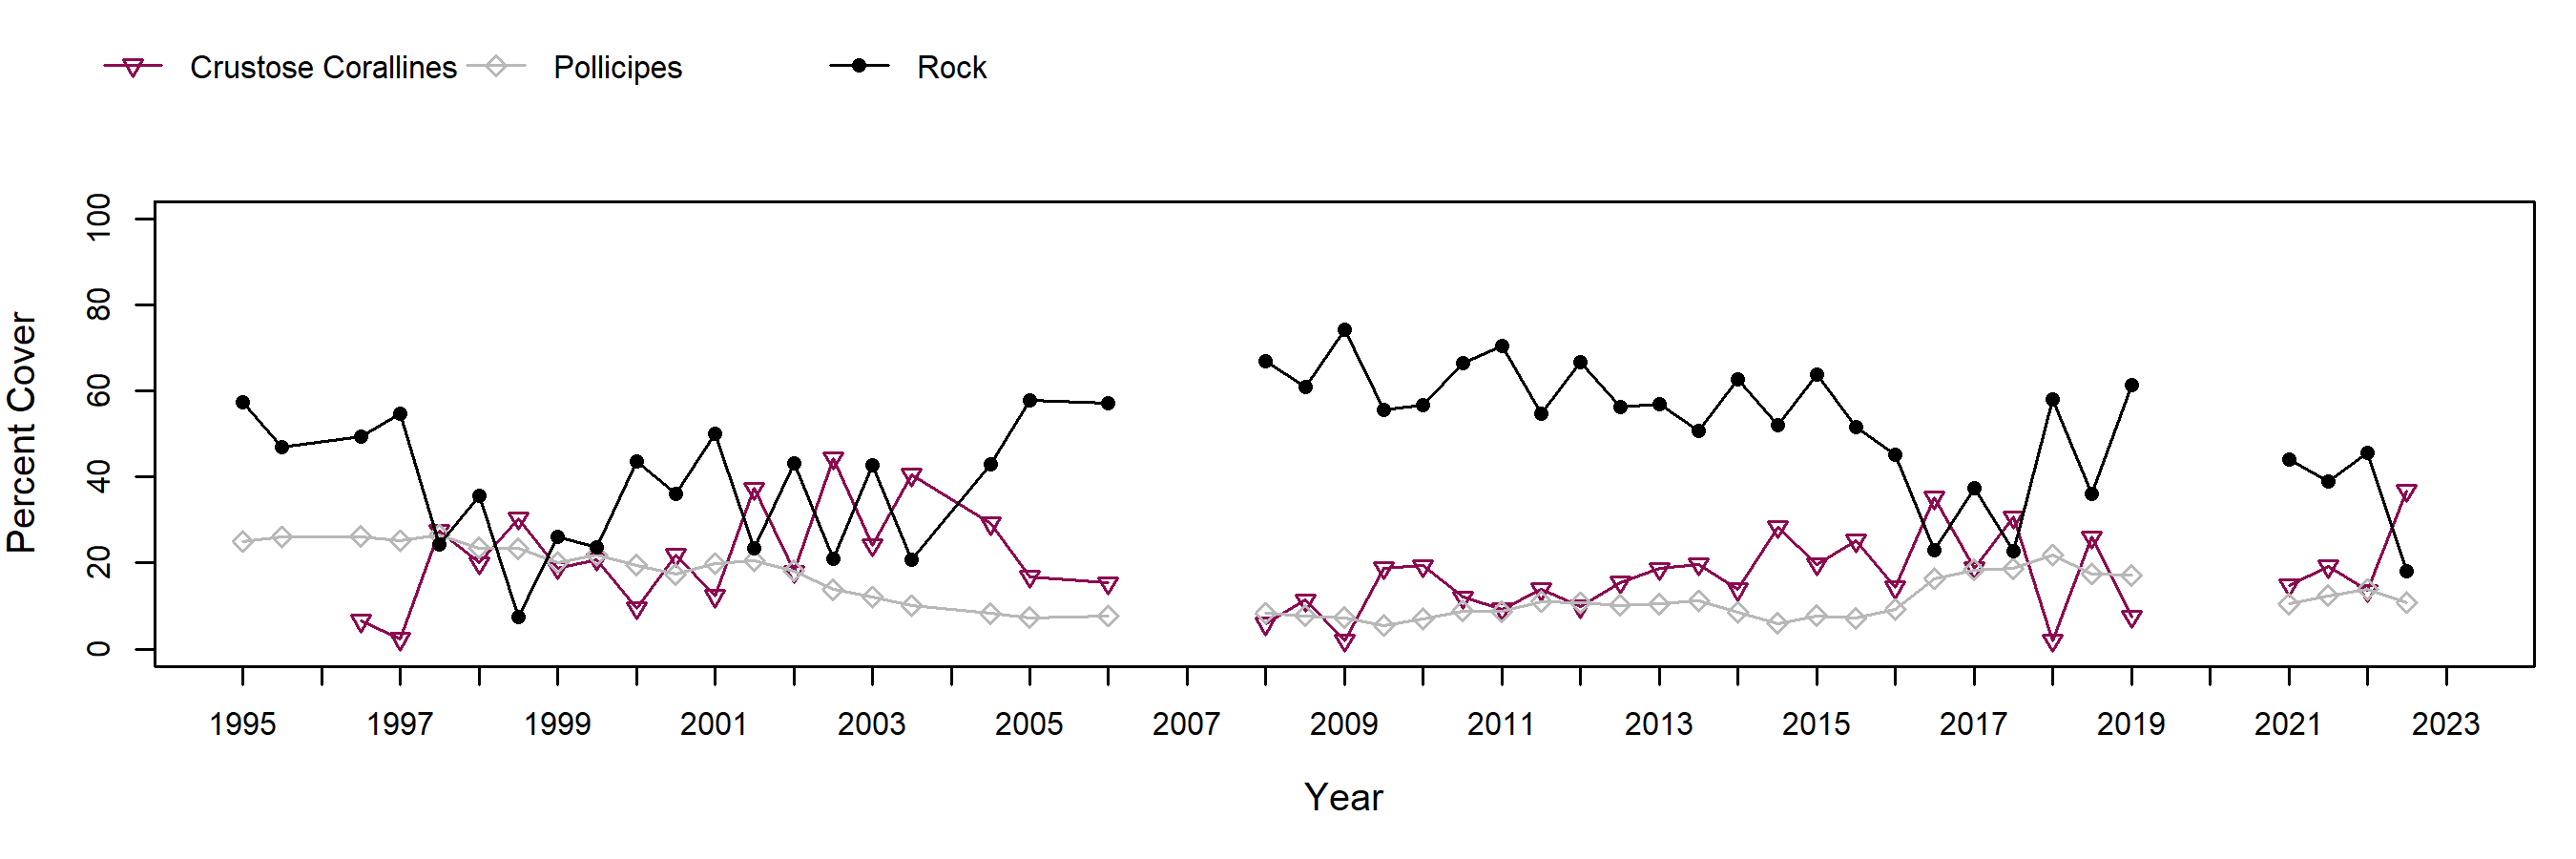
Pollicipes cover in Pollicipes plots gradually declined from ~20-25% cover in the 1990’s to ~10-15% by 2003 and thereafter. Crustose corallines and rock increasingly dominated the plots over time, varying inversely with each other in a seasonal pattern (spring: higher rock/lower corallines; fall: higher corallines/lower rock).
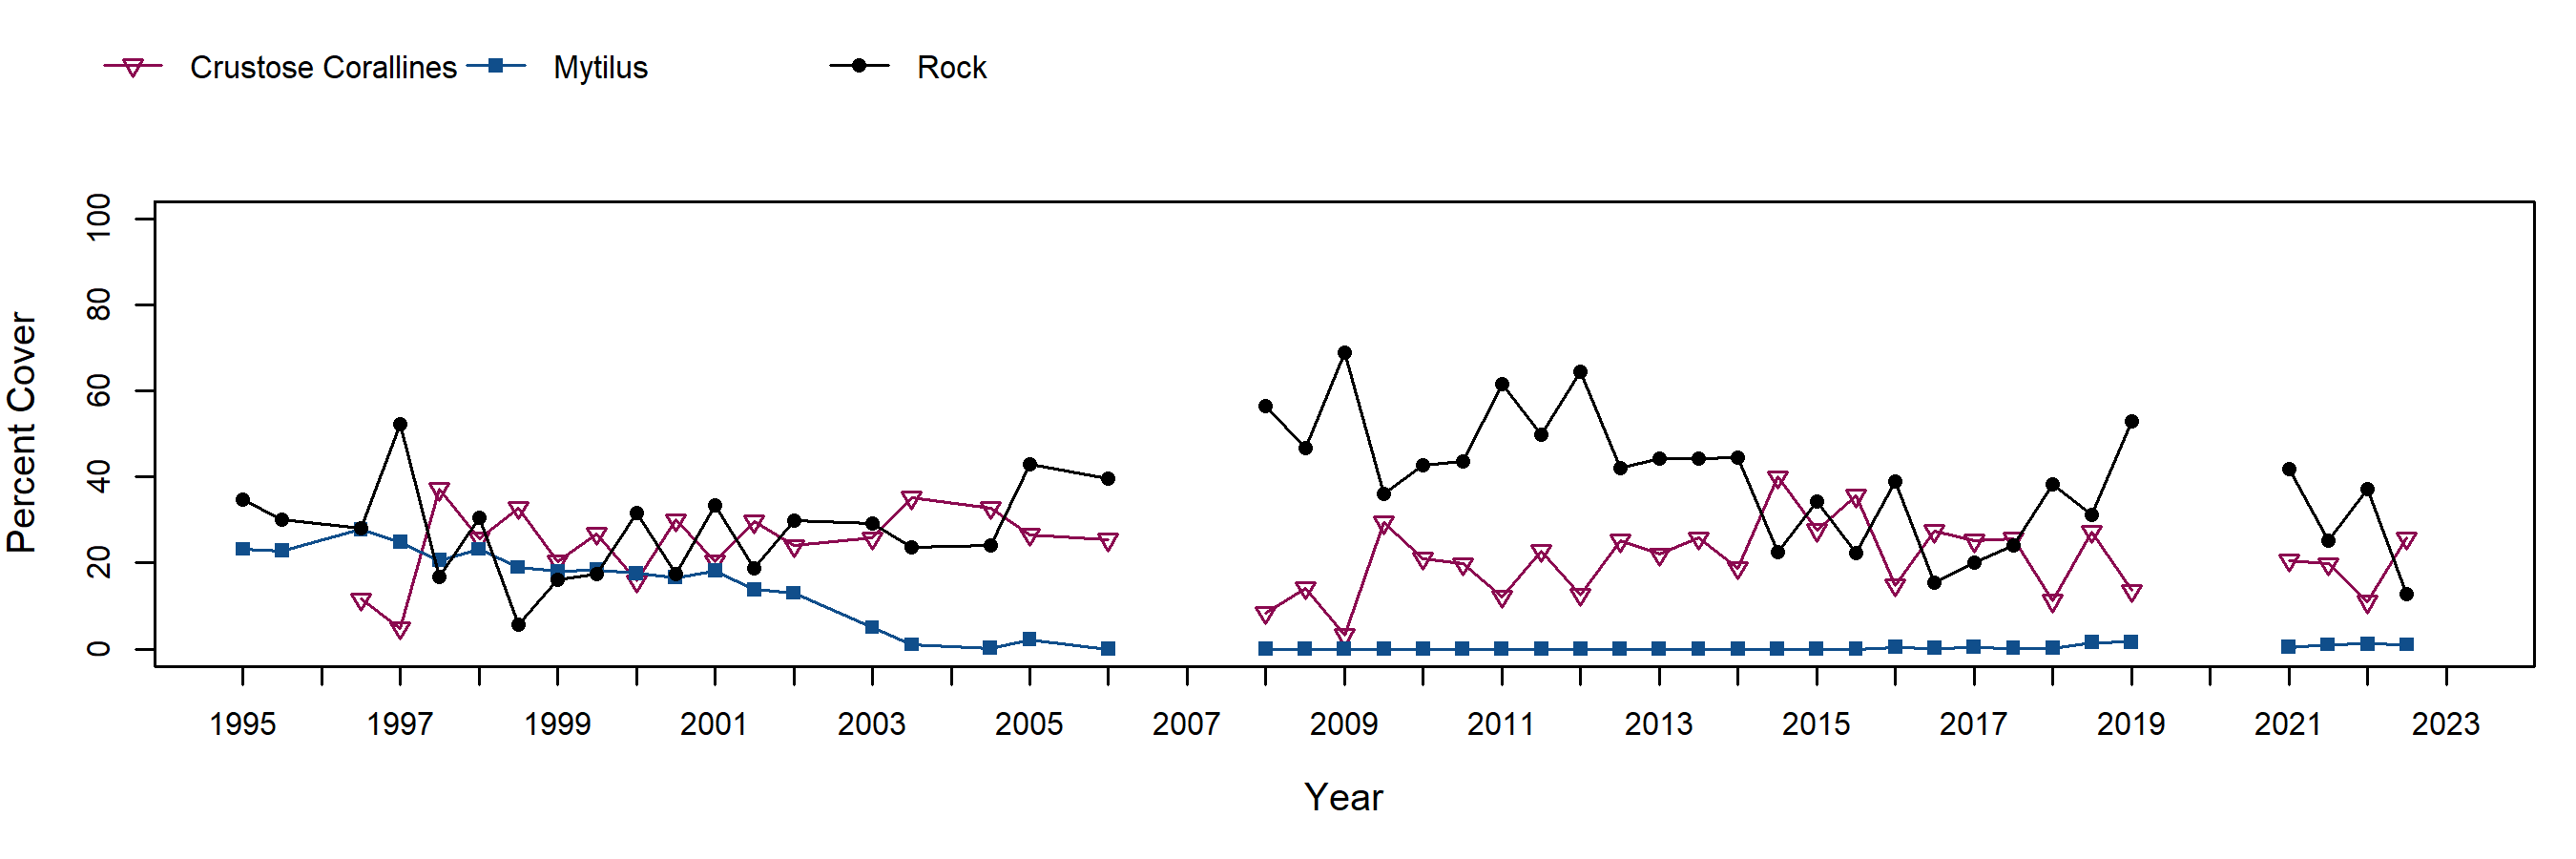
Mytilus in mussel plots declined gradually throughout the monitoring period from ~25% cover in the early years to near zero values after 2002. Crustose corallines and rock increasingly dominated the plots over time, generally varying inversely with each other in a seasonal pattern (spring: higher rock/lower corallines; fall: higher corallines/lower rock). Mussels were once common along Point Loma shores, but became increasing rare or absent after the 1970’s, apparently due to lack of successful recruitment. Now even remnant mussel patches at Navy South that were initially chosen for monitoring have largely disappeared.
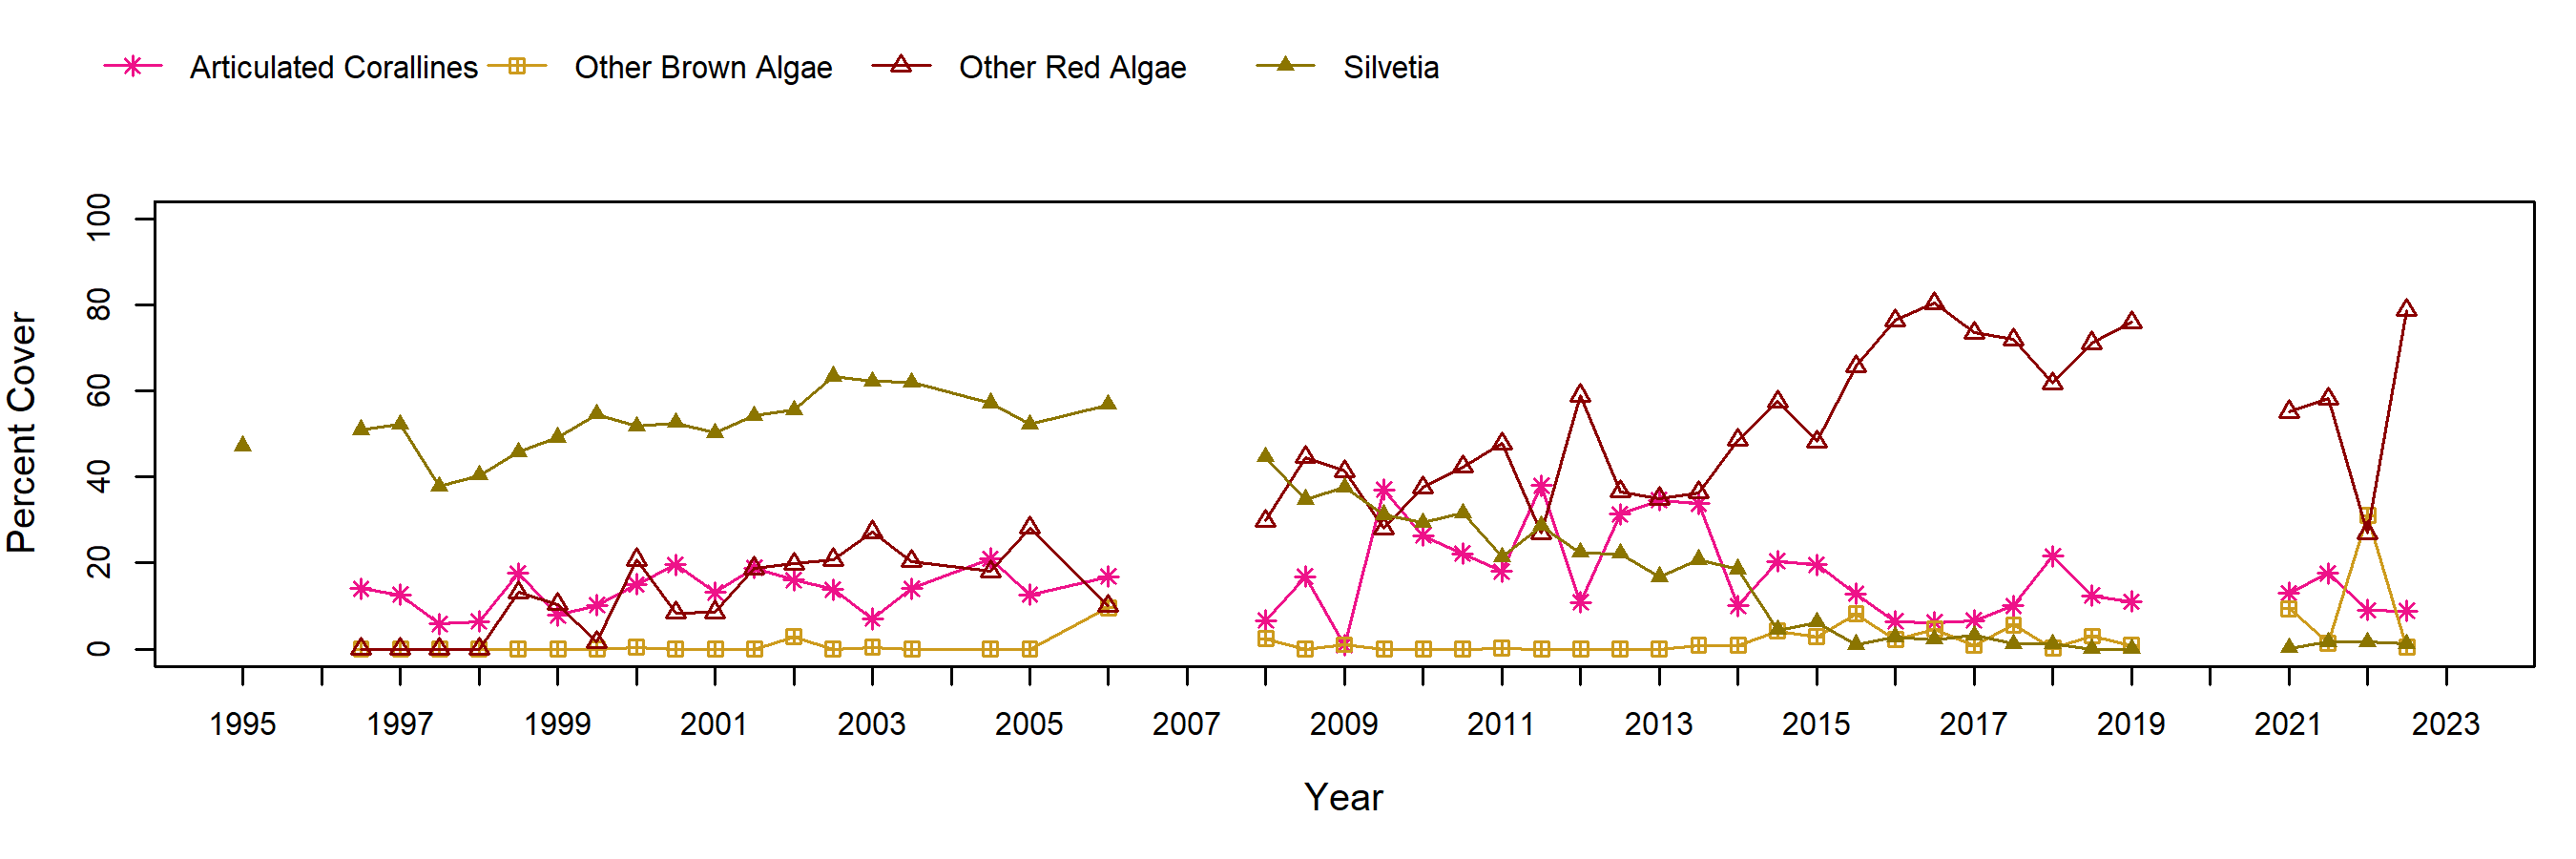
Silvetia cover in Silvetia plots, initially ~50% cover in 1995, declined mildly during the 1997-1998 El Niño, then recovered and remained at ~50-60% levels thereafter. Other red algae abundance typically varied inversely with Silvetia. Unlike rockweed at Navy North, there was no obvious seasonal pattern for Silvetia at Navy South. The rockweed at Navy South is located in a sheltered cove, with greater protection from winter storms than the open coast.
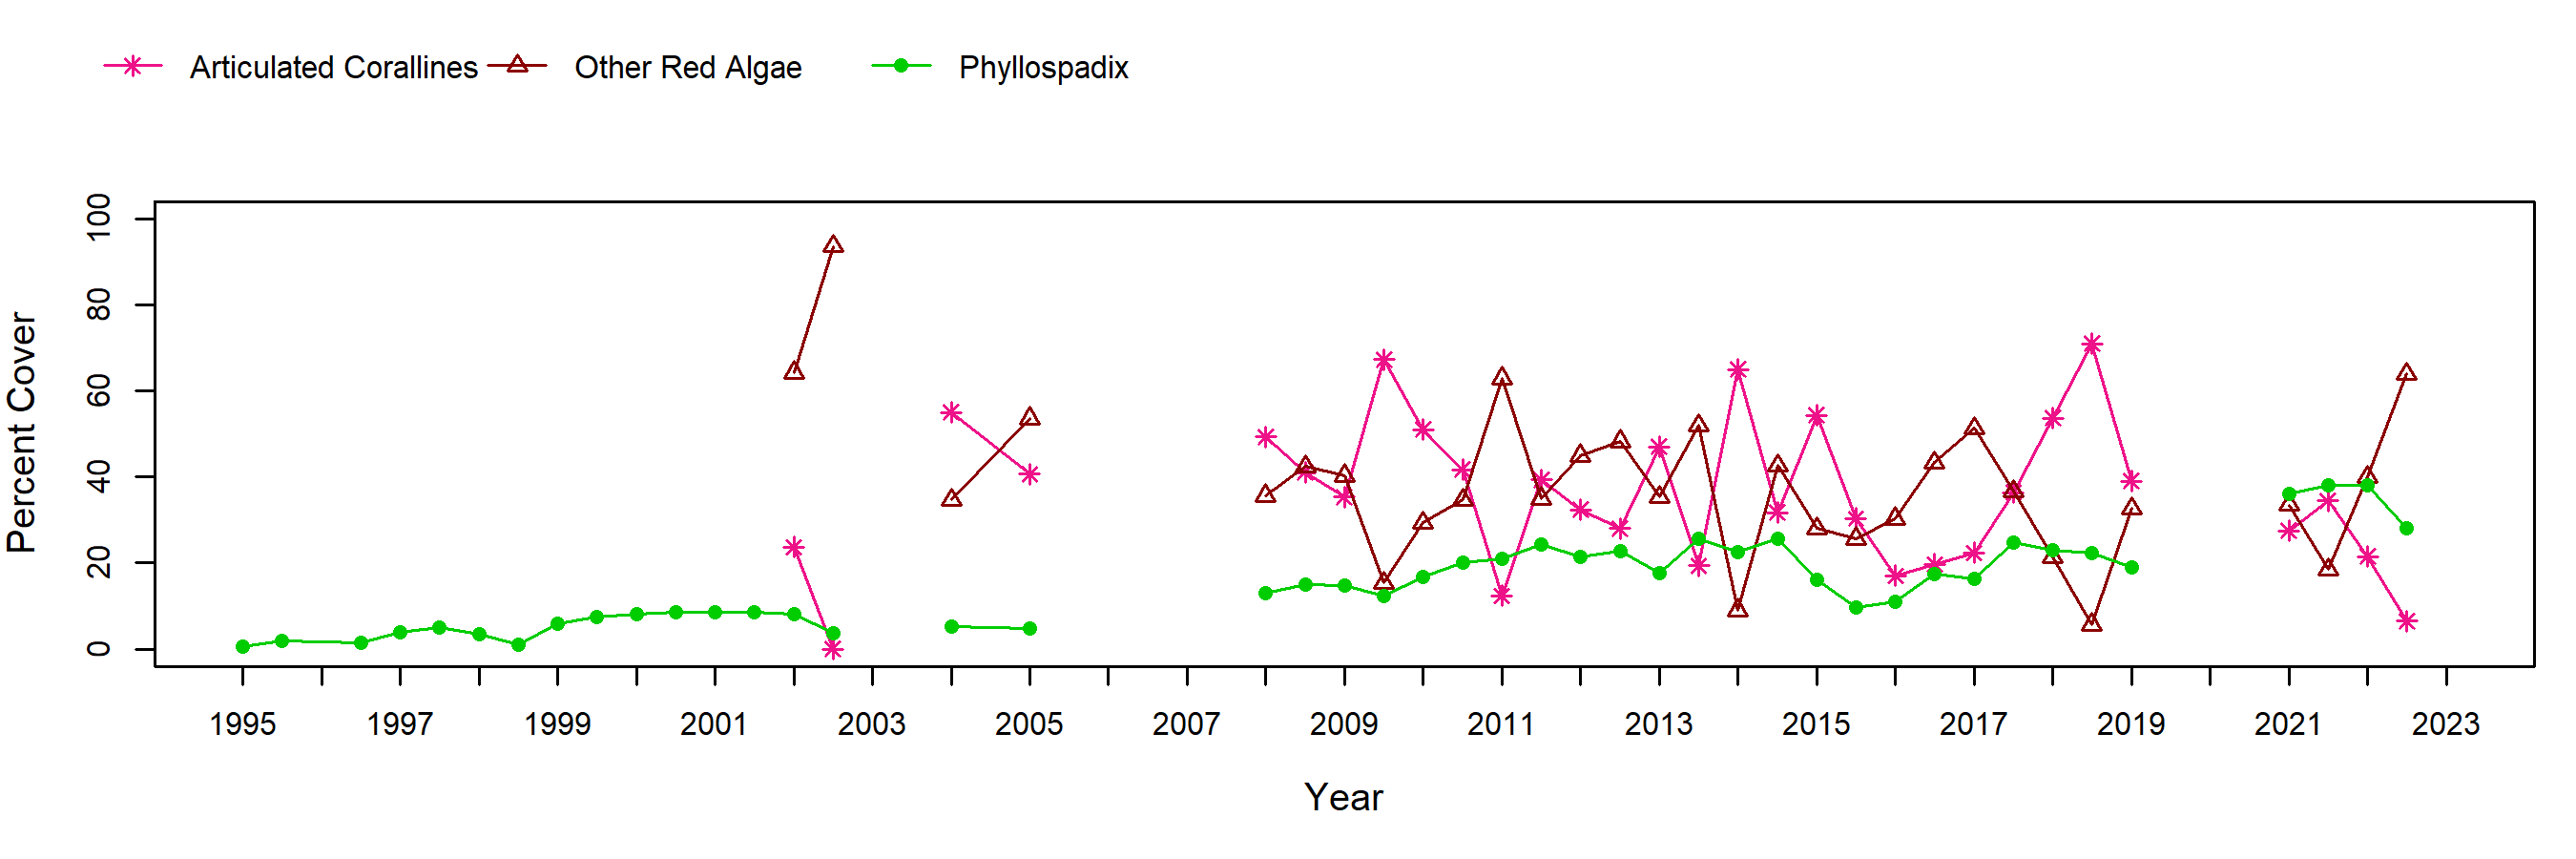
Red algal turf was scored in red algal turf transects until 2001, after which it was scored as more detailed components, including other red algae and articulated corallines. These components fluctuated considerably and inversely during 2002-2005; however, their combined values continued the 90% or greater turf cover that existed throughout the monitoring period.
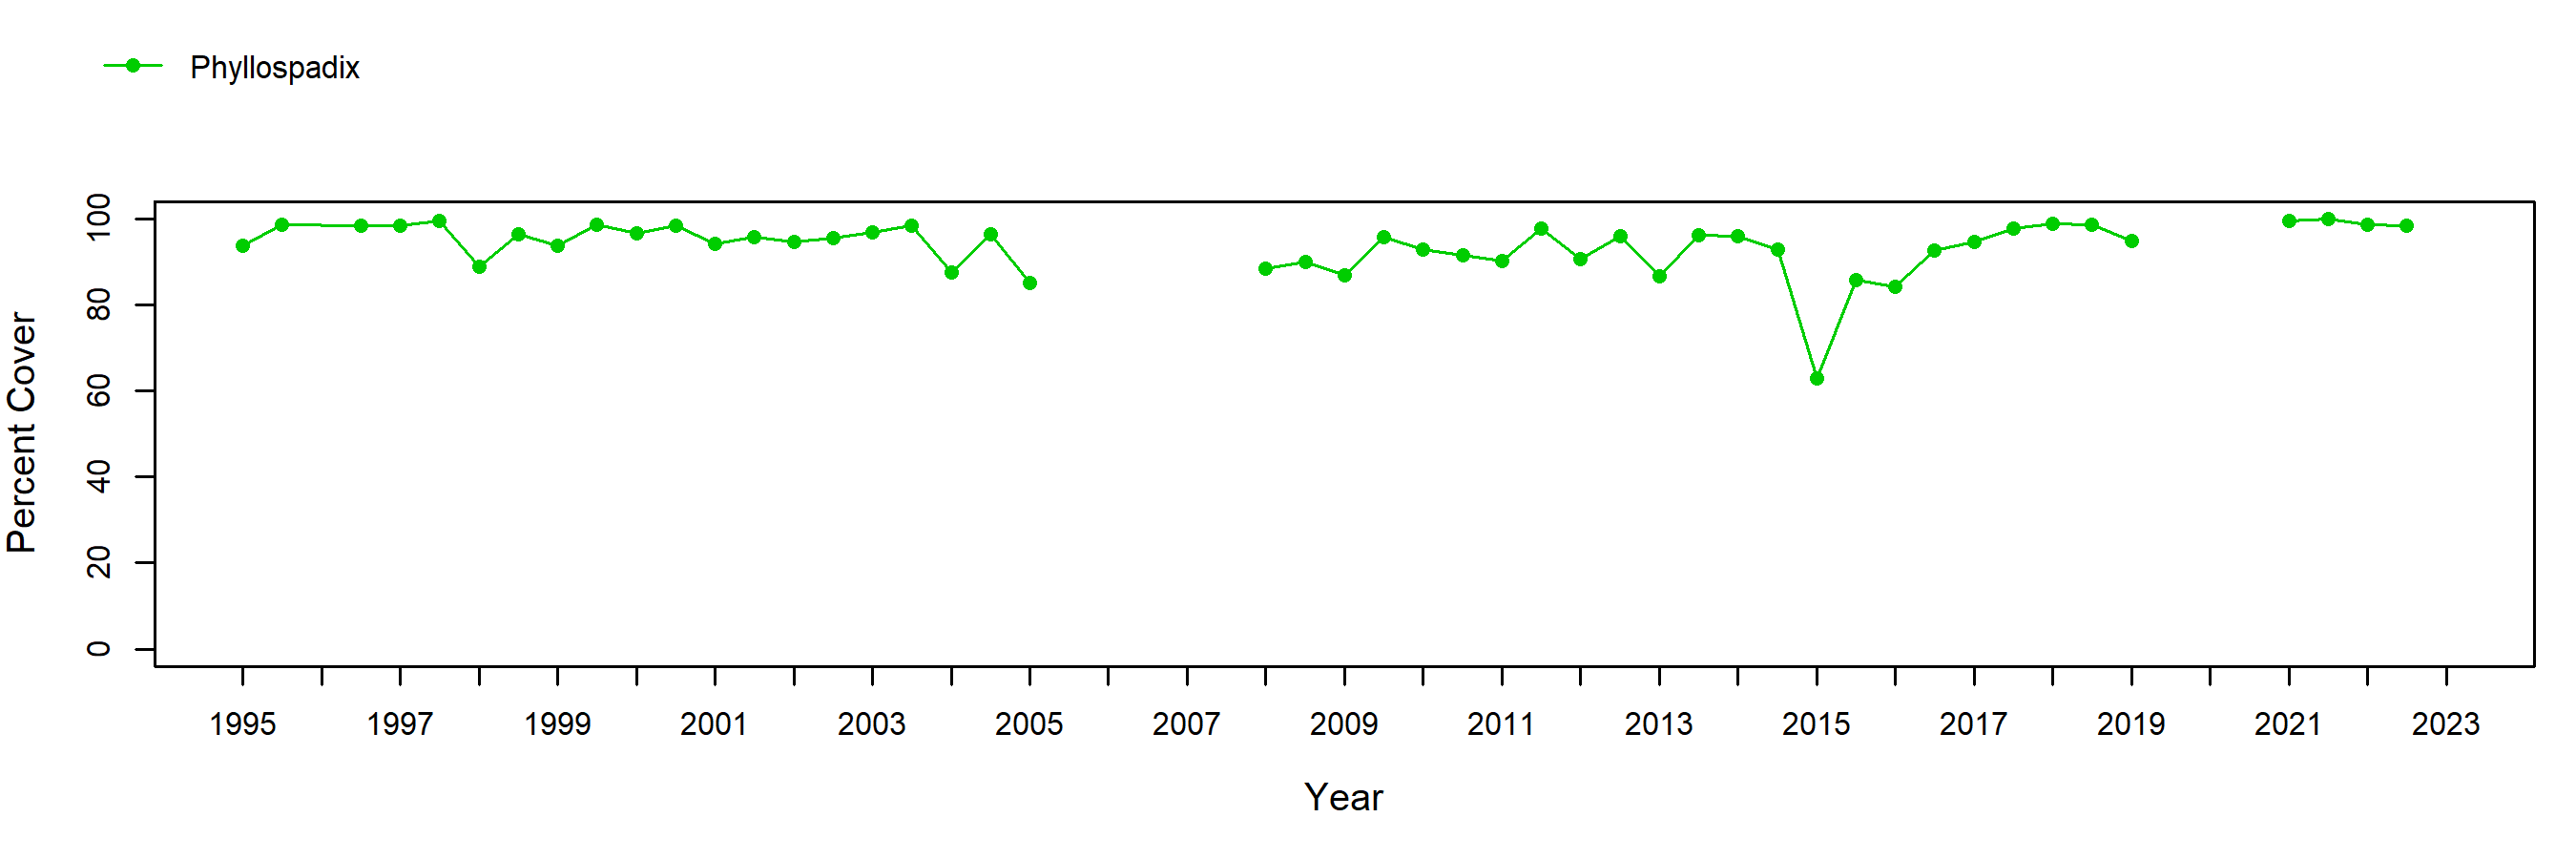
Surfgrass (Phyllospadix) remained at ~90% or higher cover throughout the monitoring period. There was a slight tendency for Phyllospadix to be more common in fall compared to spring seasons. Typical in spring surveys, portions of the surfgrass habitat appeared thinned out, tattered, and bleached. These conditions apparently were associated with storm damage coupled with aerial exposure to midday low tides during winter months.
Photo Plots
Below are the trends observed for each Photo Plot target species at this site. Long-Term percent cover trend graphs also include any species that reached a minimum of 25% cover during any single point in time within a given target species assemblage. Breaks in trend lines represent missed sampling events. For additional species observed that did not meet this 25% threshold, please use the Interactive Map.
Tetraclita (Pink Barnacle)
Pollicipes (Goose Barnacle)
Mytilus (California Mussel)
Silvetia (Golden Rockweed)
Transects
Below are the trends observed for each Transect target species at this site. Long-Term trend graphs also include any species that reached a minimum of 25% cover during any single point in time within a given target species assemblage. Breaks in trend lines represent missed sampling events.
Red Algal Turf
Phyllospadix (Surfgrass)
Species Counts and Sizes
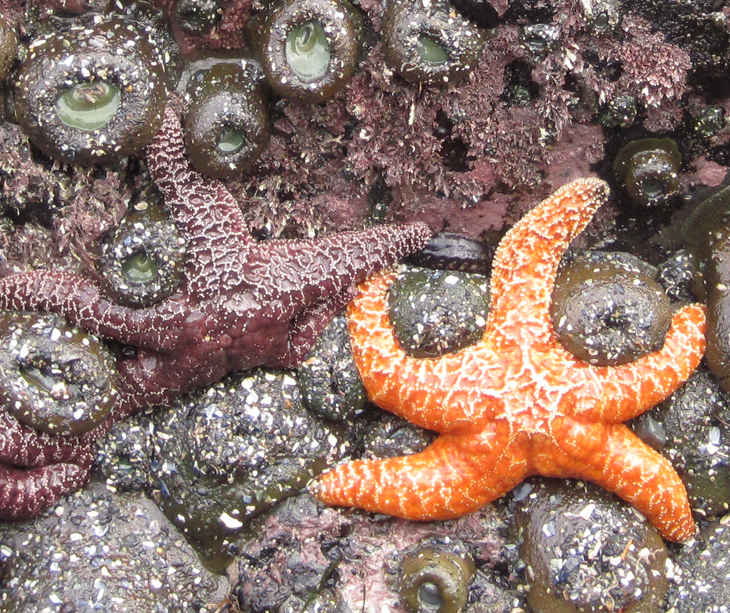
Species Counts and Sizes (where recorded) for Pisaster are shown below for this site. At some sites, other sea star species and Katharina are counted in addition to Pisaster. The sum of all individuals across all plots is displayed. Note that data gaps are represented by breaks in long-term count trend lines, but are not shown in size plots.
Pisaster (Ochre Star)
Plots were sampled regularly at this site, but no Pisaster were observed.
