Santa Maria Creek Long-Term trends | MARINe
Santa Maria Creek Long-Term trends
See below for trend graphs
In order to standardize species resolution across all MARINe groups, and over time, some species (typically rare) were lumped for graphical presentation of Long-Term monitoring data. See lumped categories for definitions (some variation occurs between methods and over time).
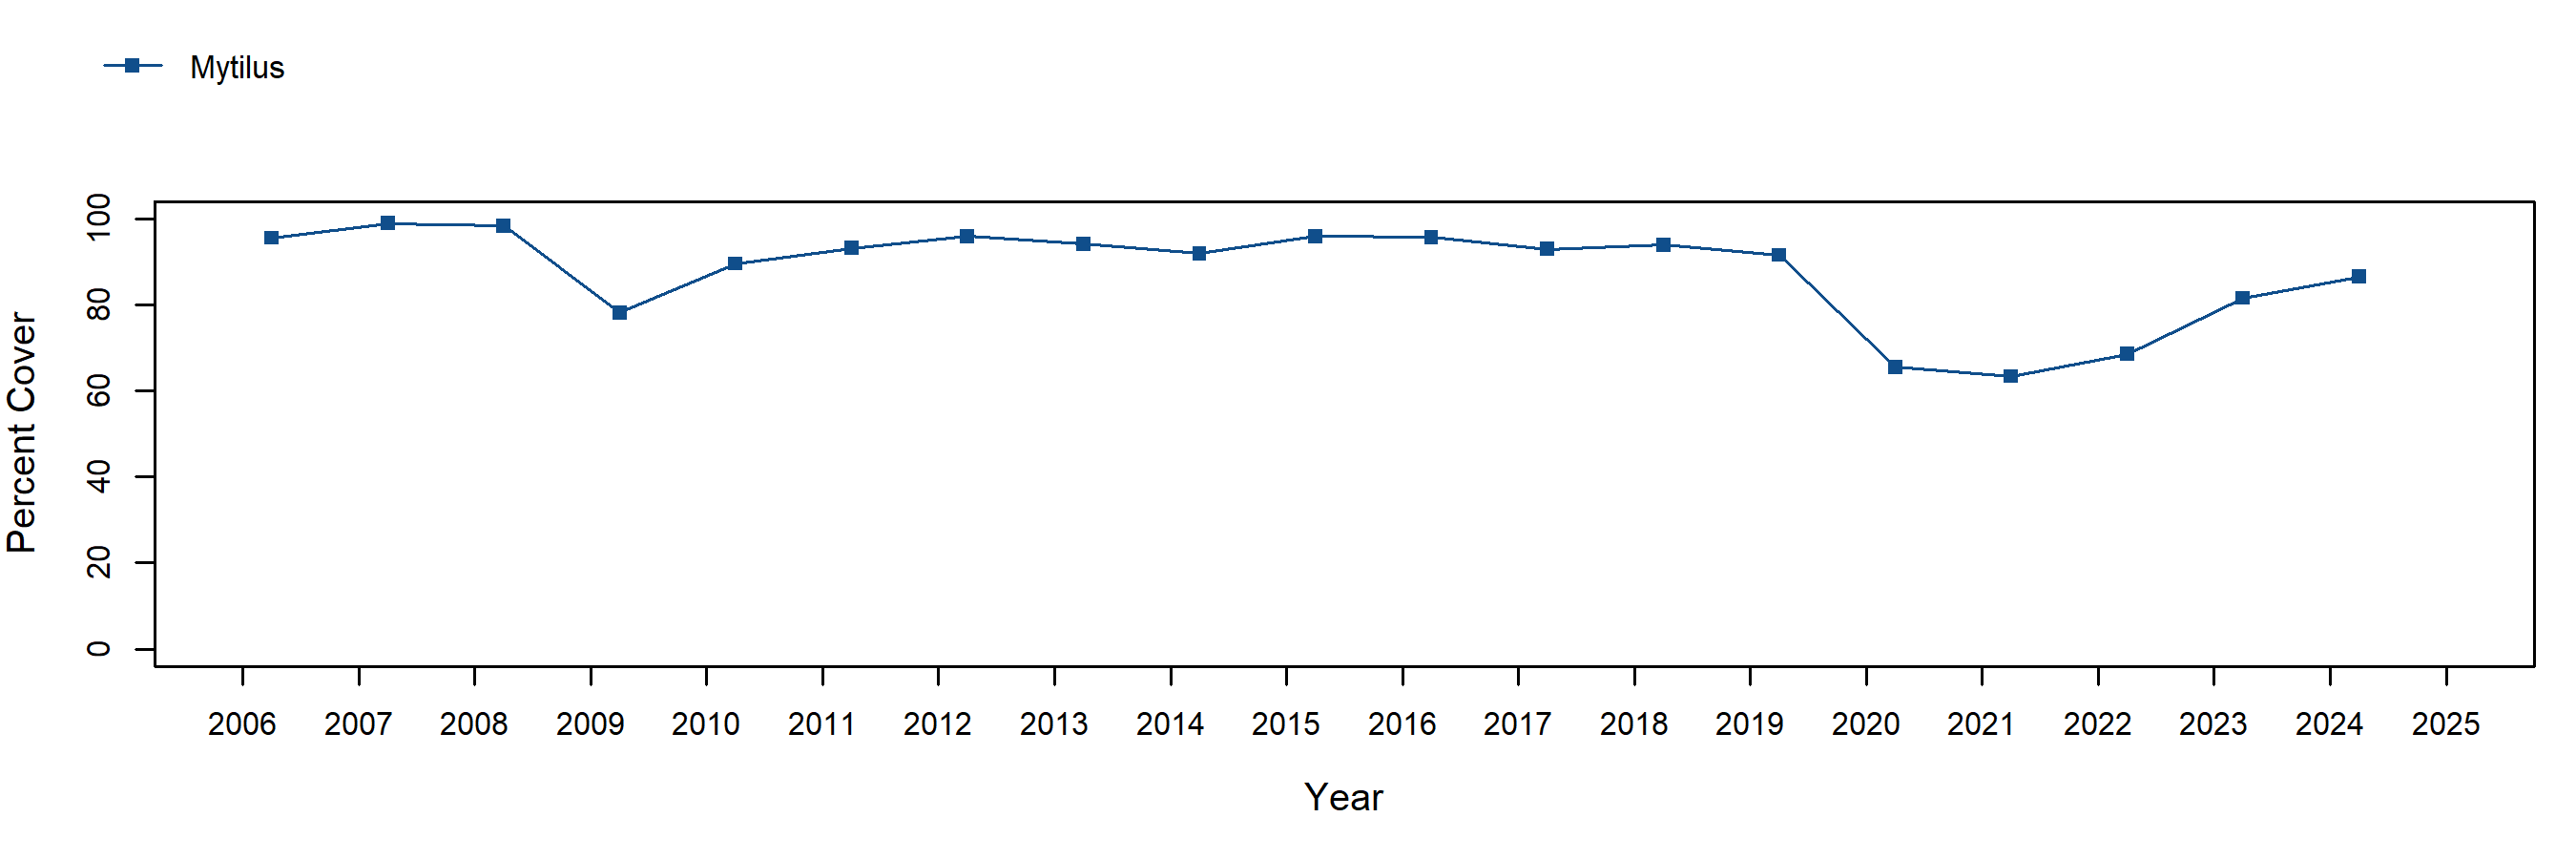
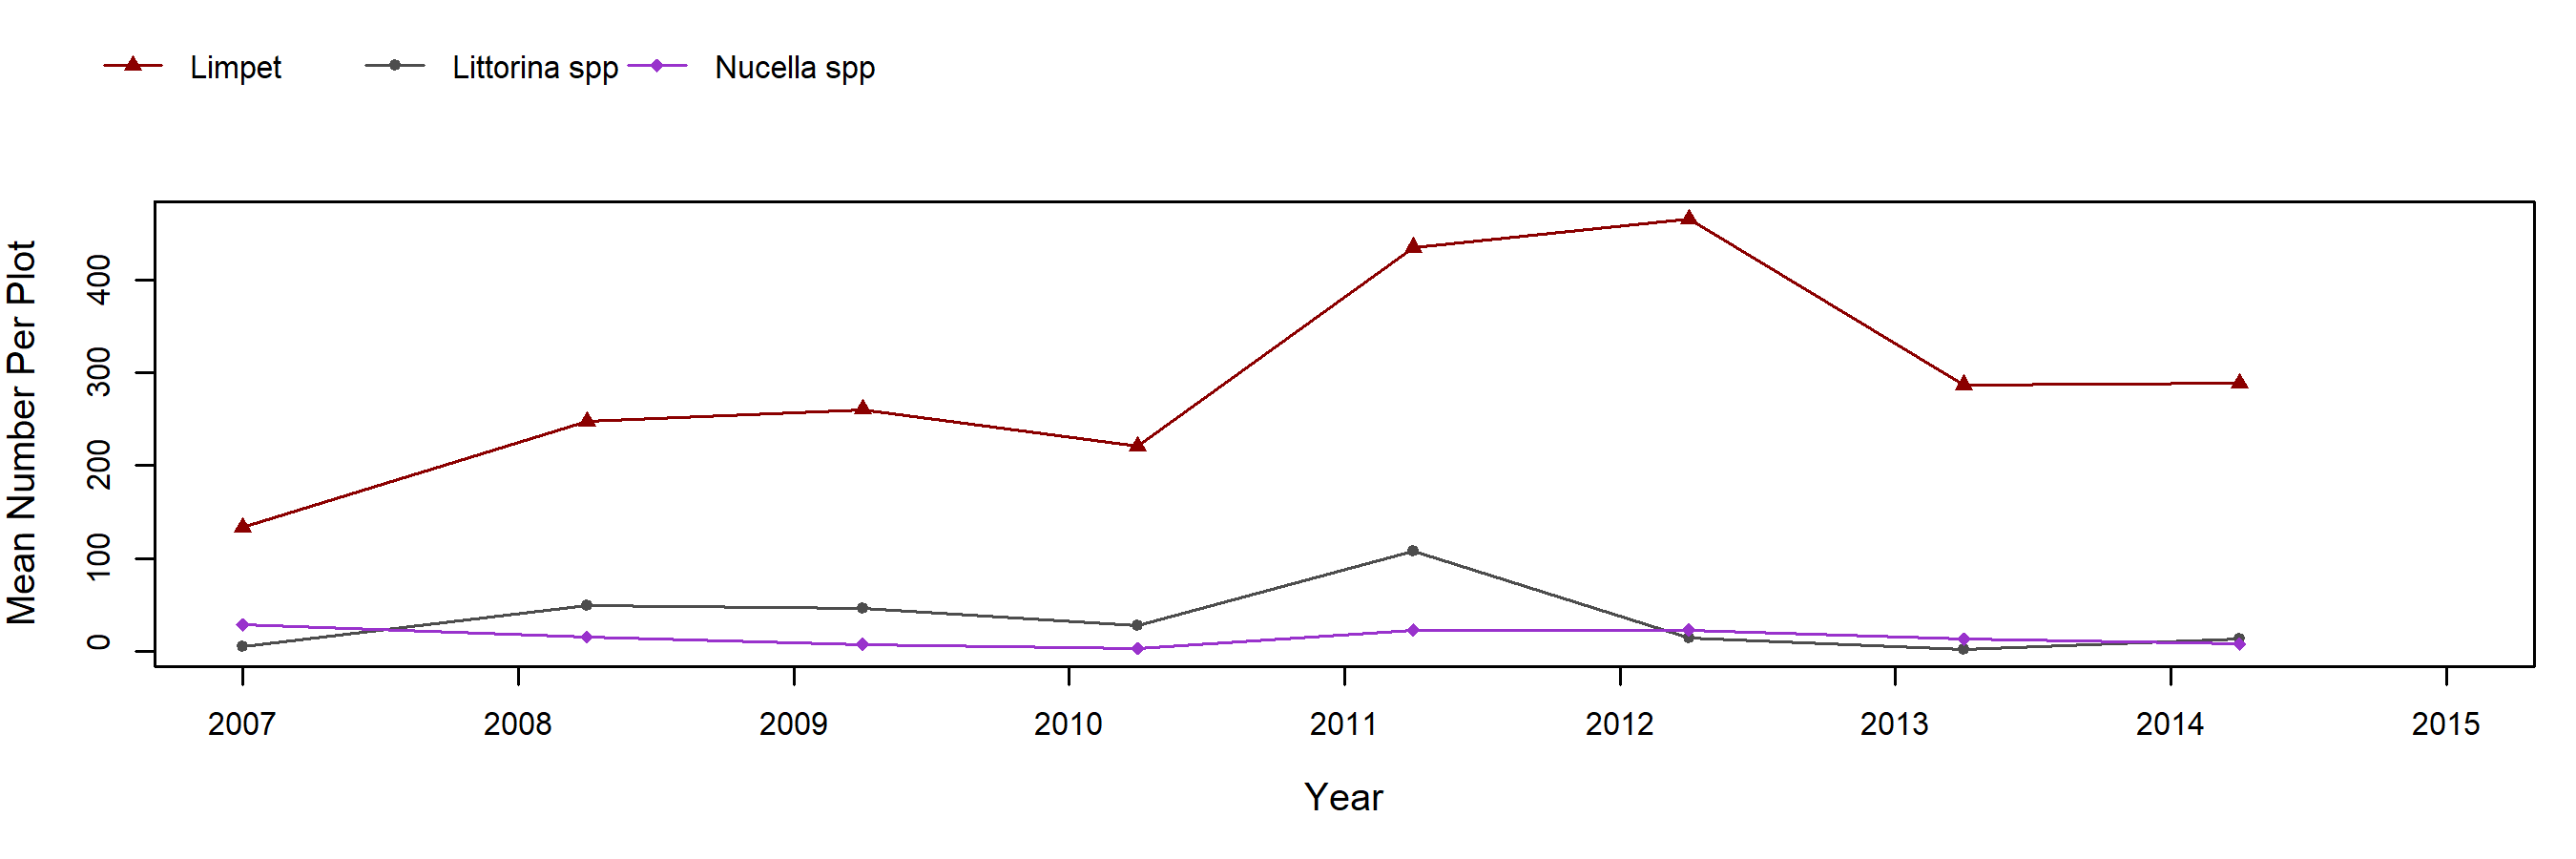
Mytilus californianus cover in mussel plots was high and rather stable at Santa Maria Creek, with average percent cover > 90% in all years but 2009. Rock generally made up the remainder of cover within the plots. This pattern of continuously high mussel cover is similar to that observed at Bolinas Point and Slide Ranch which are nearby Long-Term Monitoring sites also located in the Gulf of the Farallones. This stretch of coastline is afforded some protection from strong winter northwest swells by the Point Reyes Peninsula. This protection may contribute to the lasting integrity of the mussel beds. The numerically dominant motile invertebrates observed in mussel plots were limpets, Littorina spp. and Nucella spp. Limpet and Littorina abundances increased during the four years in which surveys took place while the abundance of Nucella declined somewhat. Since mussel cover remained high in the plots during all four years, changes in the displayed motile invertebrate abundances could not have been due to substrate alteration.
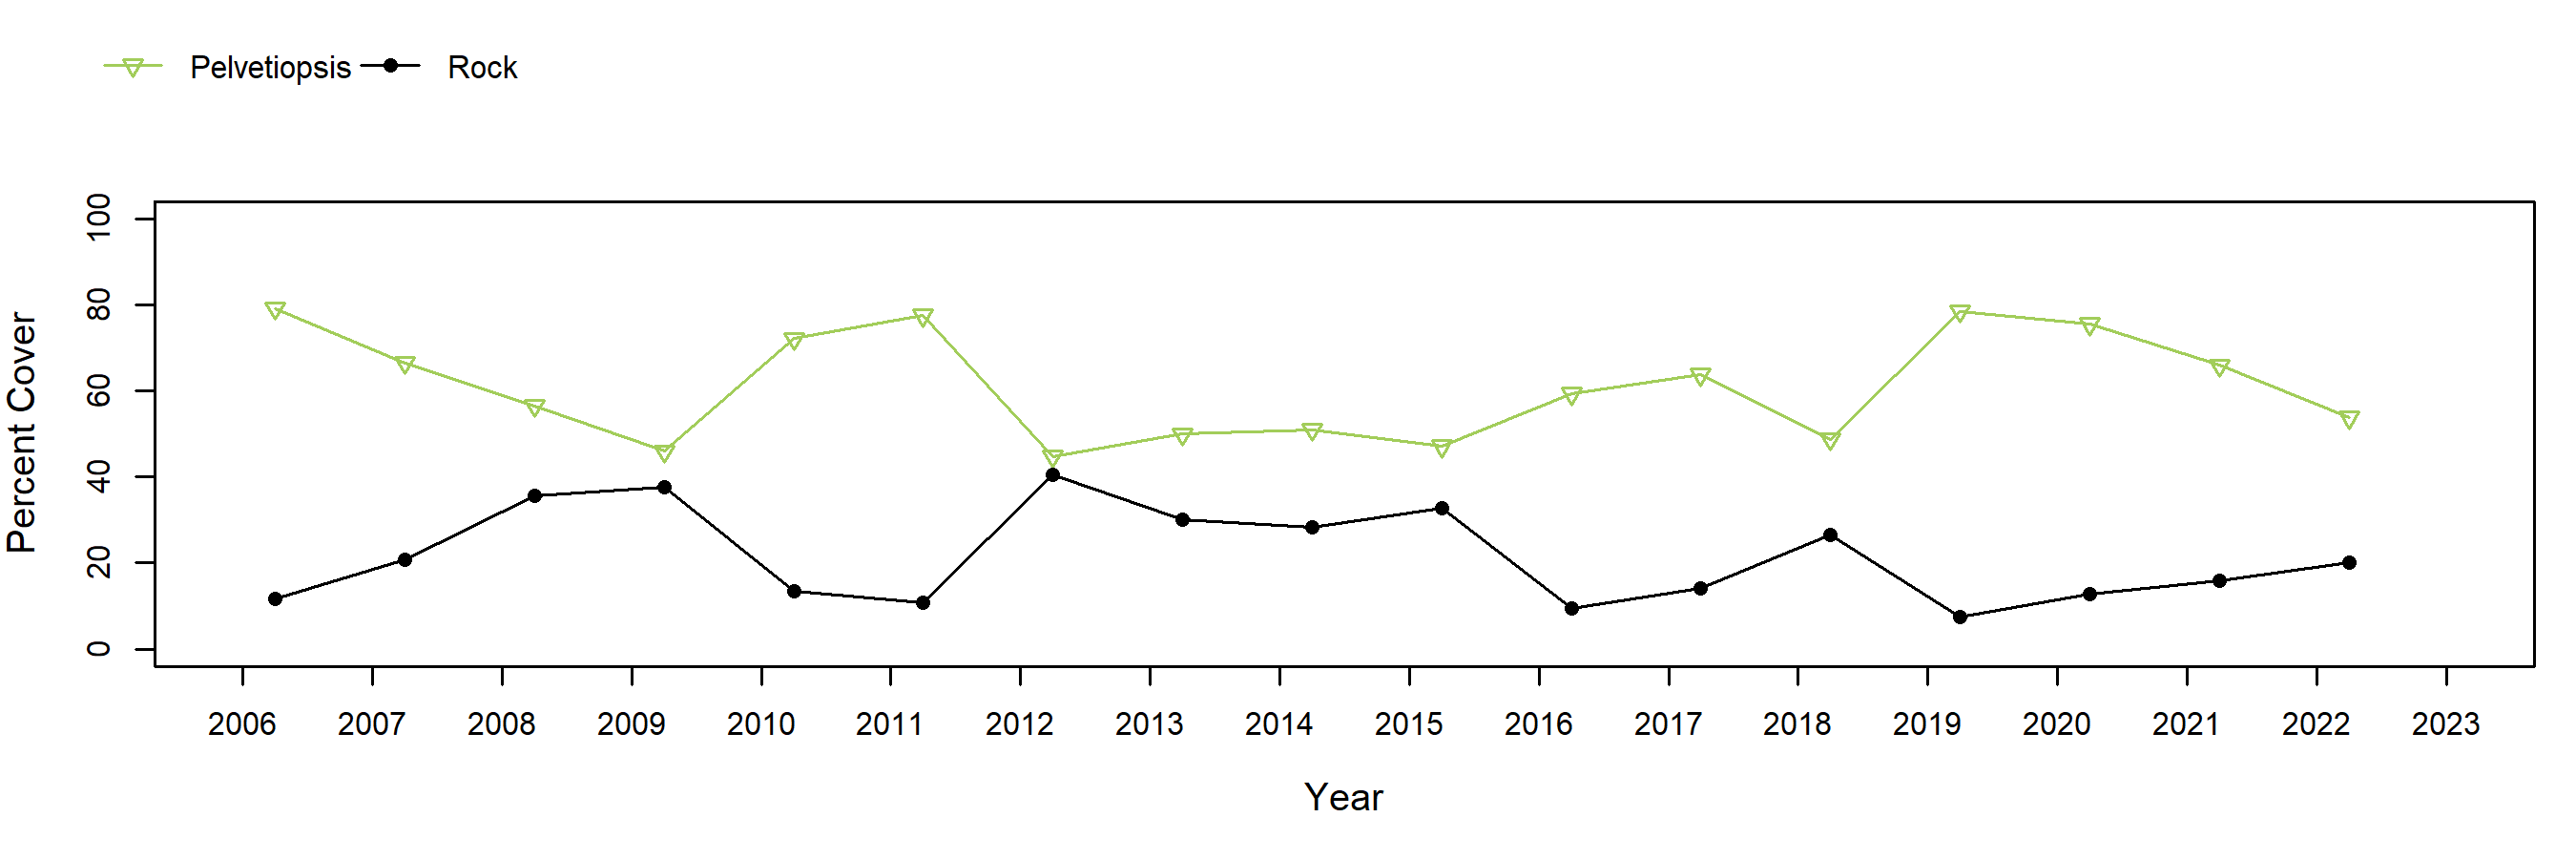
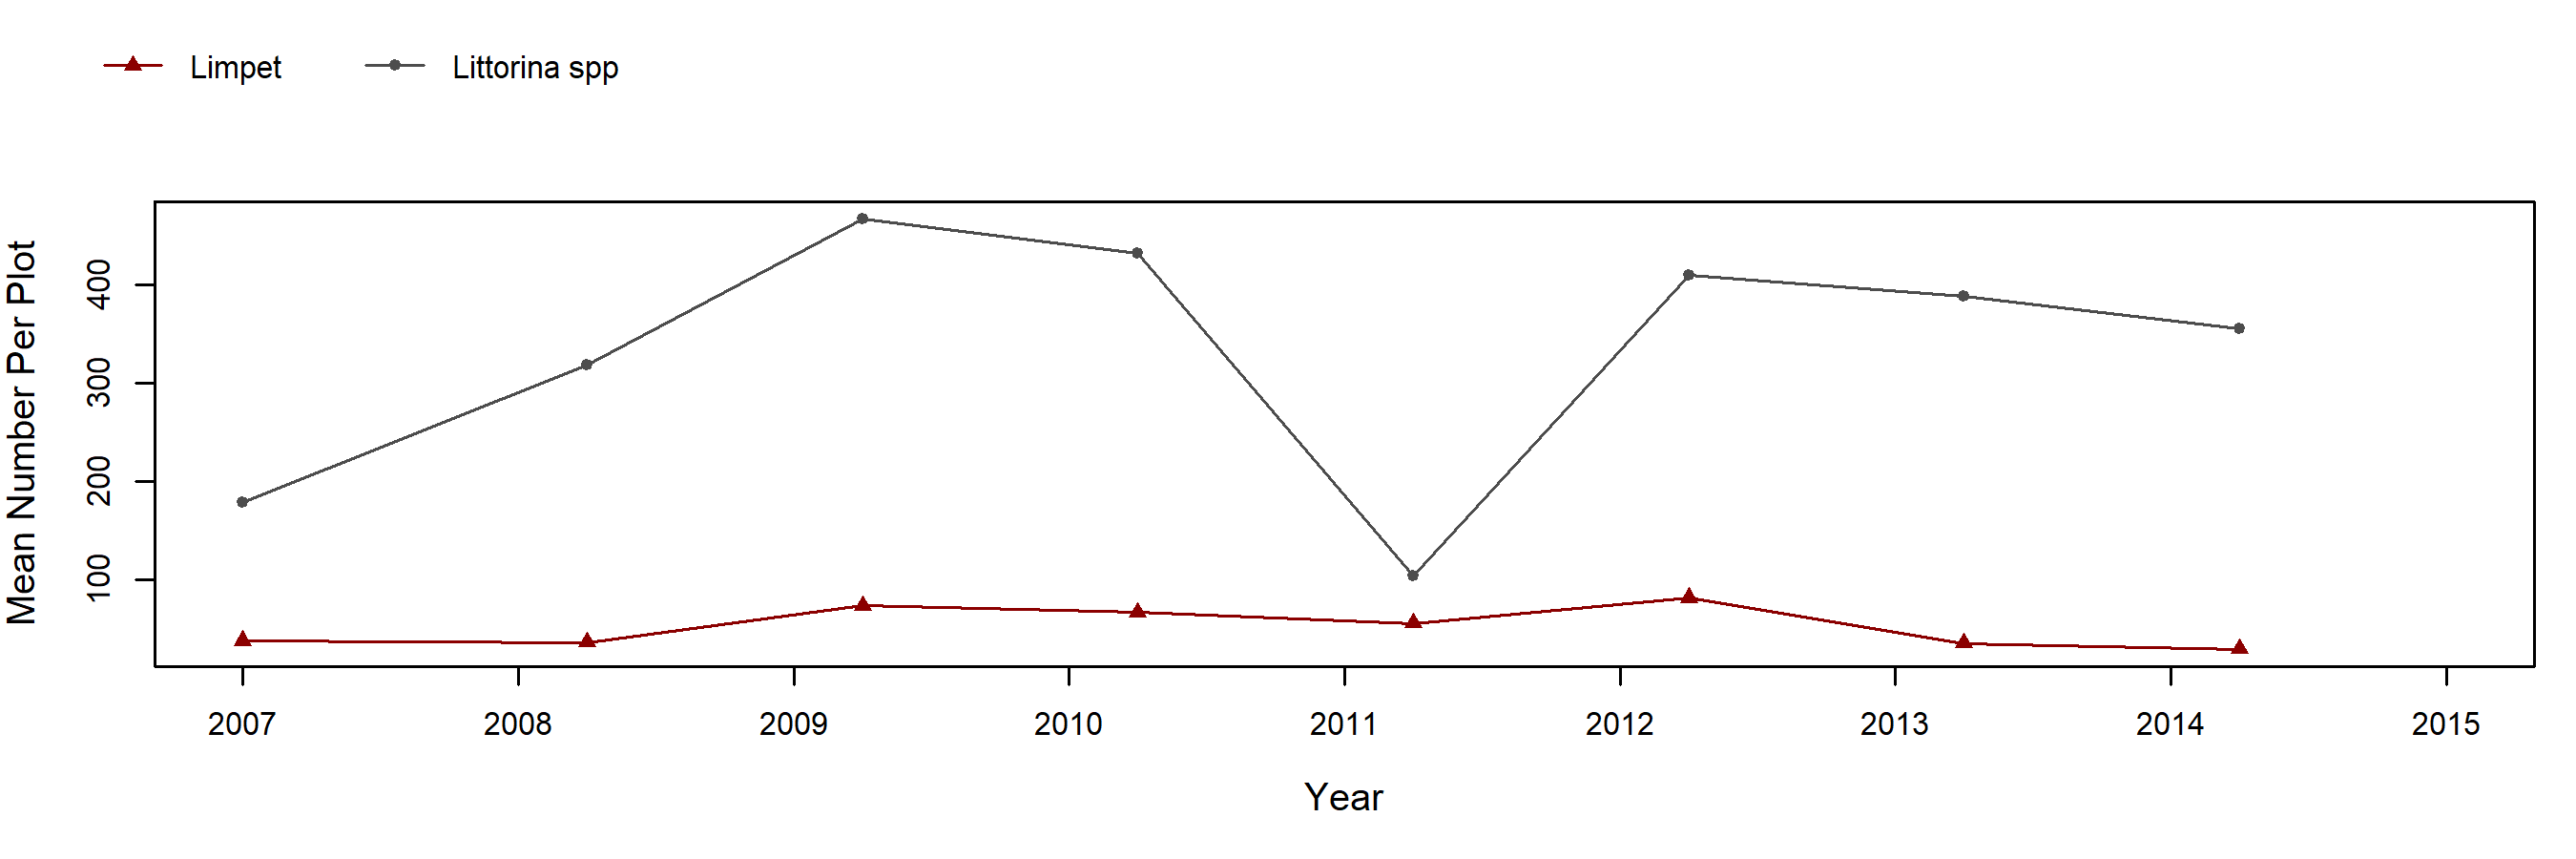
Pelvetiopsis limitata cover in Pelvetiopsis plots at Santa Maria Creek declined monotonically from 79% in 2006 to 46% in 2009 with a rise in cover occurring in 2010 (72%). Rock was the most common cover type in plot regions where Pelvetiopsis did not occur but barnacles and mussels were also recorded. The numerically dominant motile invertebrates observed in Pelvetiopsis plots were limpets and Littorina spp. Limpet and Littorina abundances increased with Littorina counts roughly doubling from 178 per plot in 2007 to 467 in 2009. Counts diminished slightly to 432 in 2010. Limpets and Littorina had abundance patterns which were the reciprocal of Pelvetiopsis percent cover suggesting that these taxa prefer rock to Pelvetiopsis habitat.
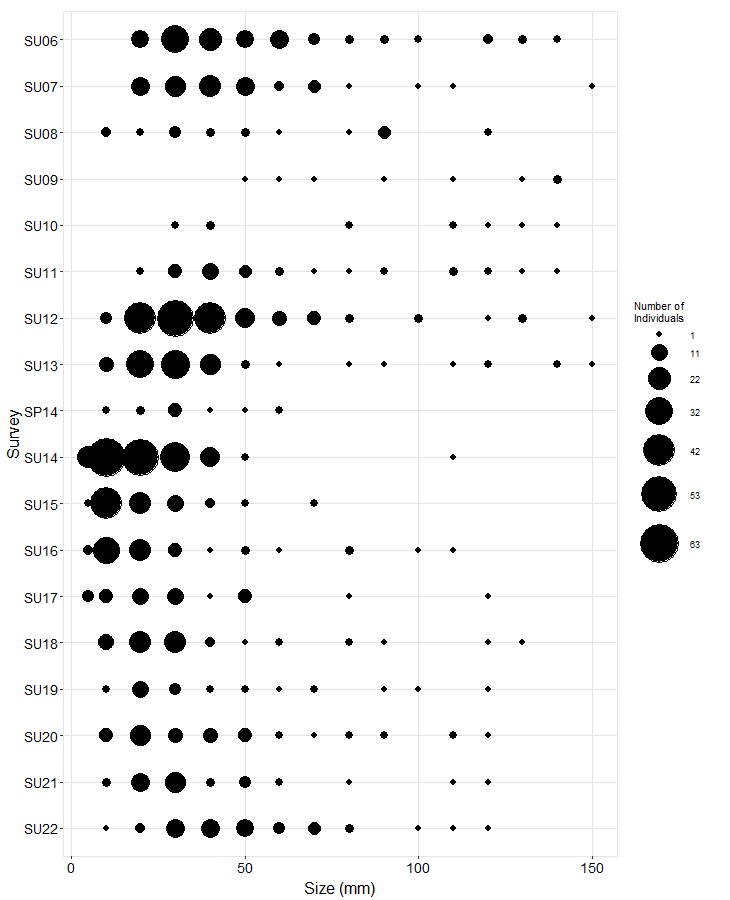
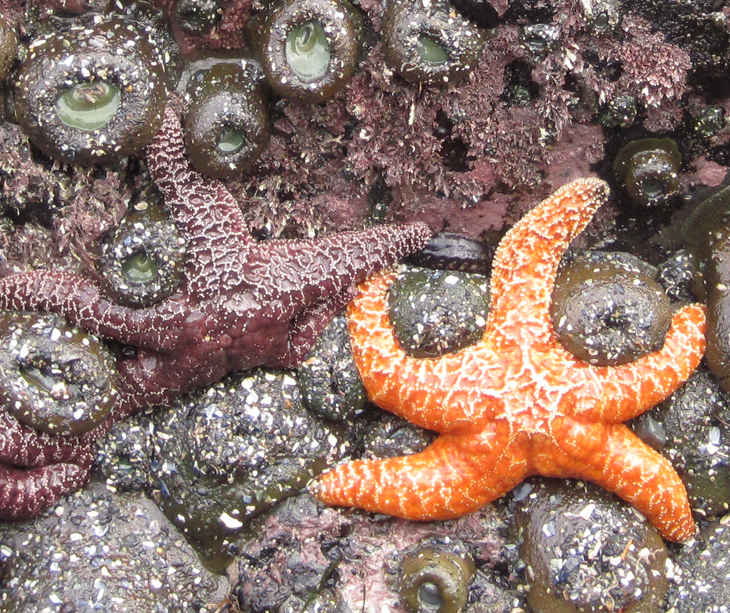
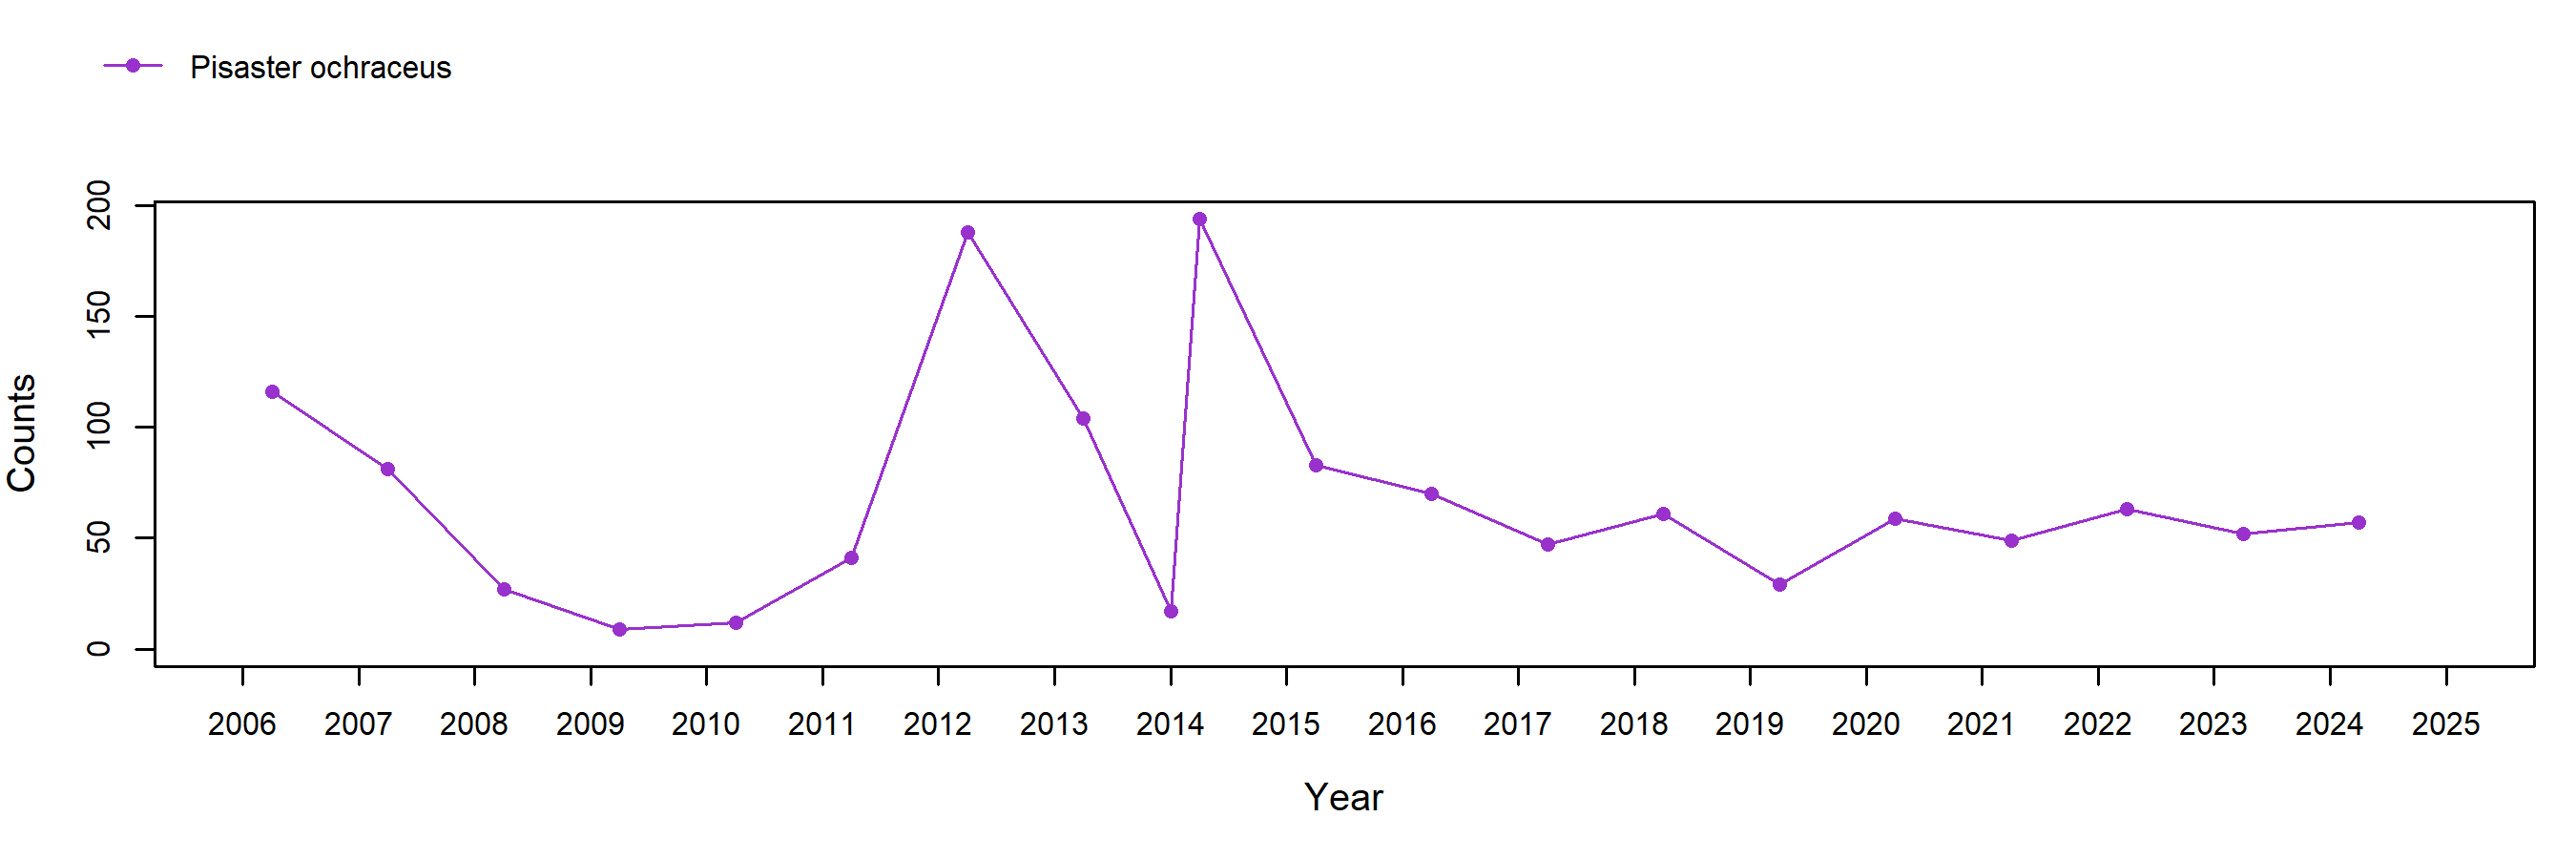
Seastars (Pisaster ochraceus) at Santa Maria Creek underwent a large decline in numbers from 2006 to 2010. The seastar size frequency plots show that the high numbers of seastars seen in 2006 and 2007 were largely composed of small (20mm to 60mm) newly settled individuals. Episodic starfish recruitment likely accounted for the high numbers in 2006 and 2007. This recruitment did not occur in 2009 and 2010 resulting in much lower starfish counts. Pisaster abundance reported by the Biodiversity Surveys was much higher in 2005 than in 2002 or 2010 suggesting that good seastar recruitment occurred in 2005 as well as 2006 and 2007.
Photo Plots
Below are the trends observed for each Photo Plot target species at this site. Long-Term percent cover trend graphs also include any species that reached a minimum of 25% cover during any single point in time within a given target species assemblage. Breaks in trend lines represent missed sampling events. For additional species observed that did not meet this 25% threshold, please use the Interactive Map.
For motile invertebrate Species Counts, a mean across all plots was calculated, and only those species with a value of at least 5 individuals for at least one sample are shown. Due to time constraints, motile invertebrate counts have not been done at most sites since 2012. For motile invertebrate size trend graphs by site, please use the Interactive Map.
Mytilus (California Mussel) - percent cover
Mytilus (California Mussel) - motile invertebrate counts
Pelvetiopsis (Golden Rockweed) - percent cover
Pelvetiopsis (Golden Rockweed) - motile invertebrate counts
Species Counts and Sizes
Species Counts and Sizes (where recorded) for Pisaster are shown below for this site. At some sites, other sea star species and Katharina are counted in addition to Pisaster. The sum of all individuals across all plots is displayed. Note that data gaps are represented by breaks in long-term count trend lines, but are not shown in size plots.
Pisaster ochraceus (Ochre Star) - counts
Pisaster ochraceus (Ochre Star) - sizes