Long-Term Monitoring Trend Graphs
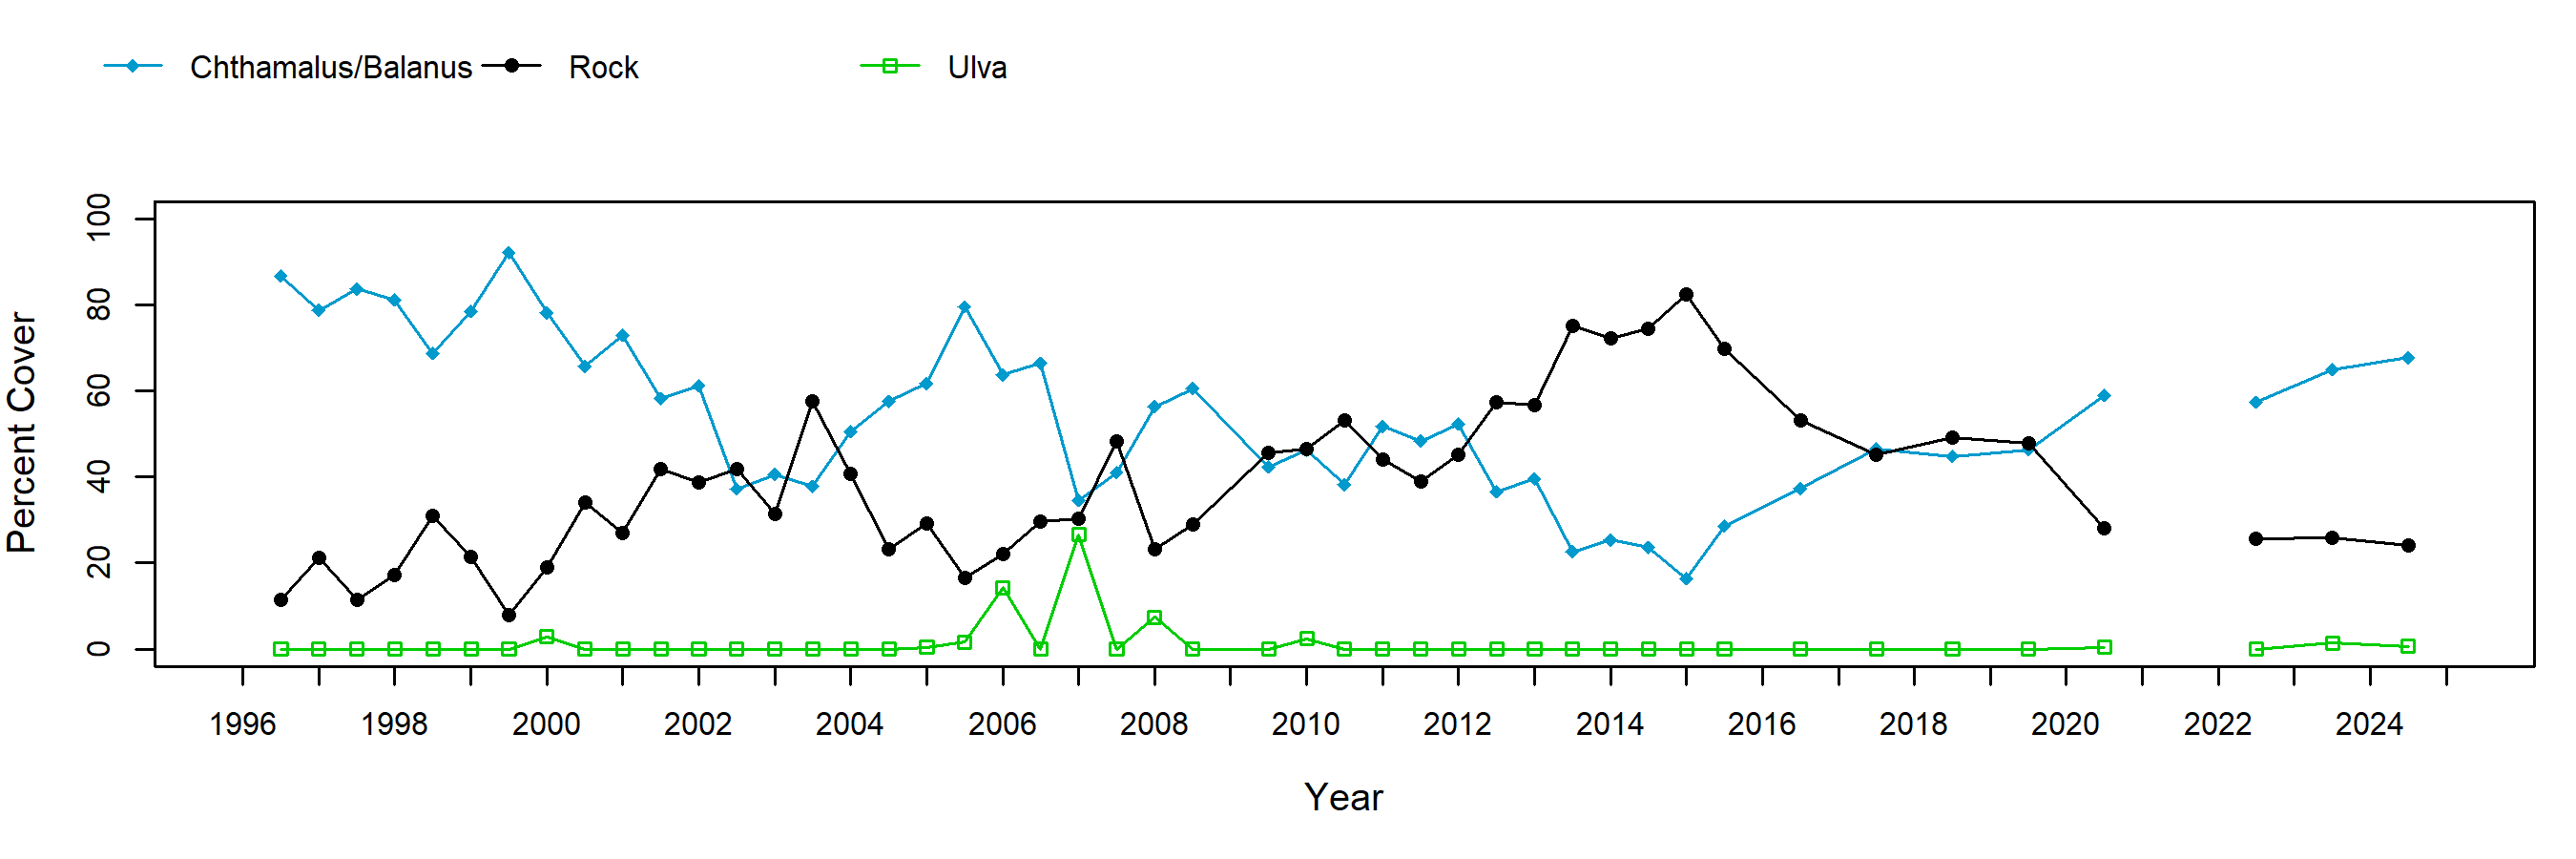
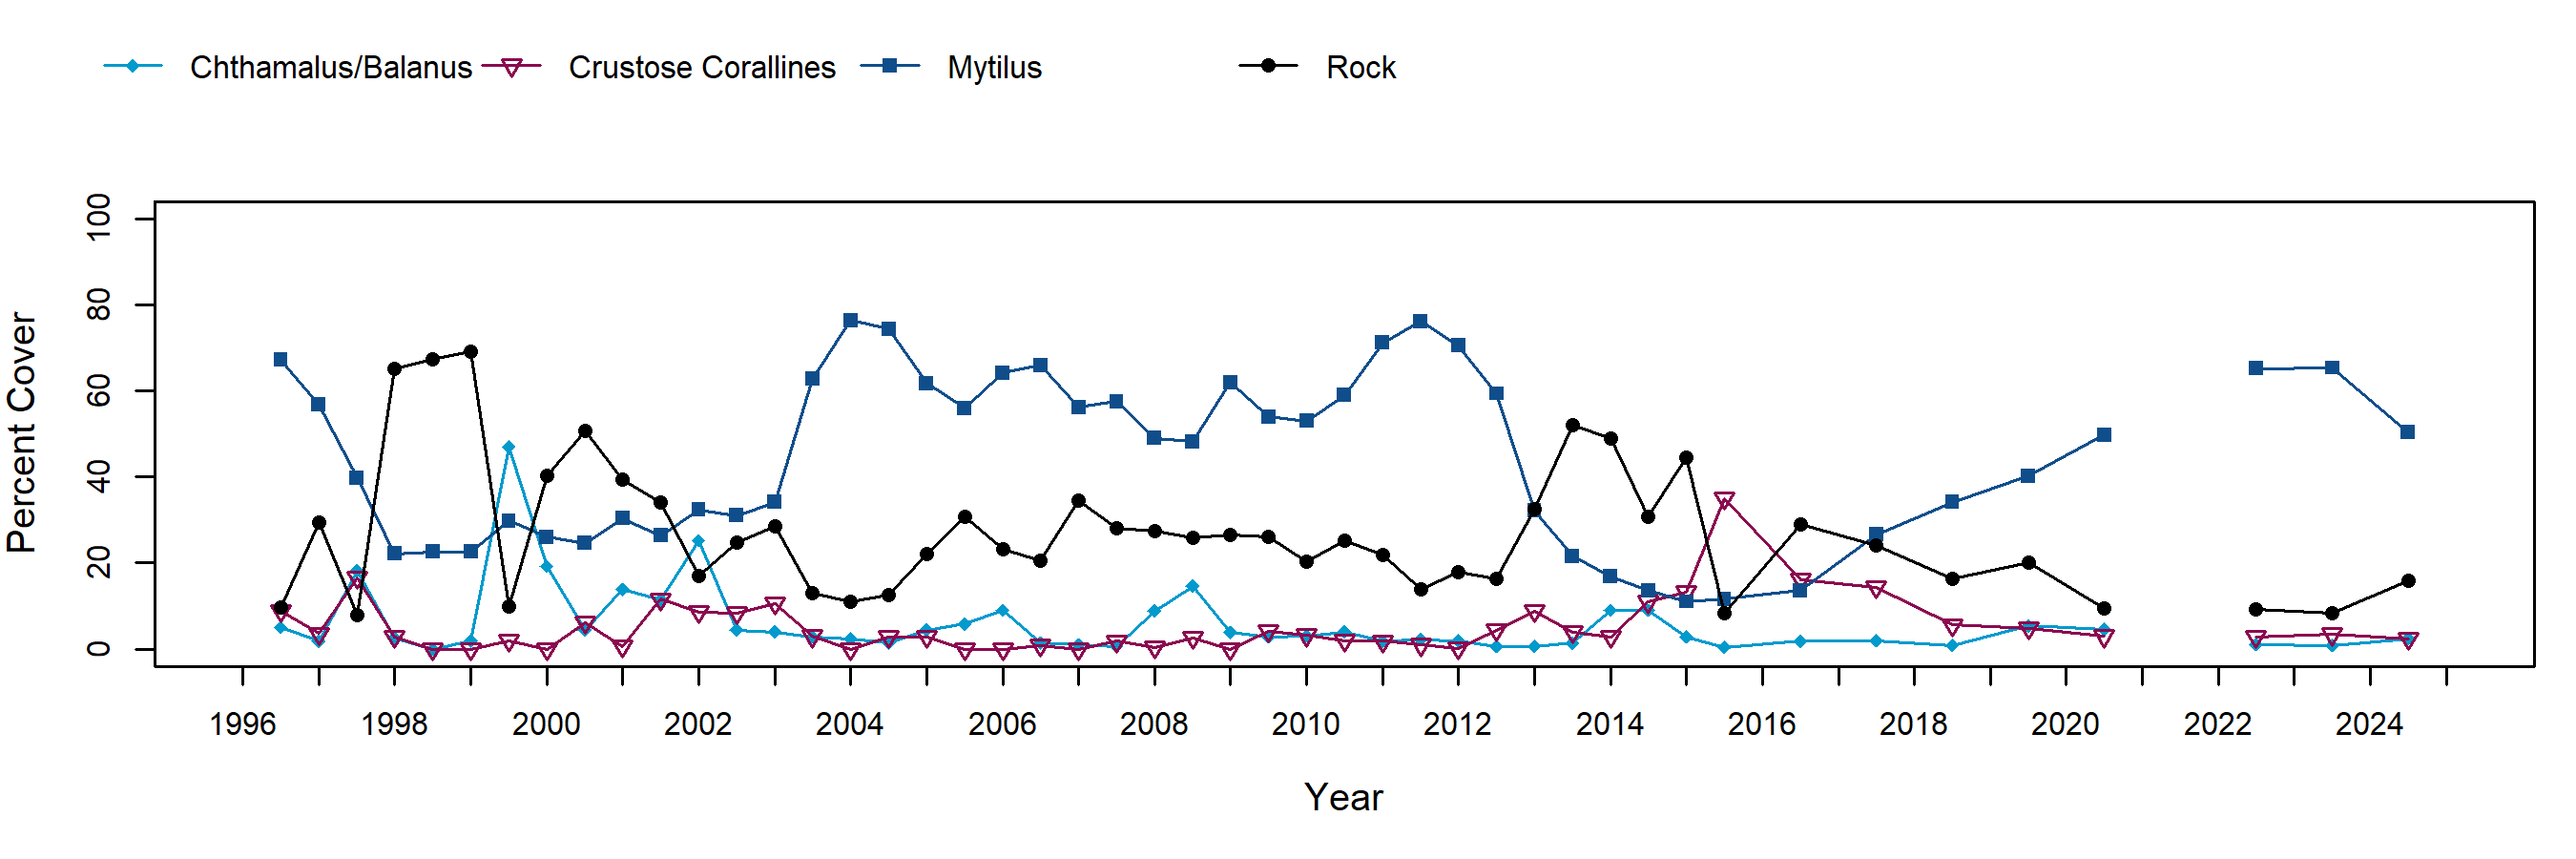
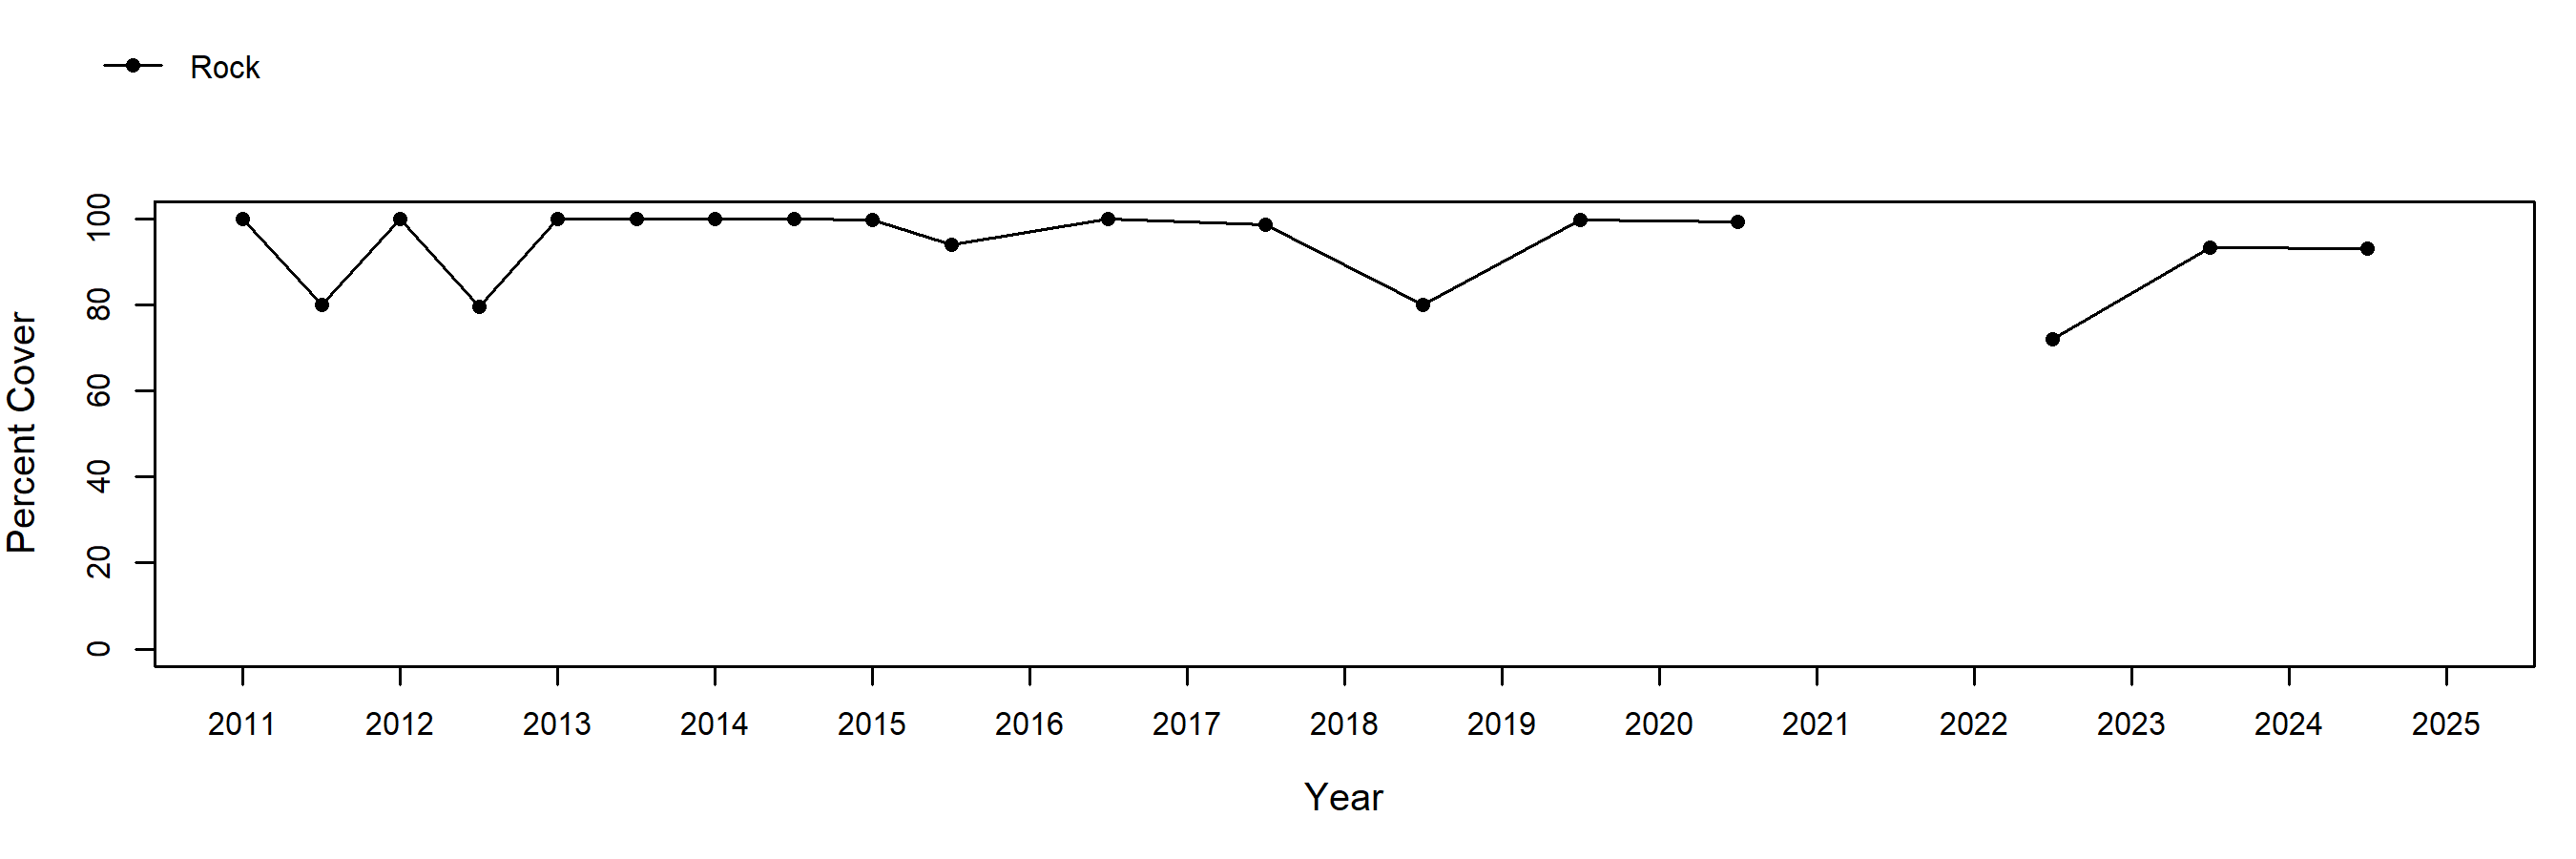
Cover of acorn barnacles in permanent plots at Treasure Island has been variable over time. Mussel cover in Mytilus plots has undergone fluctuations over time, putatively driven by storm and El Niño events. Cover of Silvetia compressa in permanent Silvetia plots was highly variable at this site over both short (seasonal) and long temporal scales. The high intertidal rockweed Pelvetiopsis (formerly Hesperophycus), initially not present in Silvetia plots, recruited at low levels into the rockweed plots in 2003, reaching a peak of 8% cover in spring, followed by a die off in fall. Pelvetiopsis cover has since remained low. Rock plots were established above the barnacle zone in spring 2011, and are heavily sand influenced, occasionally reaching 100% cover of sand in some plots.
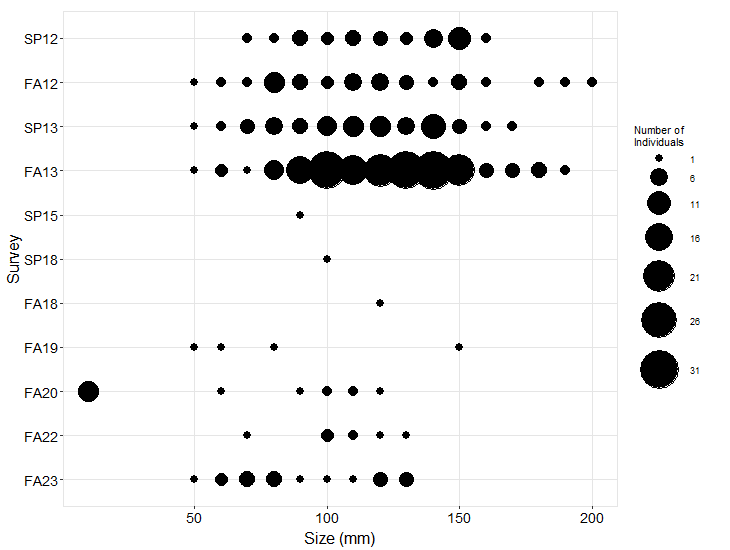
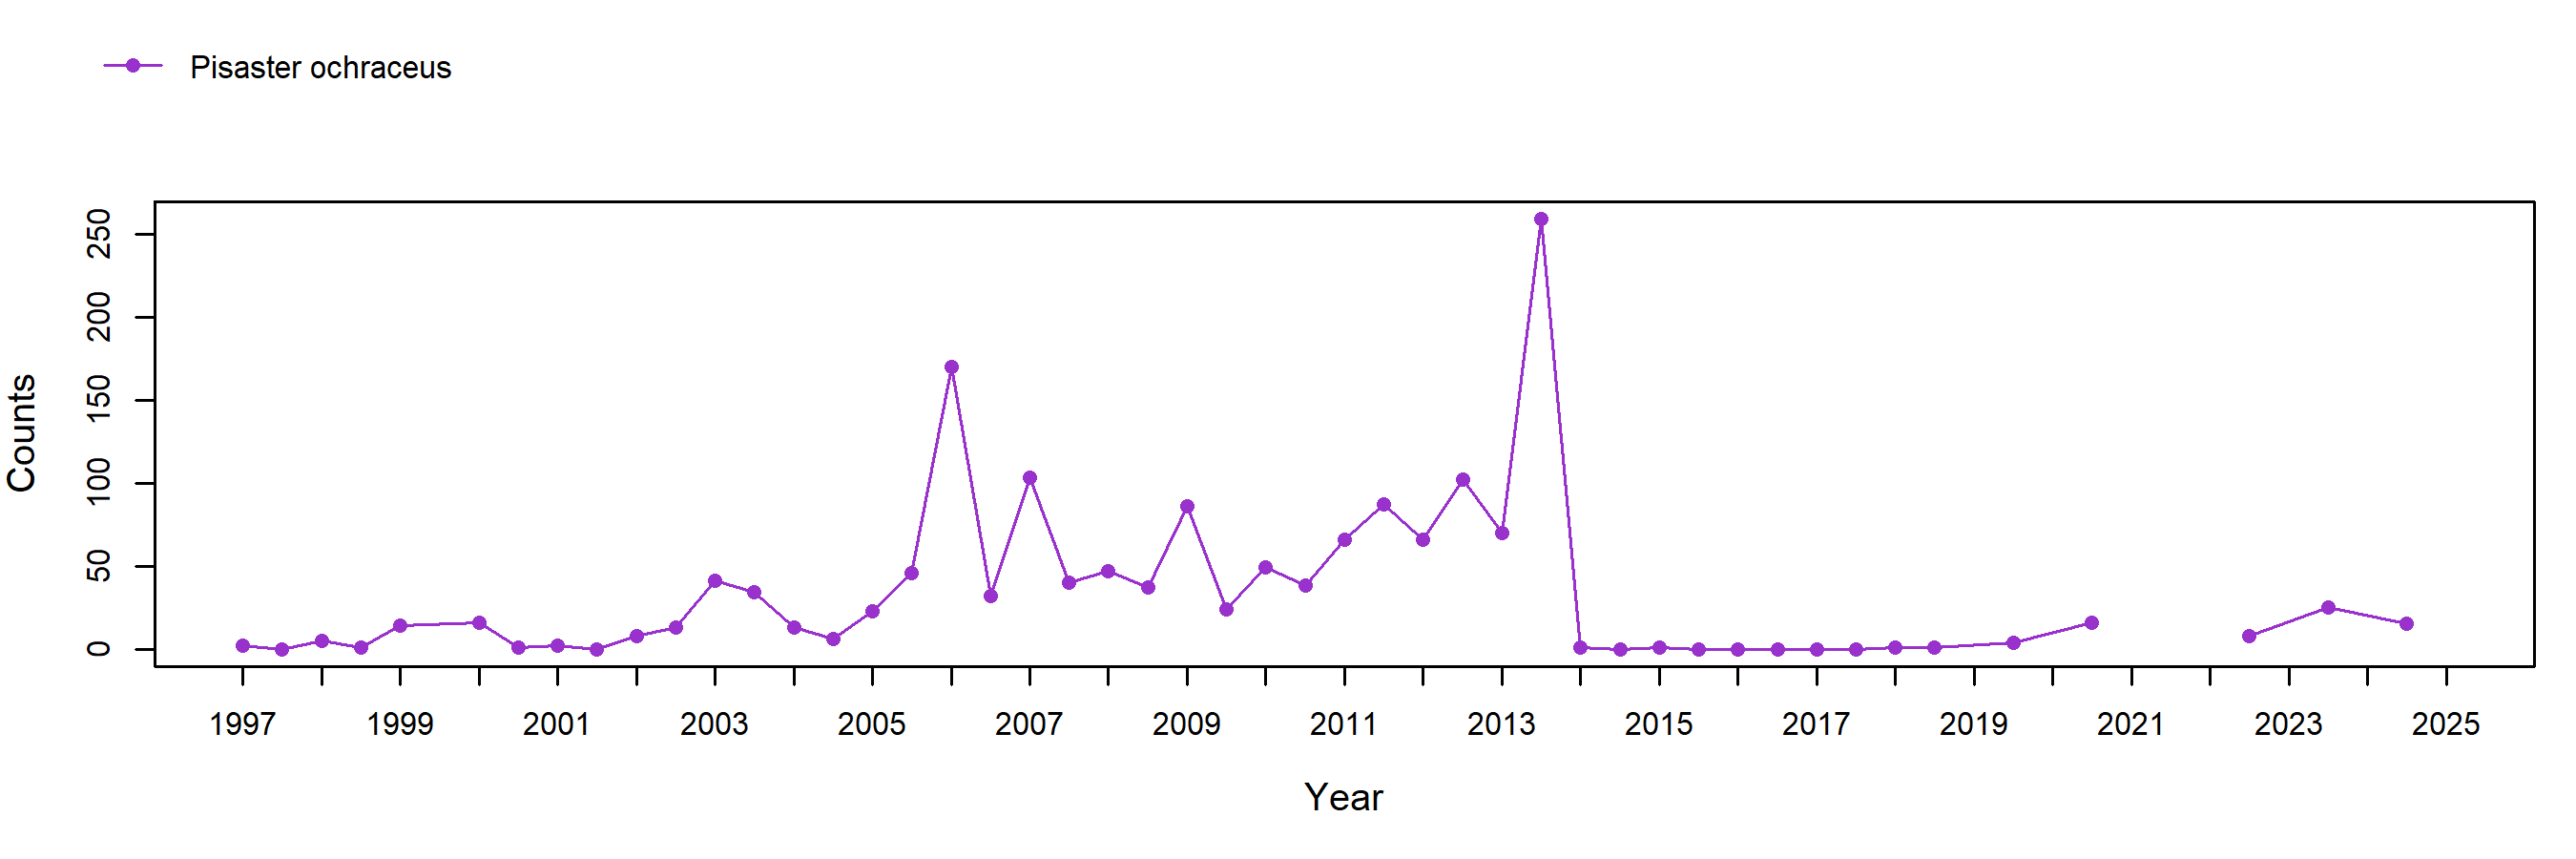
Site-wide sea star (Pisaster) counts were variable over time prior to fall 2013, when a large increase in sea star abundance was observed. During this survey, signs of Sea Star Wasting Syndrome were noted in a few individuals. In Spring 2014, no Pisaster were found at this location, and Sea Star Wasting Syndrome is a likely factor in this decline. Sea star sizes were consistently measured starting in Spring 2012. From 2012 – 2013 the population included individuals in a range of size classes (from 50 mm to 200 mm) although most individuals fell in the 100 – 150 mm size classes. Since 2013, no individuals larger than 150 mm have been encountered during monitoring surveys.
In order to standardize species resolution across all MARINe groups and over time, some species (typically rare) were lumped for graphical presentation of Long-Term monitoring data. See lumped categories for definitions (some variation occurs between methods and over time).
If you experience any barriers accessing the trend graphs below, please contact (pacificr@ucsc.edu) for help.
Photo Plots

Below are the trends observed for each Photo Plot target species at this site. Long-Term percent cover trend graphs also include any species that reached a minimum of 25% cover during any single point in time within a given target species assemblage. Breaks in trend lines represent missed sampling events. For additional species observed that did not meet this 25% threshold, please use the Graphing Tool.
Chthamalus/Balanus (Acorn Barnacles) – percent cover
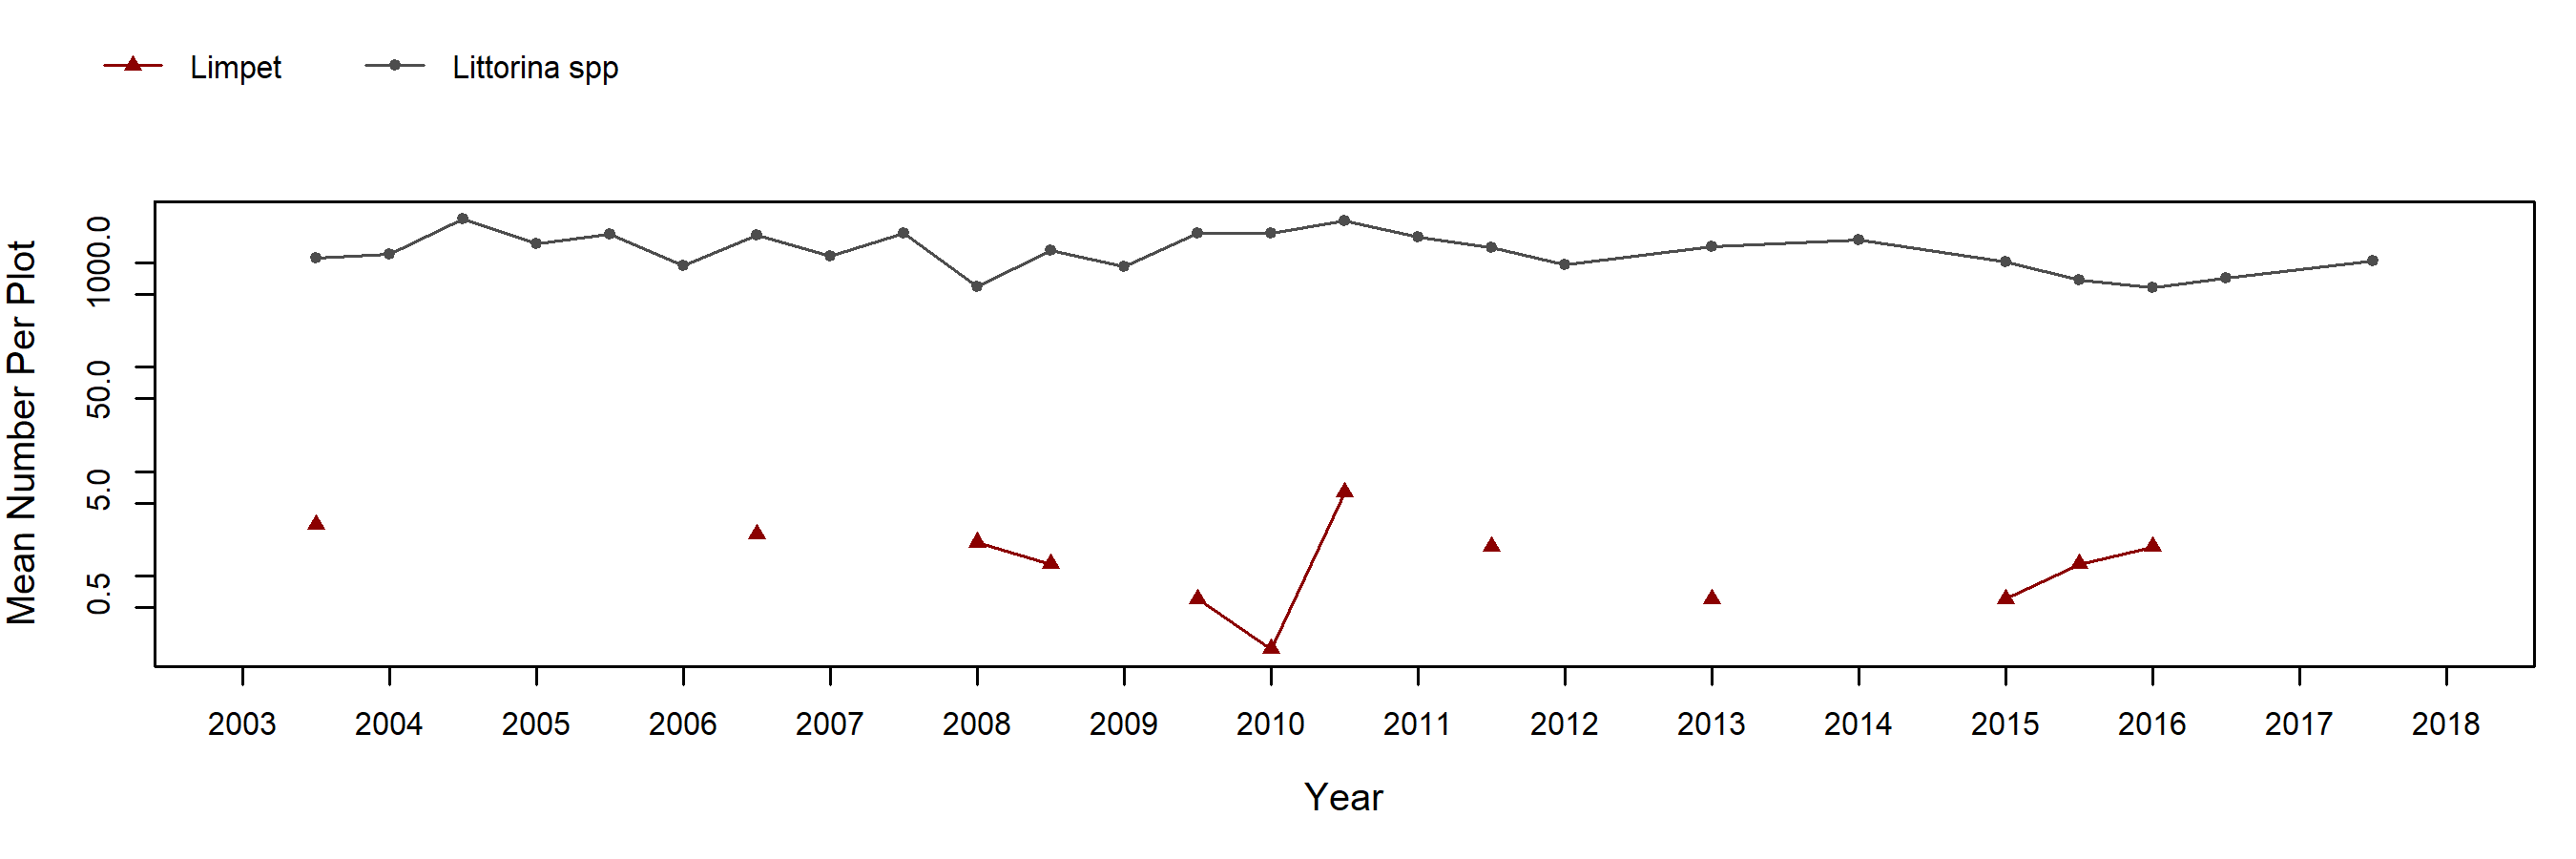
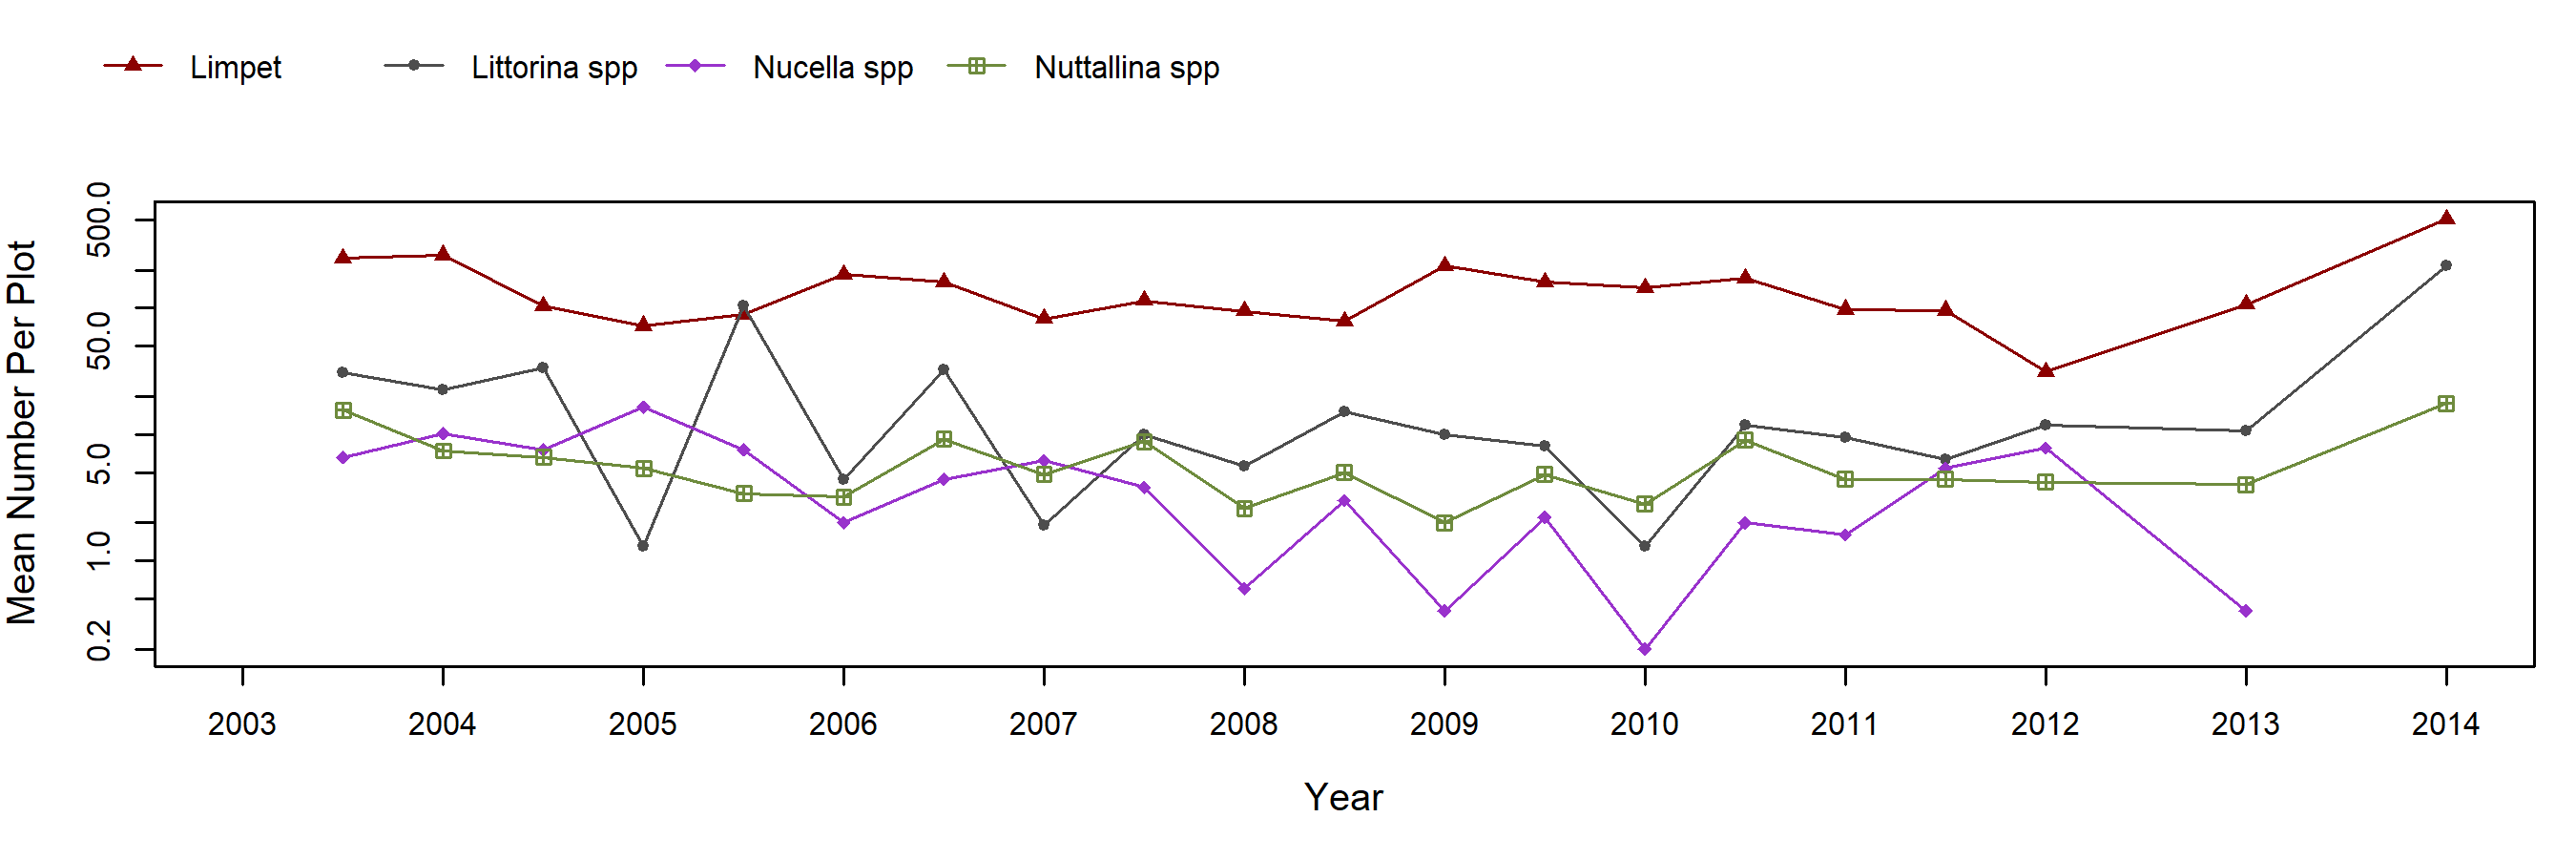
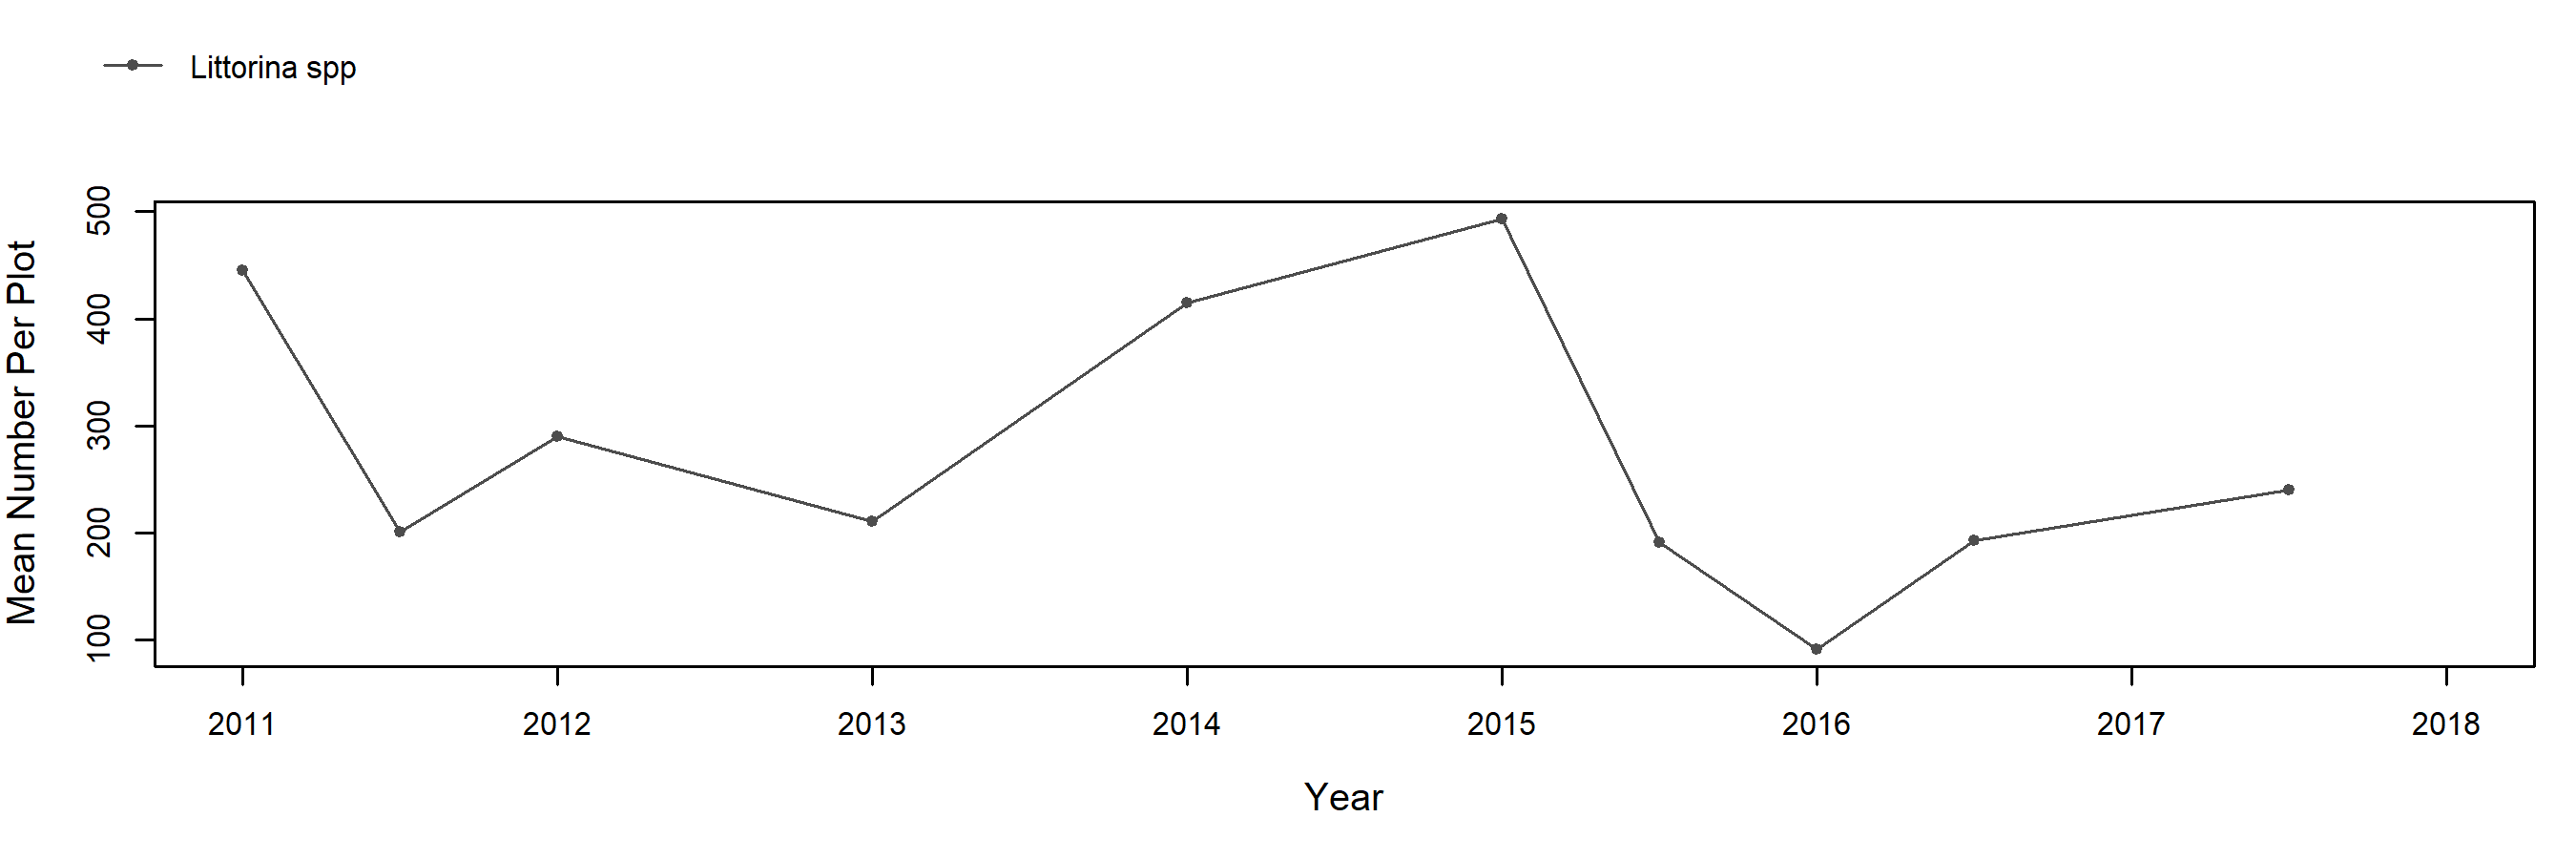
Chthamalus/Balanus (Acorn Barnacles) – motile invertebrate counts
Mytilus (California Mussel) – percent cover
Mytilus (California Mussel) – motile invertebrate counts
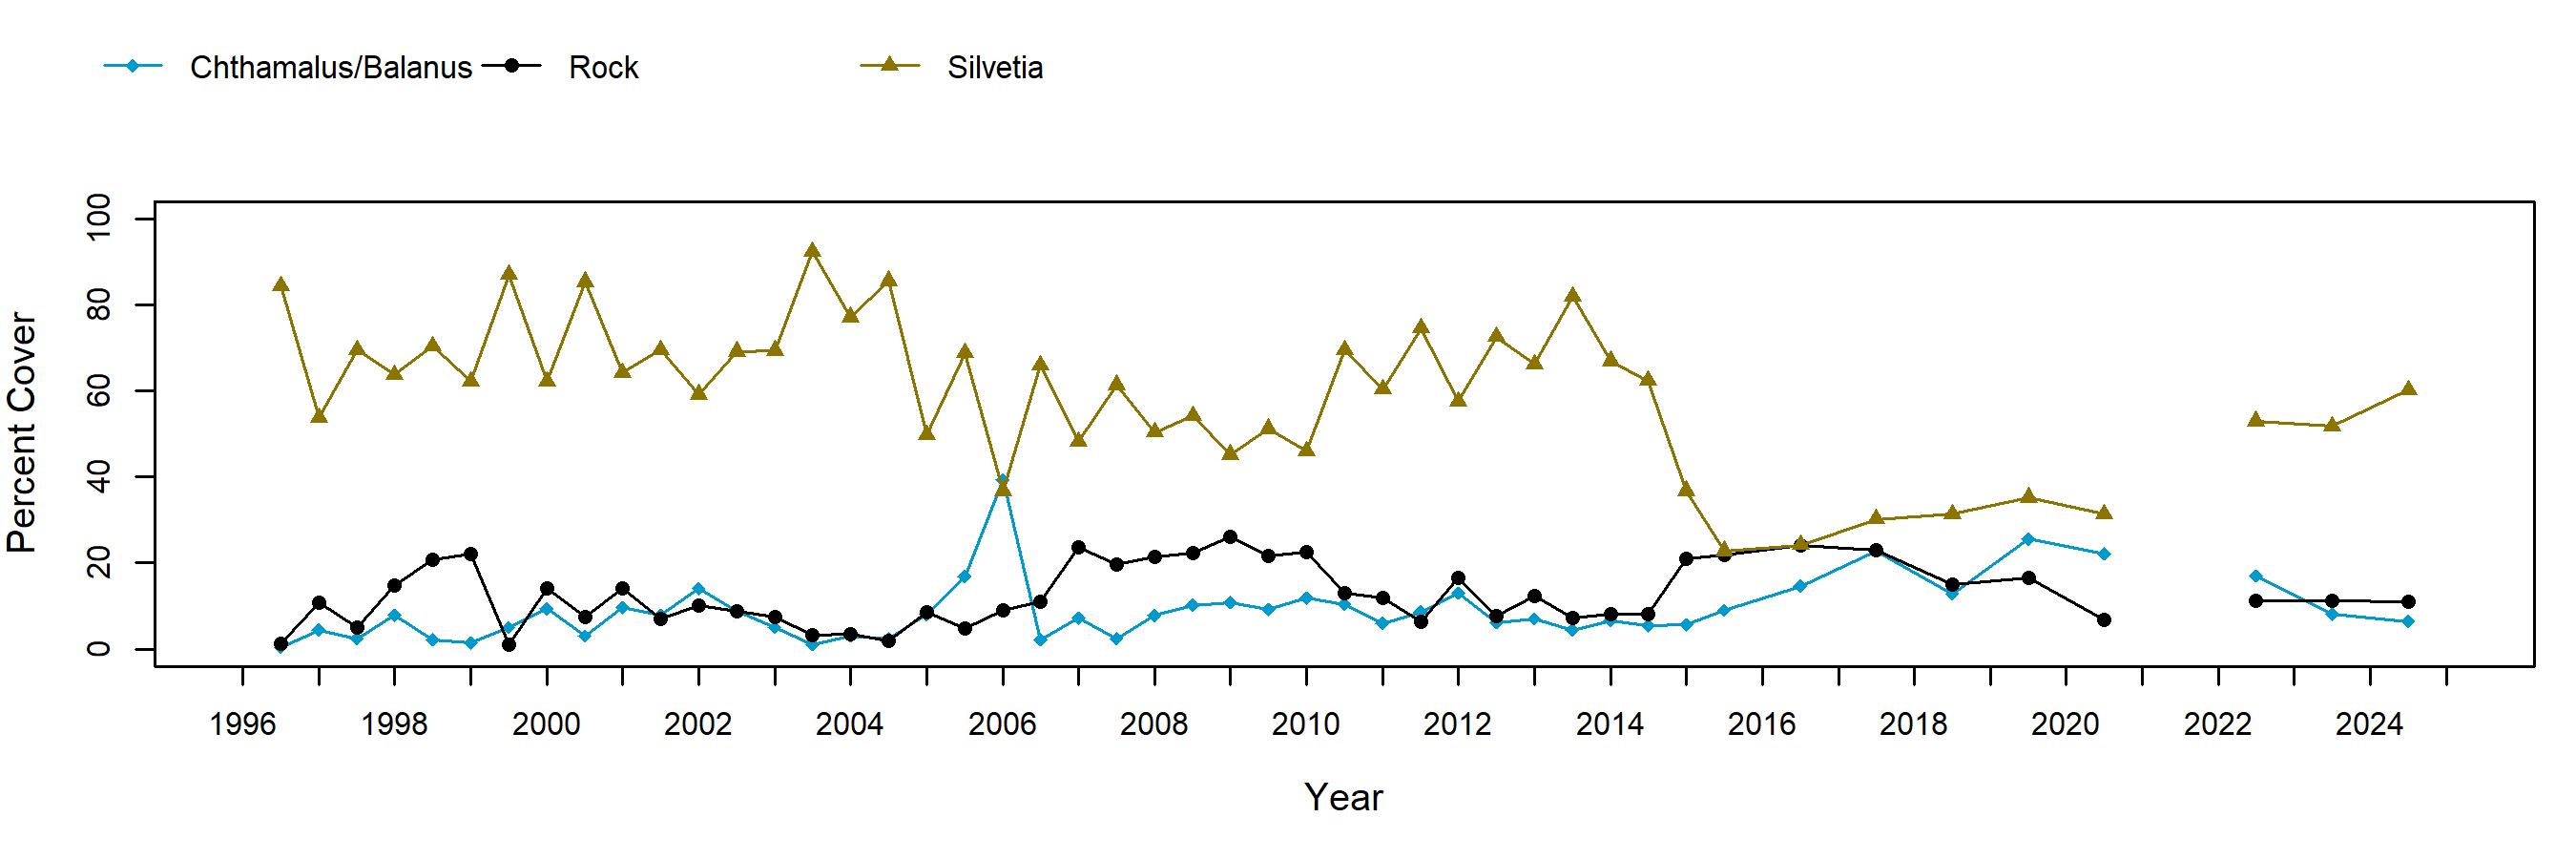
Silvetia (Golden Rockweed) – percent cover
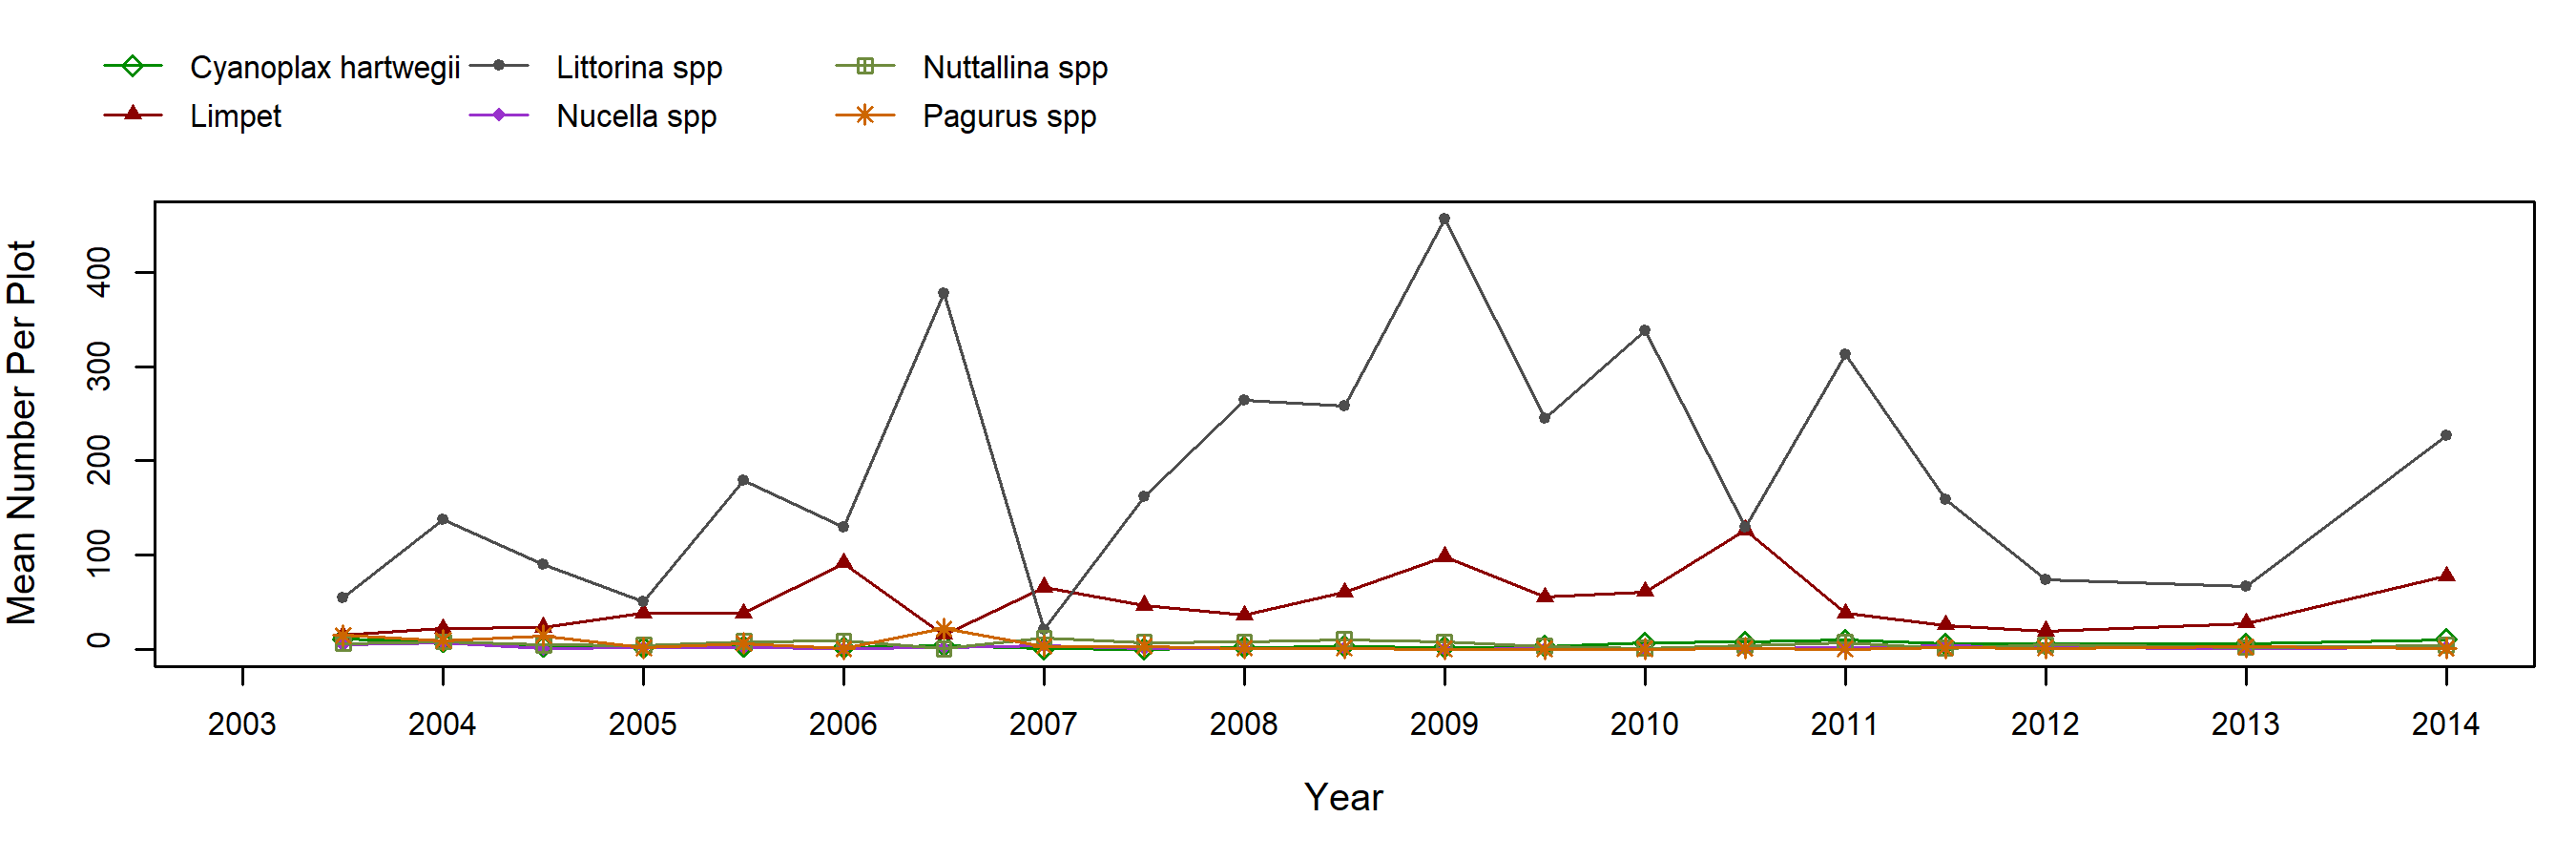
Silvetia (Golden Rockweed) – motile invertebrate counts
Rock (Above Barnacles) – percent cover
Rock (Above Barnacles) – motile invertebrate counts
Species Counts and Sizes

Species Counts and Sizes (where recorded) for Pisaster are shown below for this site. At some sites, other sea star species and Katharina are counted in addition to Pisaster. The sum of all individuals across all plots is displayed. Note that data gaps are represented by breaks in long-term count trend lines, but are not shown in size plots.
Pisaster ochraceus (Ochre Star) – counts
Pisaster ochraceus (Ochre Star) – sizes