
Dana Point Long-Term trends | MARINe
Dana Point Long-Term trends
See below for trend graphs
In order to standardize species resolution across all MARINe groups, and over time, some species (typically rare) were lumped for graphical presentation of long-term monitoring data. See lumped categories for definitions (some variation occurs between methods and over time). Due to funding constraints, semi-annual sampling of plots/transects was reduced to annual sampling beginning in 2016.
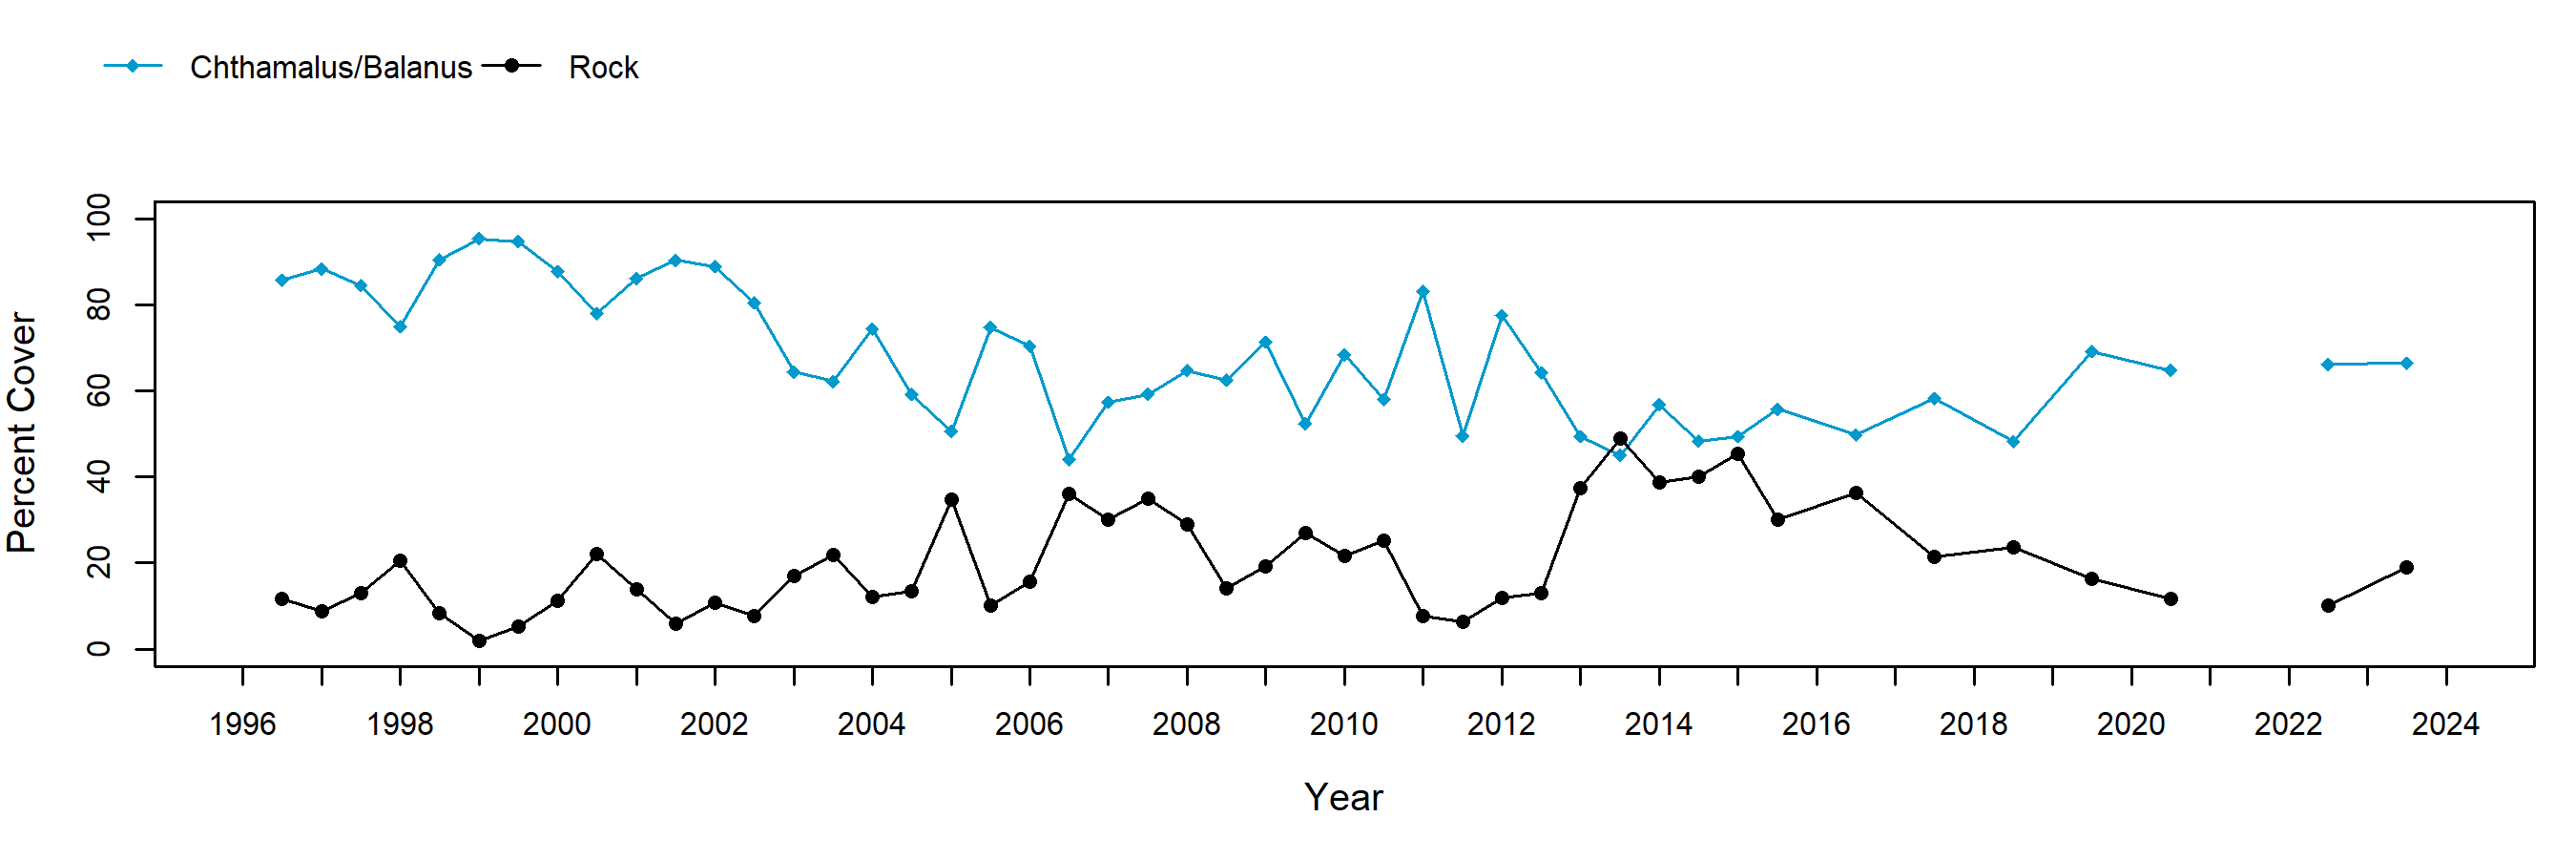
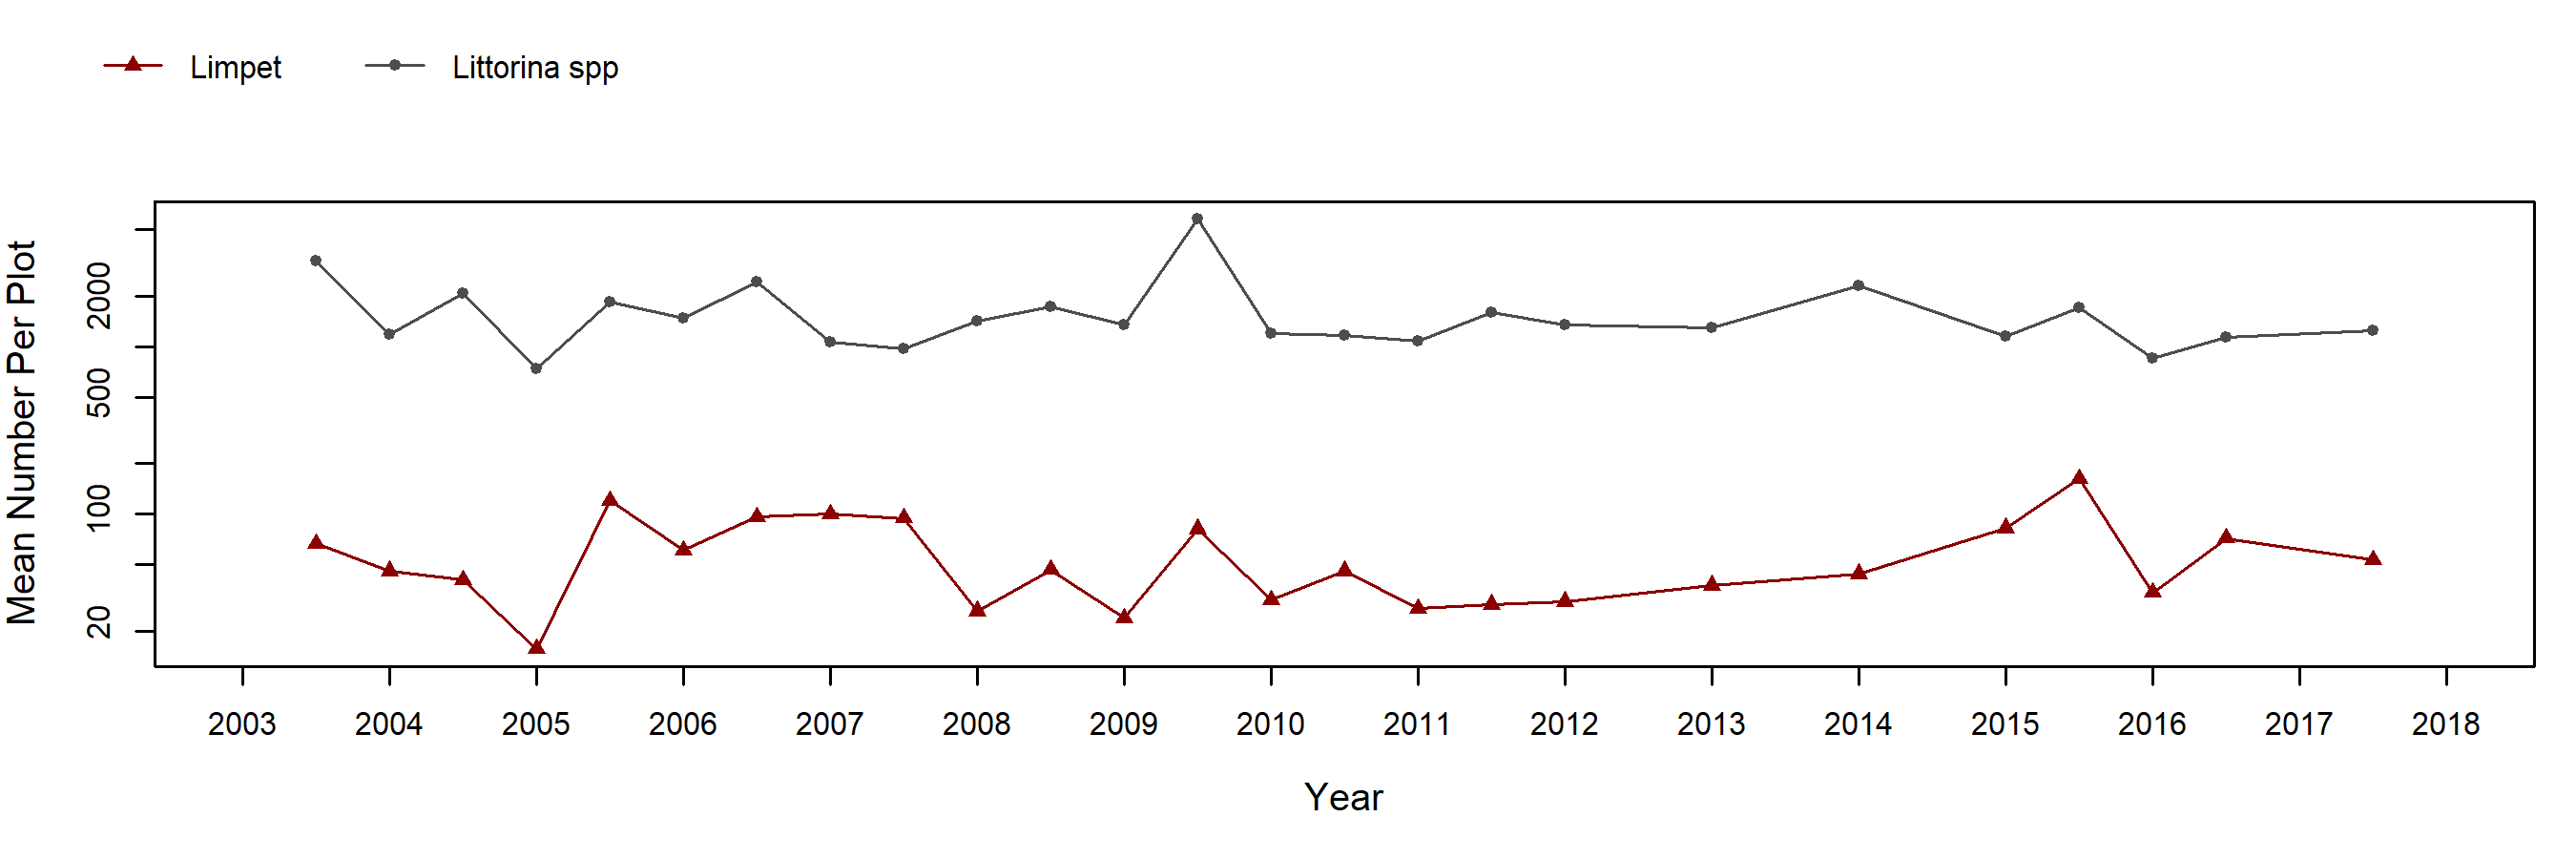
Barnacle plots were established at Dana Point in 1996. In the late 1990s and early 2000s, acorn barnacles covered on average more than 60% of the surface in these plots. Since 2003, barnacle cover has been highly variable among survey periods, fluctuating between a low mean of ~40% to a high mean of ~80% cover. While cover remained consistently around 60% from 2013 – 2018, 2019 surveys documented an overall increase in the area of the plots covered by acorn barnacles. Generally, the area not occupied by barnacles in these plots remained bare (recorded as bare rock). However, occasionally small amounts of algae (including the rockweed Silvetia, the ephemeral sea lettuce Ulva, the brown blade Petalonia and the red turf Caulacanthus) temporarily occupied small amounts of space. Snails in the genus Littorina have been consistently found in very high abundance in these plots, while limpets (genus Lottia) have also consistently present at much lower densities than Littorina.
The abundance of Mytilus in permanent mussel plots at Dana Point has also fluctuated over time, but on a longer time-frame than the fluctuations observed for acorn barnacles in the barnacle plots. When the plots were established in 1996, cover was uniformly high. Subsequently we saw a decline in cover (from a mean > 90% to a mean ~ 60%) during the 1997-1998 El Niño. After a long and slow period of recovery, we saw another dip in cover in spring 2007 following a storm with extraordinarily large waves. As we observed at other sites in this region (e.g. Crystal Cove) at Dana Point our data indicate that the effects of the storm were variable in space, with some plots losing more of their mussel cover than other plots. Plots that lost large numbers of mussels were slow to recover, and on average mussels covered less than than 75% of plot area until the end of 2010, when cover slowly increased for several years (to an average of over 80% cover in Spring 2012). In 2013 cover again started to decline (potentially related in part to stormy weather in Spring 2013). After several years of low (mean 40 – 50%) cover, abundance began to increase again, As of Fall 2018 mussels covered, on average, ~ 90% of the surface of the plots. Over the duration of our monitoring, following a drop in mussel cover, space on the rock not covered by mussels typically remained bare except for occasional recruitment of barnacles (acorn barnacles and Tetraclita). Low and fluctuating cover of the red turf alga Caulacanthus has been observed on top of mussels in several plots since the early 2000s. Mobile invertebrate surveys through 2014 recorded several types of molluscs in low abundance in mussel plots, including chitons in the genus Nuttallina, the turban snail Tegula funebralis, periwinkles (genus Littorina). Limpets (genus Lottia) have been recorded in consistently high abundance in these plots since 2003.
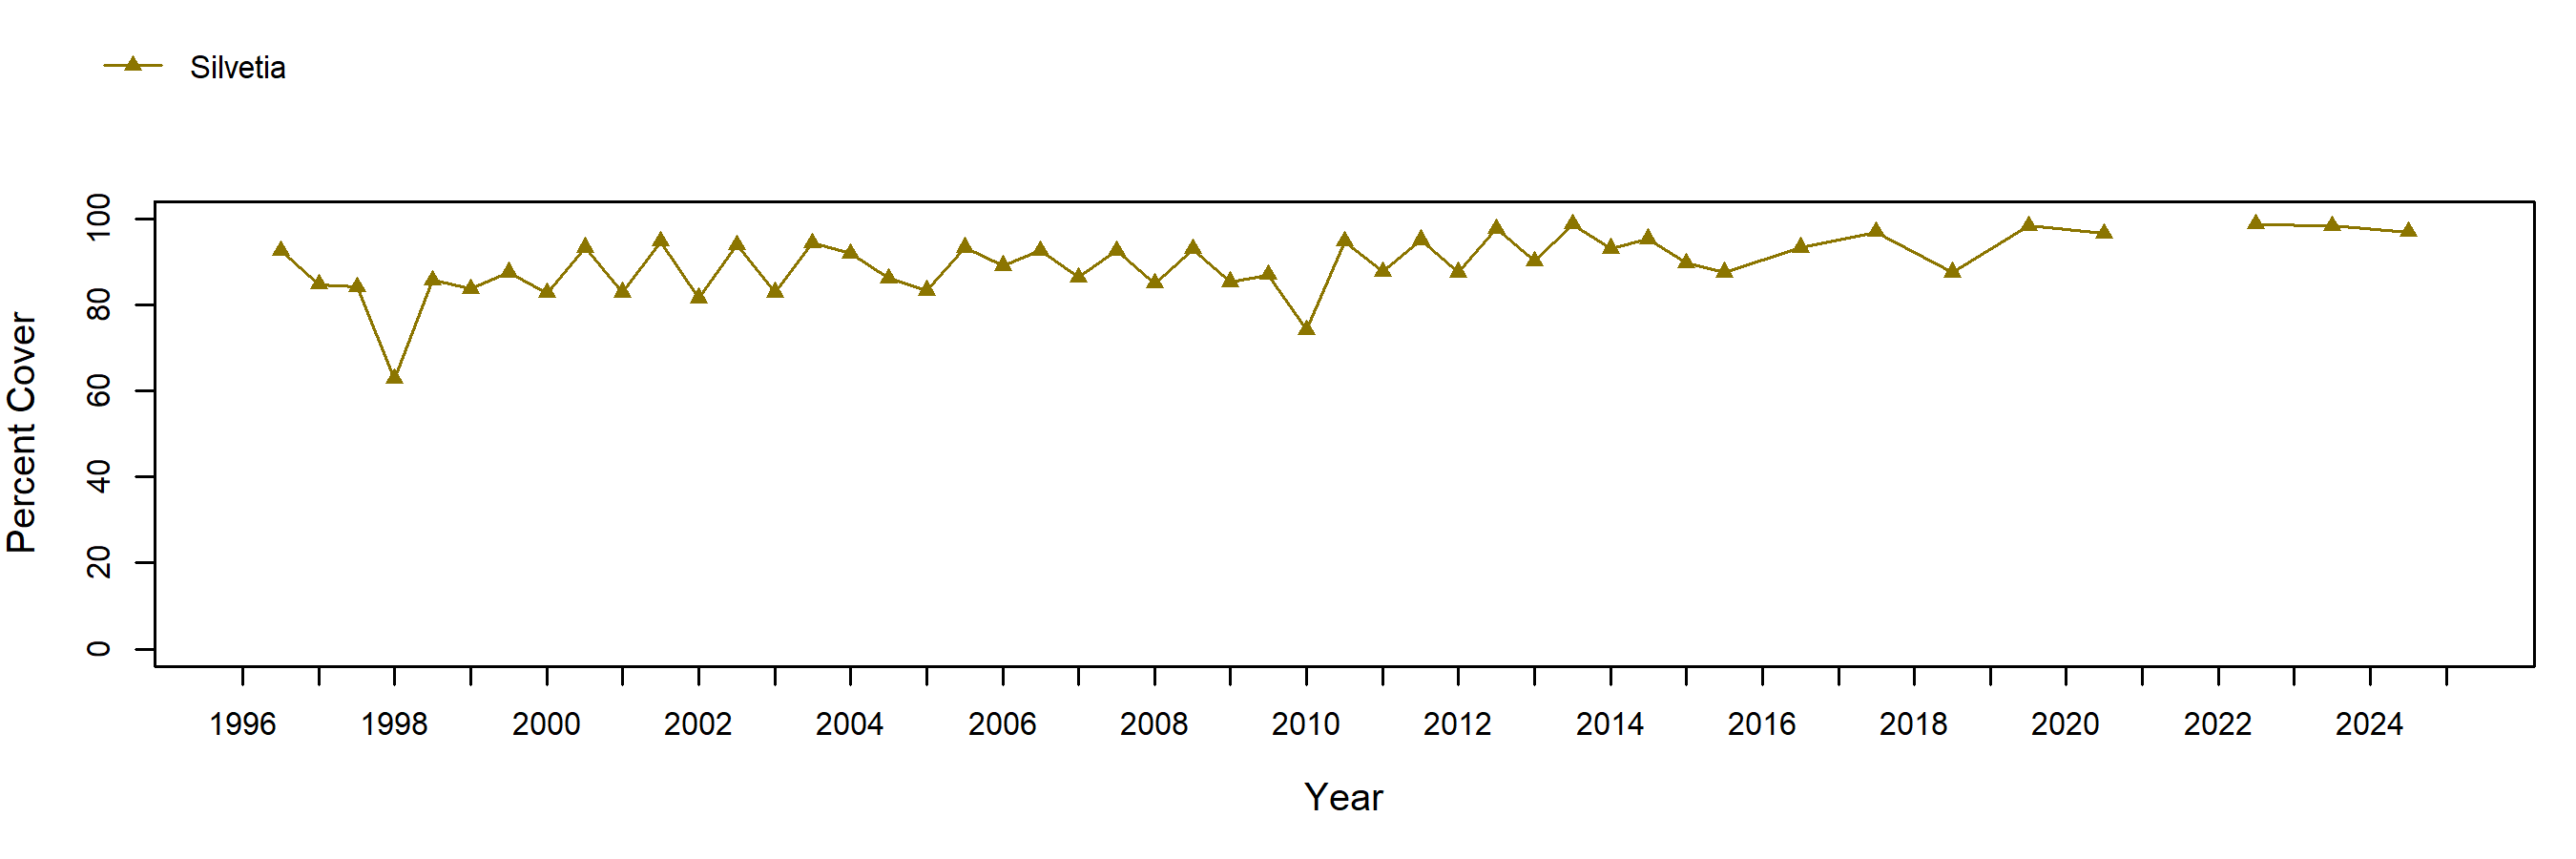
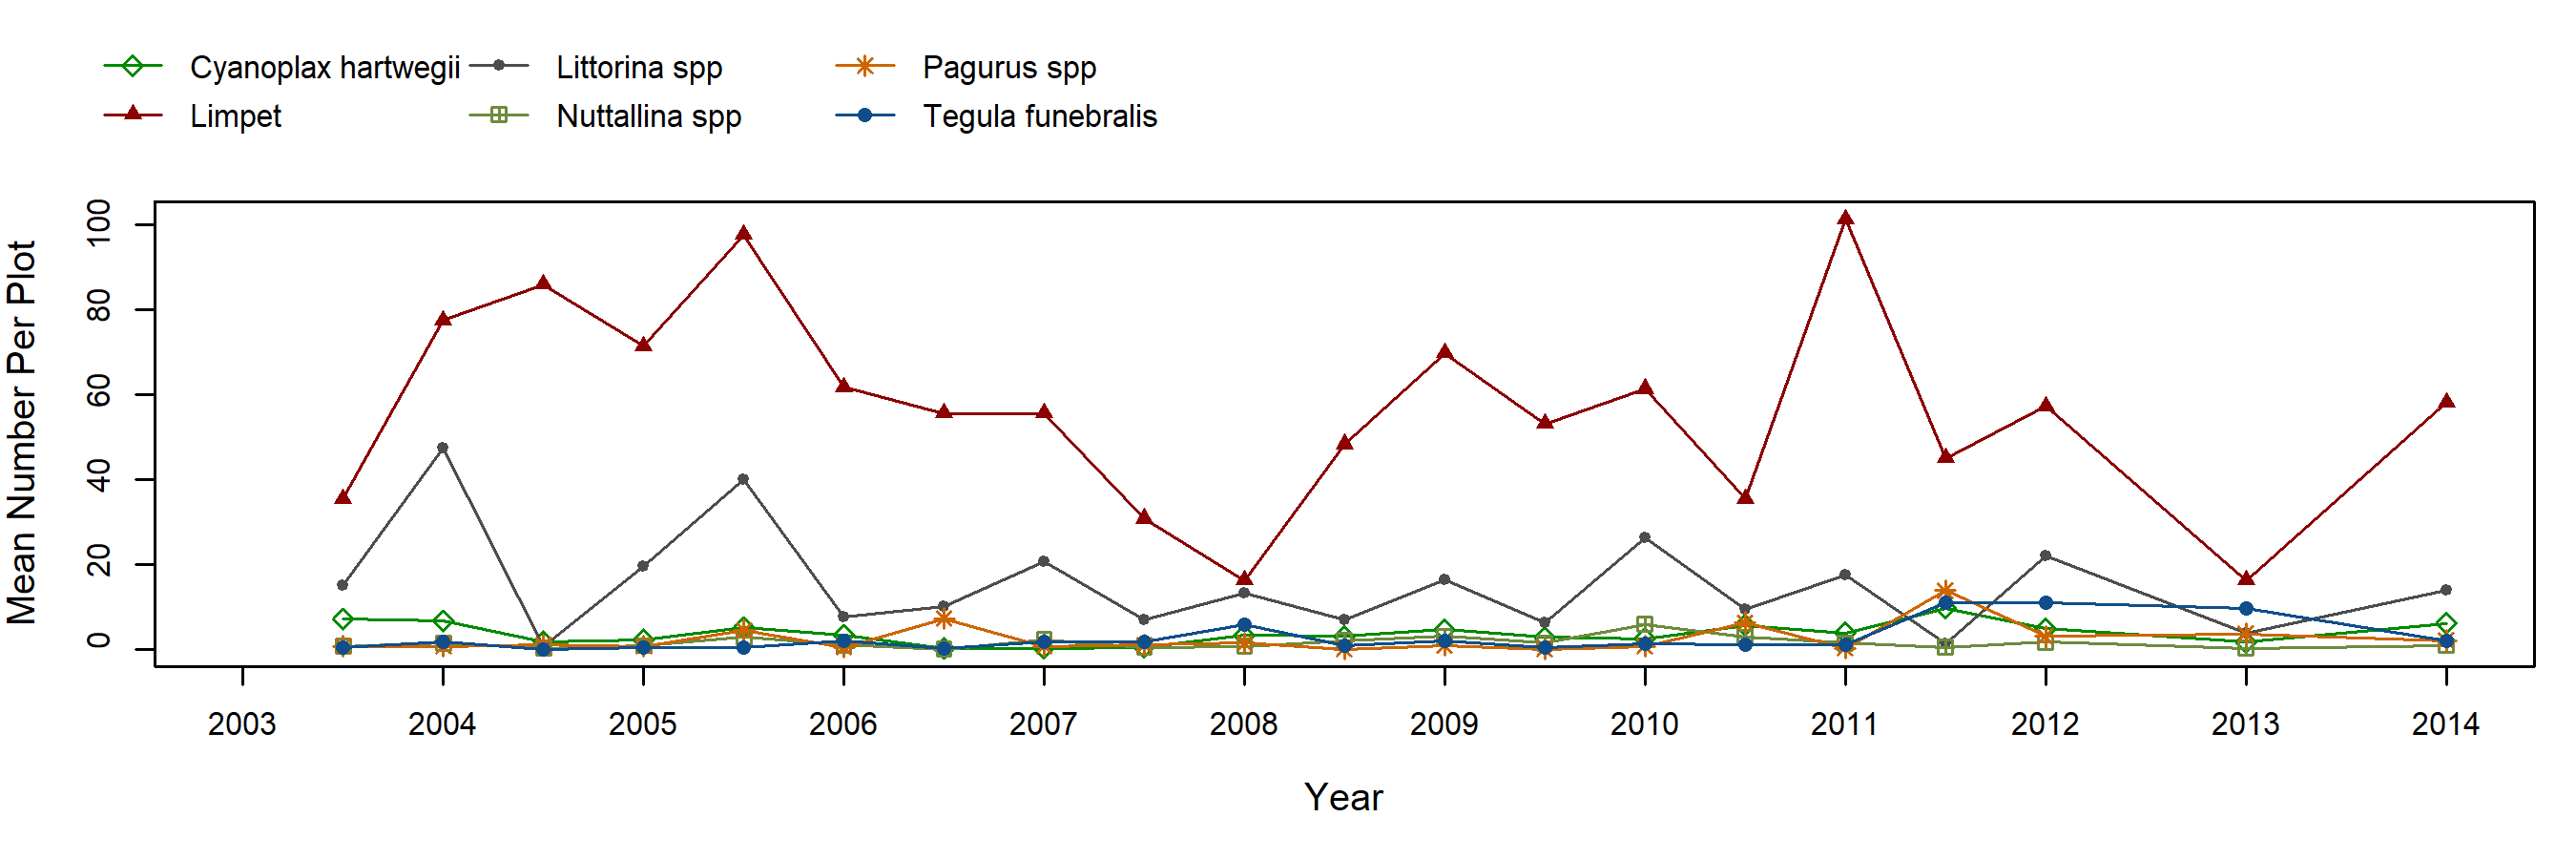
Rockweed cover at this site has been consistently high (on average above 60% of plot area) in permanent plots since their establishment in 1996, exhibiting only a small amount of fluctuation between seasons (often with higher cover in fall than in spring). When the cover of Silvetia dipped, we recorded increased cover of bare rock, the red turf alga Caulacanthus (which appeared at low levels in a few plots) and crustose algae. Counts of mobile invertebrates in Silvetia plots from 2003 – 2014 recorded high but variable abundances of limpets (from a high average of 100 individuals per plot to a low average of approximately 20 individuals per plot) and low abundances of periwinkles (genus Littorina),chitons (Nuttallina and Cyanoplax), hermit crabs (Pagurus) and turban snails (Tegula funebralis).
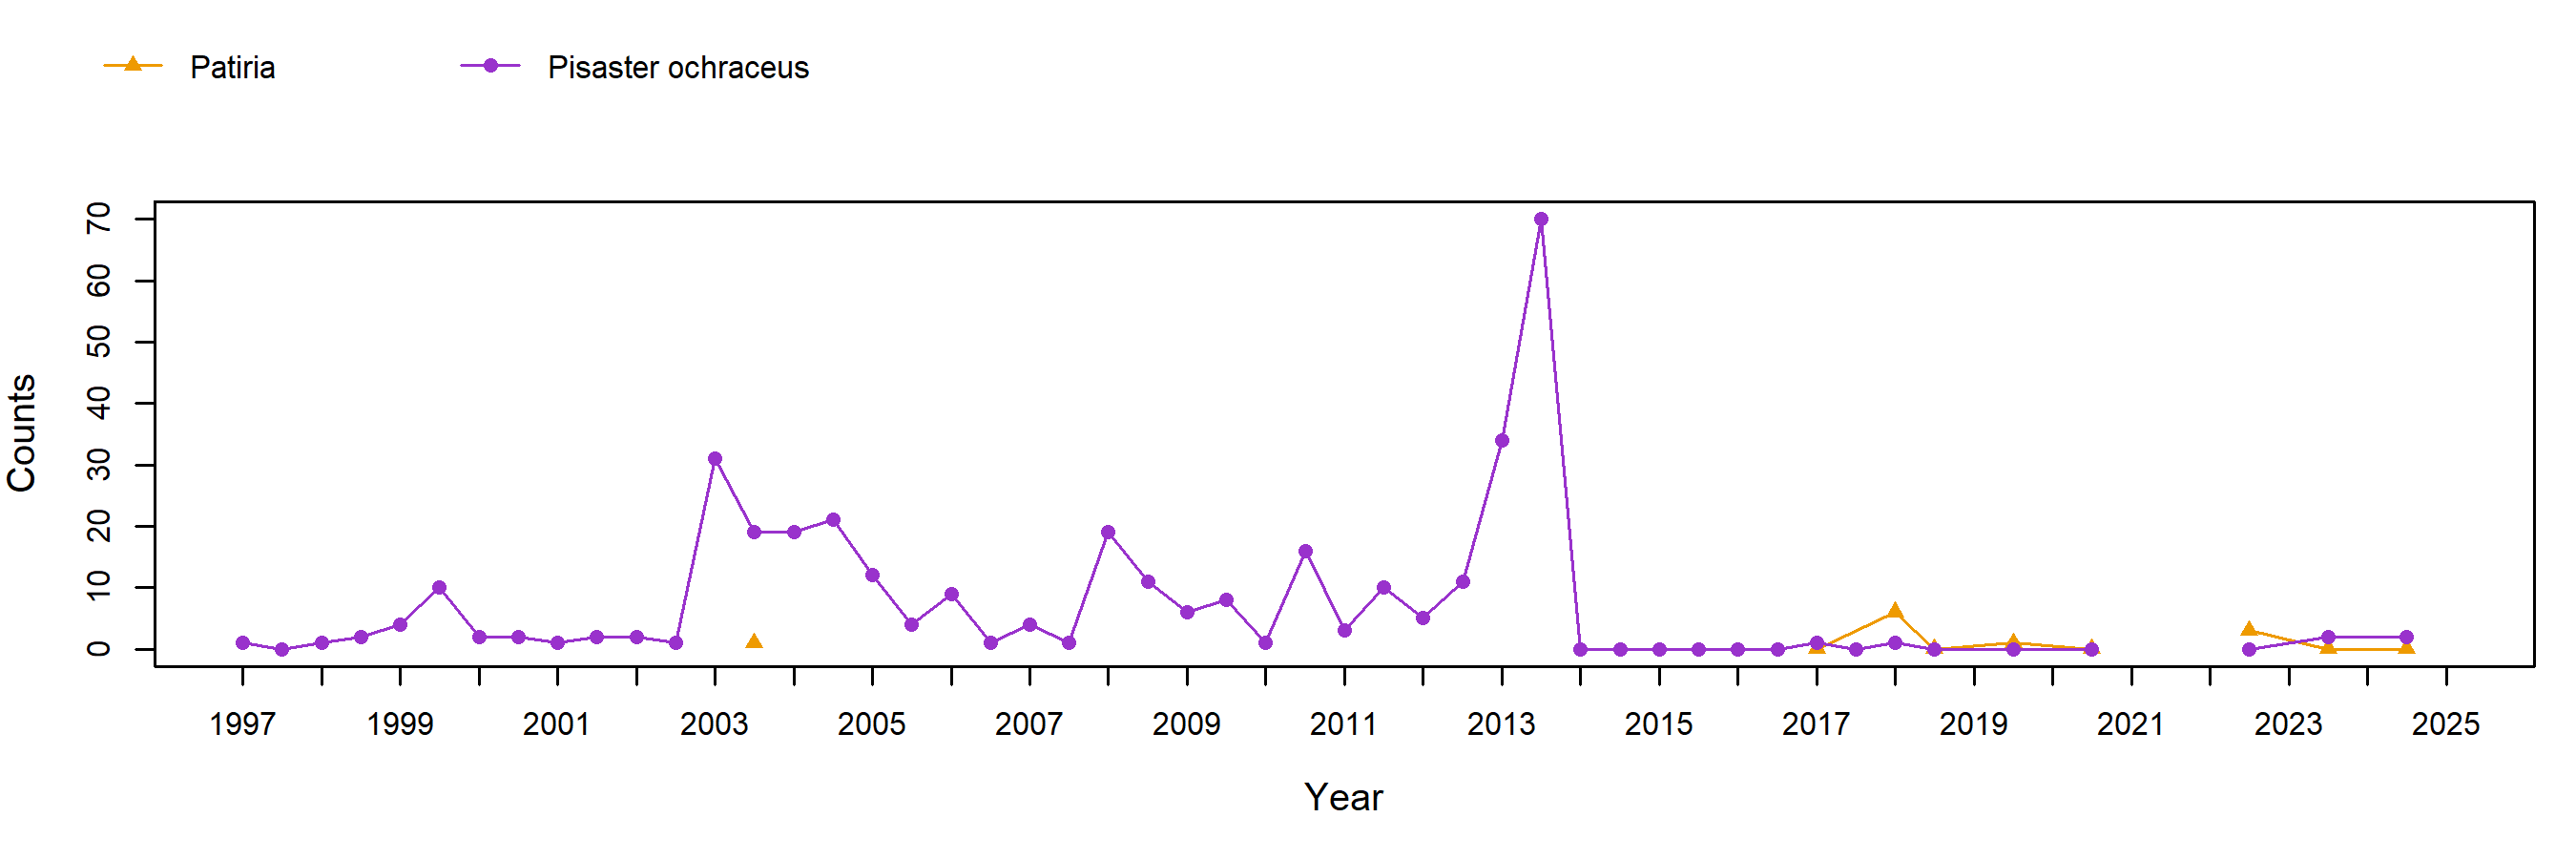
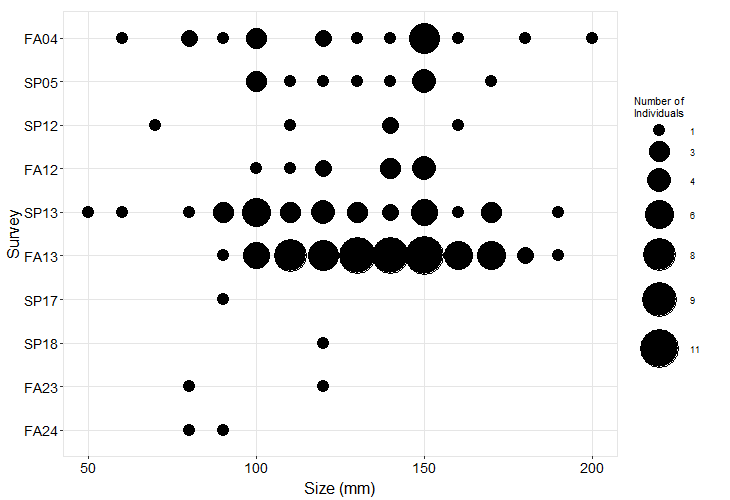
The number of sea stars (Pisaster) encountered during our surveys fluctuated greatly over the sampling period. From 1996 through 2002, numbers were very low (maximum = 10 individuals in Fall 1999) even in comparison to other Orange County Sites (see Crystal Cove, Shaws Cove, and Treasure Island). Abundance was slightly higher from 2003 – 2012 (counts ranged from a low of 1 individual to a high of 30 individuals encountered per survey) and measurements during this period (2004-2005 and 2012) indicated that most individuals fell into the 100 to 150 mm size class. Similar to the pattern at other Orange County sites, Pisaster numbers increased sharply in 2013, reaching a count of 70 individuals in fall of that year. Measurements in Spring and Fall 2013 show that most individuals fell in the 100 to 150 mm size class, but individuals as small as 50mm and as large as 190 mm were present at the site. Following the Fall 2013 survey, counts dropped sharply (to 0 in Spring 2014) and remained low: only two individuals (both < 150 mm) were counted during surveys from 2014 and 2019. Sea Star Wasting Syndrome, which was observed at multiple sites in this region after our Fall 2013 survey, is a likely contributor to the sharp decline.
Photo Plots
Below are the trends observed for each Photo Plot target species at this site. Long-Term percent cover trend graphs also include any species that reached a minimum of 25% cover during any single point in time within a given target species assemblage. Breaks in trend lines represent missed sampling events. For additional species observed that did not meet this 25% threshold, please use the Interactive Map.
For motile invertebrate Species Counts, a mean across all plots was calculated, and only those species with a value of at least 5 individuals for at least one sample are shown. Due to time constraints, motile invertebrate counts have not been done at most sites since 2012. For motile invertebrate size trend graphs by site, please use the Interactive Map.
Chthamalus/Balanus (Acorn Barnacles) - percent cover
Chthamalus/Balanus (Acorn Barnacles) - motile invertebrate counts
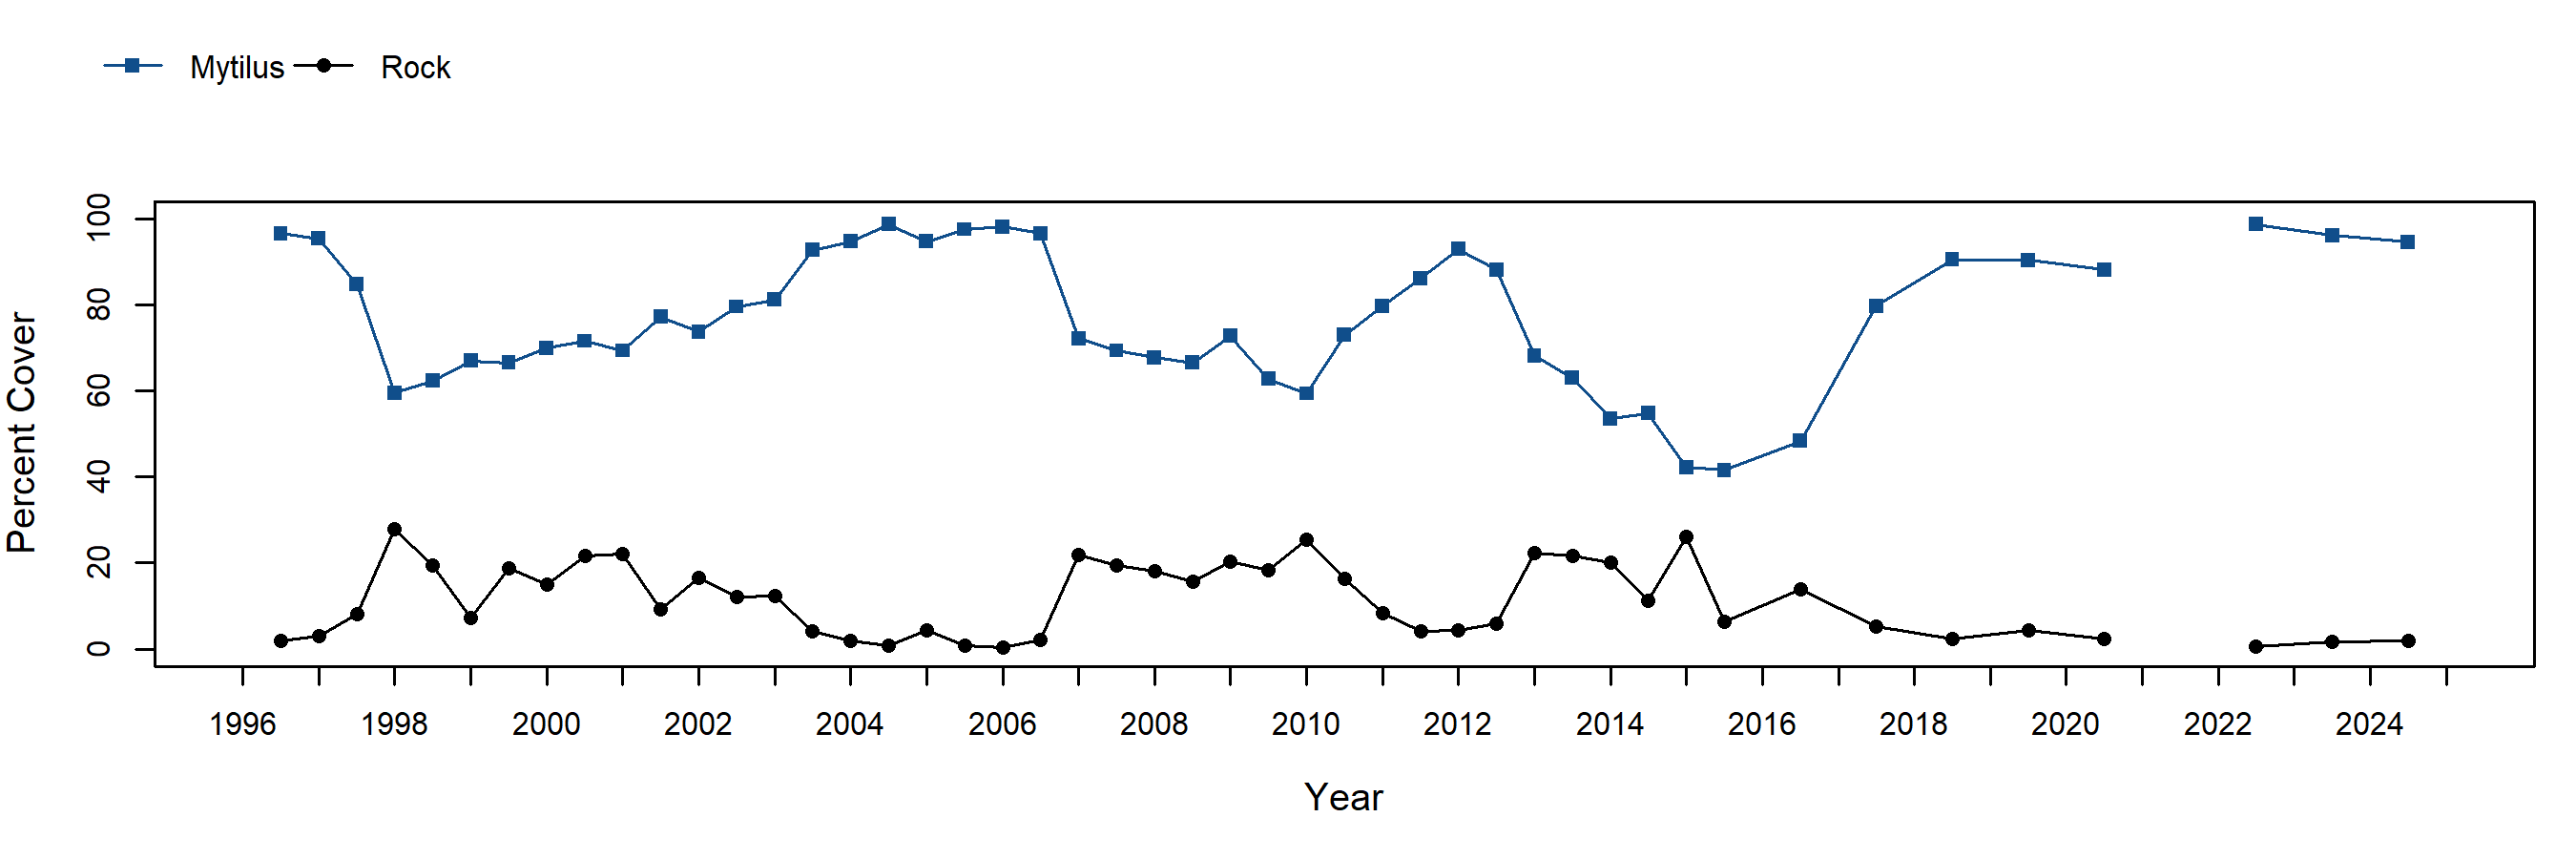
Mytilus (California Mussel) - percent cover
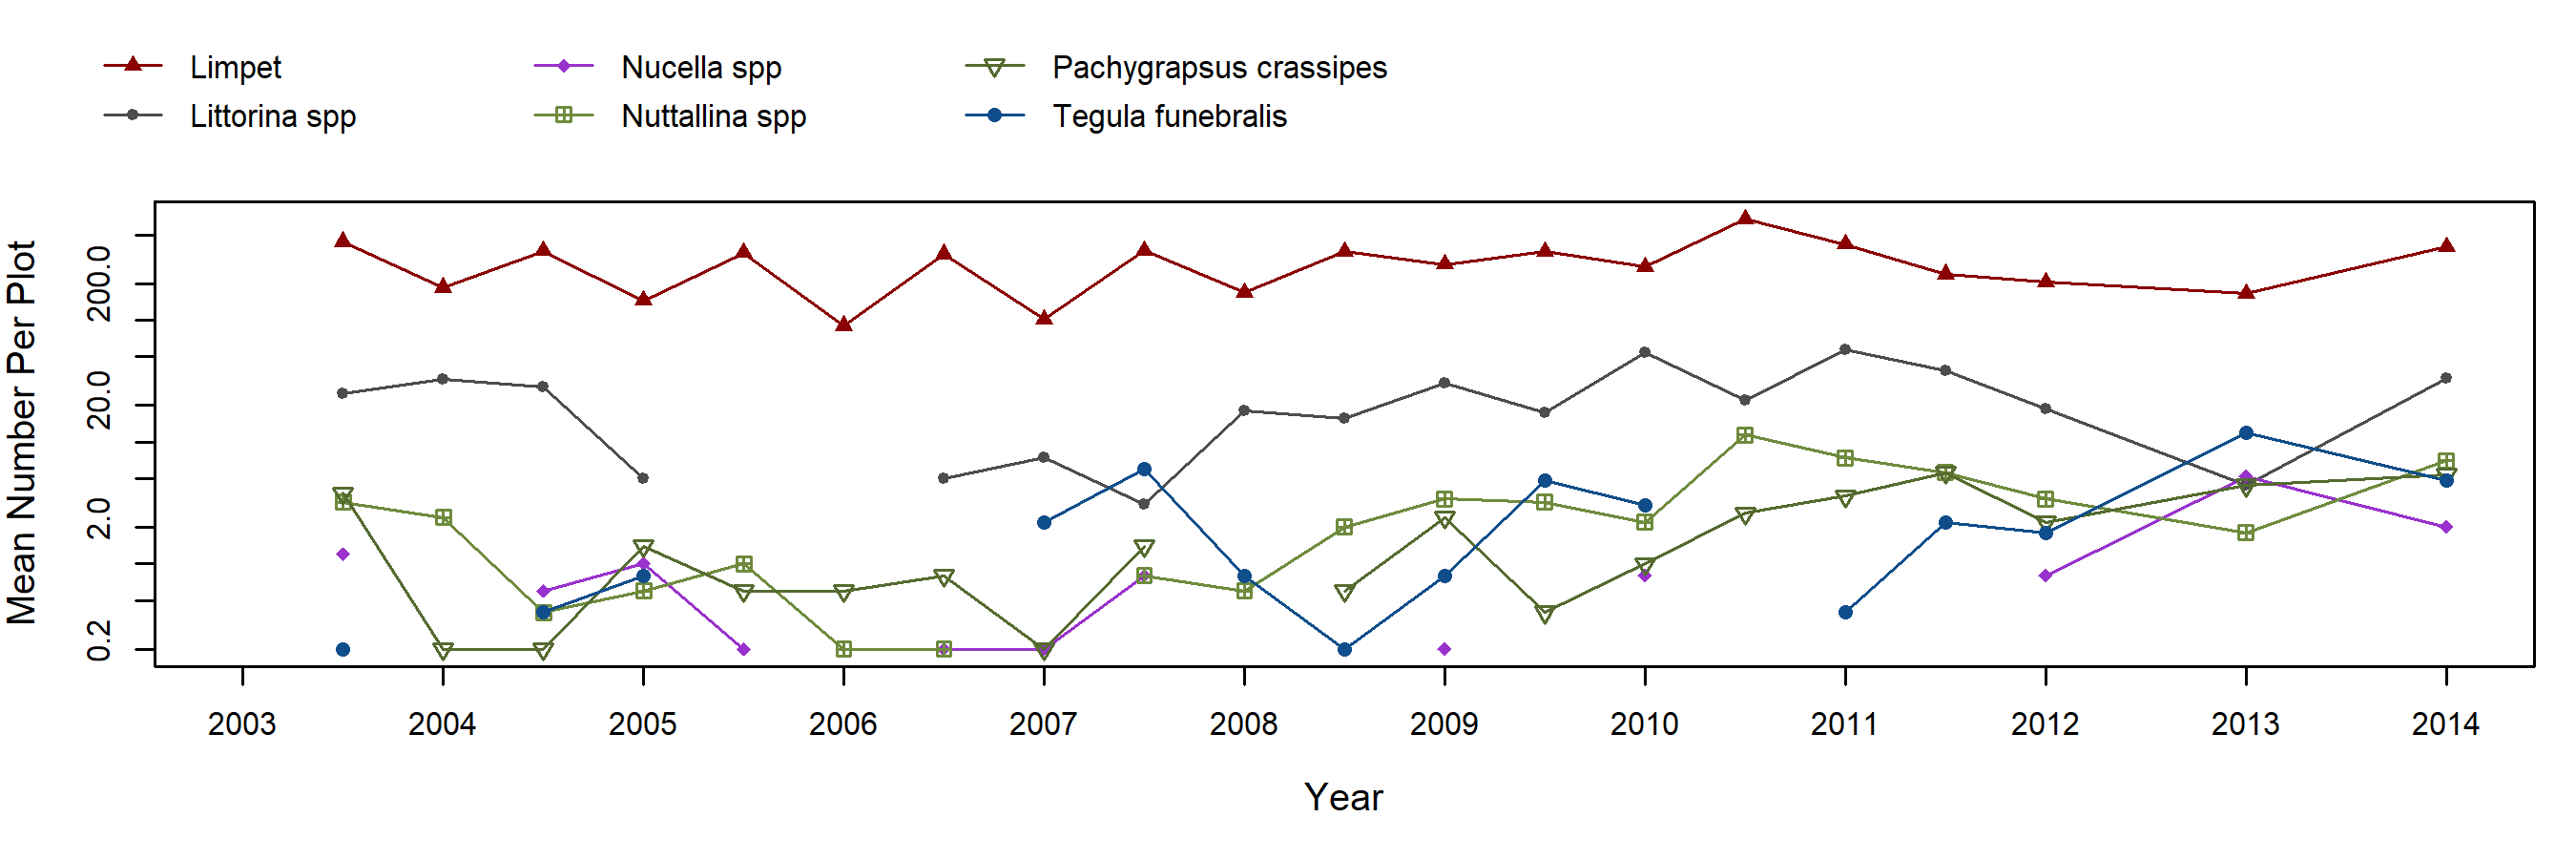
Mytilus (California Mussel) - motile invertebrate counts
Silvetia (Golden Rockweed) - percent cover
Silvetia (Golden Rockweed) - motile invertebrate counts
Species Counts and Sizes
Species Counts and Sizes (where recorded) for Pisaster are shown below for this site. At some sites, other sea star species and Katharina are counted in addition to Pisaster. The sum of all individuals across all plots is displayed. Note that data gaps are represented by breaks in long-term count trend lines, but are not shown in size plots.
Pisaster ochraceus (Ochre Star) - counts
Pisaster ochraceus (Ochre Star) - sizes
See Also
